Authors: Carlotta Buck, Antonia Lietz, Mareike Martens
Edited by: –
Last updated: October 1, 2023
Executive summary
Road transport and motor vehicles are critical for global mobility and economic growth, but they pose significant sustainability challenges. The sector accounts for a large share of greenhouse gas emissions, air pollution, and noise, making environmental and social impacts severe.
Historically, road transport evolved from early paved roads to modern highways, enabling trade and connectivity. Today, passenger transport is dominated by private cars, while freight relies heavily on trucks. This dependence creates congestion, accidents, and resource depletion.
Sustainability strategies focus on three pillars: technologies, infrastructure, and policies. Technological solutions include electric vehicles, hydrogen fuel cells, and alternative fuels. Infrastructure measures emphasize urban planning, integrated land use, and traffic management. Policies involve pricing mechanisms, emission standards, and awareness campaigns to promote eco-driving and shared mobility.
Social aspects such as gender equality, safety, and accessibility remain critical. Women are underrepresented in transport jobs and face safety concerns in public transport. Road traffic accidents are a leading cause of death globally, especially in low-income countries.
Measurement of sustainability relies on indicators like emissions, air quality, congestion, and safety. Effective strategies require integrated approaches combining short-term behavioral changes with long-term technological adoption.
Drivers of sustainable transport include government incentives, technological innovation, and environmental awareness. Barriers include high EV costs, limited charging infrastructure, and range anxiety. Addressing these challenges is essential for achieving climate goals and improving social well-being.
1 Definition and relevance
As a response to an increasing population, and with it a rising need of moving passengers and freight, the road transport sector continuously gains importance.1Tolley, R., Tolley, R. S., Turton, B. J. & Turton, B. J. Transport systems, policy and planning: a geographical approach. (Wiley, 1995). The industry of road transport and motor vehicles plays a critical role in the global economy as it facilitates the movement of individuals and goods in multiple ways. Thereby, a distinction is drawn between passenger and freight transport.2European Commission. Joint Research Centre. The future of road transport : implications of automated, connected, low-carbon and shared mobility. (Publications Office, 2019). The types of vehicles used in road transport include motorized vehicles like cars, motorcycles, buses, and heavy goods vehicles like trucks but also non-motorized vehicles such as bicycles.
1.1 Background and significance of road transport and motor vehicles
The foundations of road transport have been laid early around 3000 B.C. when the first paved roads emerged in West Asia.3Rodrigue, J.-P. The Geography of Transport Systems. (Routledge, 2020). doi:10.4324/9780429346323. The history of road transport developed further with the creation of trading routes. Till 100 B.C. by means of the Silk Road a first cross-continental trading route from Europe to Asia has been built.3Rodrigue, J.-P. The Geography of Transport Systems. (Routledge, 2020). doi:10.4324/9780429346323. The concept of mechanical road transport improved the industry first in the 18th century with the invention of steam-driven carriages. Later, in the 19th century the industry was further revolutionized by the construction of the first internal combustion engine (ICE).4Fenelon, K. G. The economics of road transport. (Routledge, 2017). Until then road transport evolved into a common mode of transportation for passengers and freight not solely because it became more affordable but also due to the creation of highways and the associated flexibility. Along the historical development of road transport, roads have proven to be an important driver for the establishment of trade, commerce, and industry as well as for the social and cultural evolution.4Fenelon, K. G. The economics of road transport. (Routledge, 2017).
In 2021, road transport accounted for the second largest share of EU freight transport with 24.6% after maritime transport with 67.9%. While maritime transport reached its lowest share of the decade, the share of road transport reached its peak with a steady increase which potentially indicates a shift in preferred modes of transport.5Eurostat. Freight Transport Statistics – Modal Split. Eurostat – Statistics Explainedhttps://ec.europa.eu/eurostat/statistics-explained/index.php?title=Freight_transport_statistics_-_modal_split#:~:text=The%20share%20of%20road%20transport%20in%20the%20total%20EU%20freight,in%202012%2C%20at%2022.0%20%25. (2023). This assumption is reinforced as road freight transport is projected to increase by 33% by 2030 and 55% by 2050.2European Commission. Joint Research Centre. The future of road transport : implications of automated, connected, low-carbon and shared mobility. (Publications Office, 2019). Currently, road freight transport is favored especially for short distances and as part of intermodal or multimodal transportation.6Crainic, T. G. & Kim, K. H. Chapter 8 Intermodal Transportation. in Handbooks in Operations Research and Management Science vol. 14 467–537 (Elsevier, 2007). Intermodal and multimodal transportation both describe the transit of goods using multiple types of vehicles, yet multimodal transportation is processed by just one contract and operator.7DHL International GmbH. Glossary. Glossary https://lot.dhl.com/glossary-index/m/ (2023). These types of transportation allow logistics services to reduce delivery time and cost, mostly as a result to increased flexibility, shown in the possibility of door-to-door deliveries. In most cases, door-to-door delivery is only possible by implementing road transport. To keep up with modern logistics, guarantee customer satisfaction, and maintain efficiency in transportation door-to-door delivery is indispensable.8Yin, W., He, S., Zhang, Y. & Hou, J. A Product-Focused, Cloud-Based Approach to Door-to-Door Railway Freight Design. IEEE Access 6, 20822–20836 (2018).
Passenger road transport in the EU is highly dominated by private motorized transport which includes transportation by car and motorcycle. In 2021 in Germany, private motorized transport accounted for the by far highest share of motorized passenger transport with almost 85%.9Statistisches Bundesamt (Destatis). Passenger Transport. Passenger Transporthttps://www.destatis.de/EN/Themes/Economic-Sectors-Enterprises/Transport/Passenger-Transport/Tables/passengers-carried.html (2023). Public road transport, consisting of buses and trams yields the second largest share with only about 12%. However, as mentioned previously this number also holds the share of trams and as these technically speaking are part of public rail transport, the proportion only for buses would be even lower.9Statistisches Bundesamt (Destatis). Passenger Transport. Passenger Transporthttps://www.destatis.de/EN/Themes/Economic-Sectors-Enterprises/Transport/Passenger-Transport/Tables/passengers-carried.html (2023). The share of passenger cars in Europe in 2021 was about 87%.10Statistisches Bundesamt (Destatis). Important Transport Indicators. Europe Transporthttps://www.destatis.de/Europa/EN/Topic/Key-indicators/Transport.html (2023). This indicates that not only in Germany but in all countries in Europe the dominating mean of transportation for passengers is the car. On average, about every second person in the EU owned a car in 2021.11Eurostat. Number of cars per inhabitant increased in 2021. News Articleshttps://ec.europa.eu/eurostat/web/products-eurostat-news/w/ddn-20230530-1#:~:text=In%202021%2C%20the%20average%20number,central%20and%20eastern%20EU%20members. (2023). As in 2015 the number of cars worldwide was 1.1 billion.12The number of cars worldwide is set to double by 2040. World Economic Forumhttps://www.weforum.org/agenda/2016/04/the-number-of-cars-worldwide-is-set-to-double-by-2040 (2016). According to The World Bank the population in 2015 reached 7.8 billion13Nitch Smith, M. World Development Indicatos. The World Bank – Data Cataloghttps://datacatalog.worldbank.org/search/dataset/0037712 (2023). which shows that around every 7thperson worldwide owned a car. However, by 2040 the number of total cars is projected to reach two billion. This would imply a duplication of the number of cars worldwide.12The number of cars worldwide is set to double by 2040. World Economic Forumhttps://www.weforum.org/agenda/2016/04/the-number-of-cars-worldwide-is-set-to-double-by-2040 (2016). The seemingly only restriction of car ownership is the lack of spatial capacity and infrastructure.3Rodrigue, J.-P. The Geography of Transport Systems. (Routledge, 2020). doi:10.4324/9780429346323.
Road transport plays a vital role on a global level regarding its economic significance and supply chains, accessibility and mobility, trade, and globalization as well as infrastructure development and impact on sustainability. Concerning economic significance, the automotive industry makes up over 6% of total employment in Europe, including both upstream and downstream industries. Additionally, over 7% of EU Gross Domestic Product (GDP) are generated by the automotive industry.14European Commission. Why the automotive industry is important. Automotive industryhttps://single-market-economy.ec.europa.eu/sectors/automotive-industry_en (2023). The automotive manufacturing industry generated a total revenue of 2.86 trillion USD in 2021.15Carlier, M. Automotive industry worldwide – statistics and facts. Statistahttps://www.statista.com/topics/1487/automotive-industry/#topicOverview (2023). However, economic significance of the road transport sector is not only due to its positive impact. A high number of road traffic accidents already result in a 3% loss of national GDP and additionally represent the main cause of congestion. Congestion is accompanied with additional costs, energy waste, and delays.3Rodrigue, J.-P. The Geography of Transport Systems. (Routledge, 2020). doi:10.4324/9780429346323.
1.2 Advantages and disadvantages of road transport
There are multiple reasons for the prominence of road transport for individuals and in freight logistics. Some of those being cost-efficiency, flexibility, and especially for passenger transport high relative speed.3Rodrigue, J.-P. The Geography of Transport Systems. (Routledge, 2020). doi:10.4324/9780429346323. As the vehicles are rather cheap and infrastructures for road transport mostly already exist the costs for transportation are comparatively low. Additionally, 95% of costs for infrastructure are covered by the public sector. Thus, in most cases individuals do not need to pay for road use. Even though road transport is said to be flexible, there is still a path dependency effect of road transport networks as individuals have to depend on existing infrastructures.3Rodrigue, J.-P. The Geography of Transport Systems. (Routledge, 2020). doi:10.4324/9780429346323. Further, road users have a limited influence when it comes to improvement of infrastructures as the operating cost is not paid directly but rather indirectly in terms of tolls or taxes.3Rodrigue, J.-P. The Geography of Transport Systems. (Routledge, 2020). doi:10.4324/9780429346323.
Not every individual is in the position to choose their preferred mean of transportation based on characteristics like flexibility and speed. Income and social status but also the spatial structure of the city cannot be disregarded as core factors.16Jong, G. C. D. & Riet, O. V. D. The Driving Factors of Passenger Transport. European Journal of Transport and Infrastructure Research Vol 8 No 3 (2008) (2008) doi:10.18757/EJTIR.2008.8.3.3348. Due to their spatial structure overall car usage and car ownership is lower in bigger cities.2European Commission. Joint Research Centre. The future of road transport : implications of automated, connected, low-carbon and shared mobility. (Publications Office, 2019). Along increasing population density congestion becomes a larger problem.16Jong, G. C. D. & Riet, O. V. D. The Driving Factors of Passenger Transport. European Journal of Transport and Infrastructure Research Vol 8 No 3 (2008) (2008) doi:10.18757/EJTIR.2008.8.3.3348. Further, the public transport infrastructure in bigger cities like London is better than in smaller cities. This is mostly due to a higher number of policies that incentivize the use of public transportation.17Santos, G., Behrendt, H. & Teytelboym, A. Part II: Policy instruments for sustainable road transport. Research in Transportation Economics 28, 46–91 (2010). Further, road transport significantly contributes to environmental issues, including air pollution, greenhouse gas (GHG) emissions, and resource depletion.18Santos, G. Road transport and CO 2 emissions: What are the challenges? Transport Policy 59, 71–74 (2017). Therefore, it is necessary to implement policies and other measures to transform the road transport industry.
In recent years, there has been a growing emphasis on all three pillars of sustainability within the road transport sector, aiming to minimize its negative impact on the environment while promoting more efficient and eco-friendly practices. As roads inhabit different types of users, conflicts resulting in accidents often occur. Not only motorized but also non-motorized vehicles as well as pedestrians use roads. Vulnerable Road Users (VRUs) include pedestrians, motorcyclists, horse riders, and cyclists.19Williams, I. D. & Blyth, M. Autogeddon or autoheaven: Environmental and social effects of the automotive industry from launch to present. Science of The Total Environment 858, 159987 (2023). In the case of missing road safety and inadvertency, VRUs represent the users that are more likely to be involved in accidents that result in road traffic deaths.20Maciorowski, M. M. & Souza, J. C. Urban Roads and Non-Motorized Transport: The Barrier Effect and Challenges in the Search for Sustainable Urban Mobility. Transportation Research Procedia 33, 123–130 (2018).
In conclusion, the motor vehicle industry comes with personal and societal benefits such as independence, job creation, improved quality of life from opportunities to travel, contribution to GDP, and revenue generation. However, there are also downsides with regards to social, economic, and environmental sustainability. Among other factors these include air pollution, GHG emissions, and accidents due to a lack of road safety which additionally results in a 3% decrease in GDP.21World Health Organization. Road traffic injuries. Road traffic injuries https://www.who.int/news-room/fact-sheets/detail/road-traffic-injuries (2022).
2 Sustainability impact and measurement
As briefly discussed in the previous chapter, the industry of road transport and motor vehicles has a significant impact on sustainability. This chapter will be dedicated to elaborating further on the environmental and social impact of road transport as well as how sustainability can be measured in this industry.
2.1 Environmental impact of road transport
The ever-growing significance of road transport and the associated high use of motor vehicles impose a substantial negative impact on the environment. Road transport causes the highest share of emissions in the transportation sector. Compared to other sectors these emissions are prospected to grow. As an example, the emissions from power generation shall achieve net zero by 2050 while the goals to reduce emissions caused by transportation are set less ambitiously. Here, the goal is to reduce emissions to 20% by 2030.22Ecology in Transport: Problems and Solutions. vol. 124 (Springer International Publishing, 2020). The GHG emissions from transportation primarily come from burning fossil fuels to power ICEs. An additional impact of road transport is that it has a negative influence on regional and local air quality and is the main source of noise in urban areas.23Mo & Wang. Environmental Sustainability of Road Transport in OECD Countries. Energies 12, 3525 (2019).
The transport sector alone accounts for around 25% of the world energy consumption.24Tsemekidi Tzeiranaki, S. et al. “The impact of energy efficiency and decarbonisation policies on the European road transport sector”. Transportation Research Part A: Policy and Practice 170, 103623 (2023). To reach the goal of a global temperature well below 2°C which was settled in The Paris Agreement all sectors must significantly reduce their carbon footprint.25Towards a climate-neutral europe: curbing the trend. (Routledge, 2020). In 2020, road transportation accounted for more than a tenth of global GHG emissions. Only the coal sector accounted for a larger share with 20% of global emissions.26Tiseo, I. Distribution of greenhouse gas emissions worldwide in 2020, by sub sector. Statistahttps://www.statista.com/statistics/1167298/share-ghg-emissions-by-sub-sector-sector-globally/ (2023). The International Energy Agency (IEA) states that in 2018 road transport accounted for roughly 75% of the total transport emissions worldwide. The largest contributor to this share is passenger transport including cars, motorcycles, buses, and taxis.27Ritchie, H. Cars, planes, trains: where do CO2 emissions from transport come from? Our World in Data https://ourworldindata.org/co2-emissions-from-transport (2020). This shows that if the road transportation sector is fully decarbonized, global emissions will be reduced significantly.
Environmentally sustainable transportation is defined as a form of transportation that does not endanger public health or ecosystems.23Mo & Wang. Environmental Sustainability of Road Transport in OECD Countries. Energies 12, 3525 (2019). However, road transportation in its traditional form is accountable for both. Especially in urban areas the population and the environment suffer severely from the emissions caused by motor vehicles.22Ecology in Transport: Problems and Solutions. vol. 124 (Springer International Publishing, 2020). The Organization for Economic Co-operation and Development estimates the costs of the health impact of air pollution to be $1.7 trillion of which road transport is responsible for half.23Mo & Wang. Environmental Sustainability of Road Transport in OECD Countries. Energies 12, 3525 (2019).
Since most emissions of road transportation come from passenger cars electric vehicles (EVs) are proposed as a solution to decarbonize transportation. The IEA estimates that EVs emit about 40-50% less CO2 emissions over their lifetime than ICEs.28IEA. Comparative life-cycle greenhouse gas emissions of a mid-size BEV and ICE vehicle. IEA, Paris https://www.iea.org/data-and-statistics/charts/comparative-life-cycle-greenhouse-gas-emissions-of-a-mid-size-bev-and-ice-vehicle (2021). In this calculation the emissions caused by EVs include emissions from vehicle manufacturing, battery assembly, battery minerals, and electricity. However, it is important to also take other factors like waste management and energy source into consideration.
2.2 Social impact of road transport
Regarding the social impact of road transport, the factors of gender equality, road safety, road condition, and accessibility need to be considered. Even though the share of women and men in the population is almost equal, gender equality is still a widely discussed topic. In the road transportation sector, the employment rate and salary differ severely among genders. However, also transportation mode, length of travel, and time of day are topics that women might reflect on more than men.29International Transport Forum. ITF work on Gender in Transport. International Transport Forumhttps://www.itf-oecd.org/itf-work-gender-transport.
Specifically in the transportation sector women are less likely to be involved in decision-making processes. As this sector is seen as a male-dominated sector women have limited access to occupations related to transport. In Europe, only 10% of women are bus drivers.30Duchene, C. Gender and Transport. OECD vol. 2011/11 https://www.oecd-ilibrary.org/transport/gender-and-transport_5kg9mq47w59w-en (2011). This is just one of several examples in which women are under-represented in the road transport sector. In total in 2020, women only made up 16% of all employees in the transportation sector. Even though most women that work in transport work in road transport the absolute number of women in that sub-sector is only 770,000.31Smit-Jacobs, K. Women working in transport. European Parliament – Think Tankhttps://www.europarl.europa.eu/thinktank/en/document/EPRS_ATA(2022)729293 (2022).
One of the factors of why women are under-represented in the road transport sector regards prejudices based on traditions of what is typically male or typically female. Gender stereotyping and the false perception of what women can or cannot do significantly influences women in their choice of occupation.32European Parliament. Women and transport. https://www.europarl.europa.eu/RegData/etudes/STUD/2021/701004/IPOL_STU(2021)701004_EN.pdf (2021). Additionally, the gender pay gap, traditional role allocation in childcare, violence or sexual harassment of women working in the transport sector, and limited possibilities for women to achieve managerial positions make jobs in transport less attractive for women.32European Parliament. Women and transport. https://www.europarl.europa.eu/RegData/etudes/STUD/2021/701004/IPOL_STU(2021)701004_EN.pdf (2021). In Germany, women earned roughly 18% less than men in 2022. While the gender pay gap for the sector of financial and insurance activities was 27% the transport sector only reported a gender pay gap of 3%.33Statistisches Bundesamt (Destatis). Quality of Employment – Gender Pay Gap. Statistisches Bundesamt (Destatis) https://www.destatis.de/EN/Themes/Labour/Labour-Market/Quality-Employment/Dimension1/1_5_GenderPayGap.html#:~:text=The%20gender%20pay%20gap%20was,few%20women%20were%20employed%20here. (2023). However, as mentioned above notably few women are employed in the transport sector. Although the trend towards stay-at-home dads is growing, women still spend noticeably more time on childcare which is why many women decide to work part-time.34Hamilton, K., Jenkins, L., Hodgson, F. & Turner, J. Promoting gender equality in transport. (Equality and Human Rights Commission, 2005). Regarding violence at the workplace, 44% of women working in transport reported to have experienced some type of violence at work within the last year in 2017.32European Parliament. Women and transport. https://www.europarl.europa.eu/RegData/etudes/STUD/2021/701004/IPOL_STU(2021)701004_EN.pdf (2021).
Due to physical differences women are more vulnerable to harassment than men. Therefore, specific safety measures at the workplace but also for public transport are necessary. As women on average feel more unsecure using public transport than men they tend to overall make less use of public transport, travel less in general and less alone, and travel more during the day than at night.34Hamilton, K., Jenkins, L., Hodgson, F. & Turner, J. Promoting gender equality in transport. (Equality and Human Rights Commission, 2005). Women’s concern about personal security in public transport is an issue that needs to be addressed with different policies and measures.
Currently, the safety issues of road transport that need to be tackled are on the one hand, about creating more secure public transport especially for women and on the other hand, about establishing policies that deal with road safety with regards to lowering the number of crashes. Road traffic accidents are the main cause of death for children and young adults of the age from 5 to 29. Worldwide, around 1.3 million people per year die as a result of road traffic crashes.21World Health Organization. Road traffic injuries. Road traffic injuries https://www.who.int/news-room/fact-sheets/detail/road-traffic-injuries (2022). Compared to other sectors, road transport is the sector accountable for the most deaths. Other common reasons of death are medical conditions.35World Health Organization. The top 10 causes of death. World Health Organizationhttps://www.who.int/news-room/fact-sheets/detail/the-top-10-causes-of-death (2020). The risk factors that frequently lead to road traffic injuries include speeding, driving under the influence of alcohol or other drugs, neglecting to use safety measures like helmets or seat-belts, distracted driving, and more.21World Health Organization. Road traffic injuries. Road traffic injuries https://www.who.int/news-room/fact-sheets/detail/road-traffic-injuries (2022). Injuries caused by road traffic are not only an issue with regards to social aspects but also economic aspects as those cause a decrease of GDP. In general, cities implement road safety better than the countryside, resulting in lower fatality rates in cities.2European Commission. Joint Research Centre. The future of road transport : implications of automated, connected, low-carbon and shared mobility. (Publications Office, 2019). However, this might also be due to an averagely lower speed in cities.
According to the World Health Organization, road injuries are under the top ten causes of death for low-income and middle-income countries. In fact, less than 10% of all road injuries occur in high-income countries.35World Health Organization. The top 10 causes of death. World Health Organizationhttps://www.who.int/news-room/fact-sheets/detail/the-top-10-causes-of-death (2020). This shows that another important factor to consider is road infrastructure which differs severely in developing countries compared to developed countries. Often times the transport infrastructure and road condition in developing countries is very poor and can hardly be improved due to limited financial resources.17Santos, G., Behrendt, H. & Teytelboym, A. Part II: Policy instruments for sustainable road transport. Research in Transportation Economics 28, 46–91 (2010). However, improving road conditions and thereby, increasing mobility will be crucial to enable economic growth in developing countries.17Santos, G., Behrendt, H. & Teytelboym, A. Part II: Policy instruments for sustainable road transport. Research in Transportation Economics 28, 46–91 (2010).
2.3 Measurement methods and effectiveness of sustainable transportation
There are many different methods to measure sustainability in the road transport sector. Measuring sustainability is crucial to draw conclusions, predict the future, and to implement methods to improve sustainability.36Let farmers judge: experiences in assessing the sustainability of agriculture. (Intermediate Technology Publications, 1992). Most researchers find the concept of indicators to be the most appropriate method of measuring sustainability. Specifically in the context of corporate responsibility strategies, businesses prefer to use indicators because they are easy to communicate and due to legal reasons, data has to be collected anyways and can be used easily to create or calculate indicators.37Joumard, R. & Gudmundsson, H. Indicators of environmental sustainability in transport: an interdisciplinary approch to methods. (INRETS COST, 2010).
Some of the indicators can simply be distributed among the three pillars of sustainability while assigning others is more difficult. As an example, pollution could be classified as an environmental indicator however, it markedly affects human health which would be a social indicator.37Joumard, R. & Gudmundsson, H. Indicators of environmental sustainability in transport: an interdisciplinary approch to methods. (INRETS COST, 2010). The multiplicity of indicators used to measure sustainable transport include air quality and water pollution3Rodrigue, J.-P. The Geography of Transport Systems. (Routledge, 2020). doi:10.4324/9780429346323., emissions38Toth-Szabo, Z. & Várhelyi, A. Indicator Framework for Measuring Sustainability of Transport in the City. Procedia – Social and Behavioral Sciences 48, 2035–2047 (2012)., noise3Rodrigue, J.-P. The Geography of Transport Systems. (Routledge, 2020). doi:10.4324/9780429346323., congestion37Joumard, R. & Gudmundsson, H. Indicators of environmental sustainability in transport: an interdisciplinary approch to methods. (INRETS COST, 2010)., safety38Toth-Szabo, Z. & Várhelyi, A. Indicator Framework for Measuring Sustainability of Transport in the City. Procedia – Social and Behavioral Sciences 48, 2035–2047 (2012)., infrastructure2European Commission. Joint Research Centre. The future of road transport : implications of automated, connected, low-carbon and shared mobility. (Publications Office, 2019)., cost efficiency38Toth-Szabo, Z. & Várhelyi, A. Indicator Framework for Measuring Sustainability of Transport in the City. Procedia – Social and Behavioral Sciences 48, 2035–2047 (2012)., and many more. All these indicators might be calculated and defined differently based on their purpose. To measure air quality an air quality index is used of which the calculation is based on the pollutants nitrogen dioxide, particulate matter, and ozone.39Umweltbundesamt. Air quality index. Umweltbundesamthttps://www.umweltbundesamt.de/en/data/air/air-data/air-quality/eJzrWJSSuMrIwMhY18BC18hiUUnmIkOLRXmpCxYVlyxYnOJWhJA0XJwSko-sNreKbVFuctPinMSS0w6eq-a9apQ7vjgnL_20g8o5F4dPFrMBTwEkjg== (2023). For transport infrastructure qualitative data is collected which might include looking at the frequency and duration of congestion. Another qualitative example is the number of deaths caused by road transport to indicate the level of safety.35World Health Organization. The top 10 causes of death. World Health Organizationhttps://www.who.int/news-room/fact-sheets/detail/the-top-10-causes-of-death (2020).
To assess the effectiveness of sustainability measurement methods it is important to look at factors like indicator validity and definition, measurement frequency, measurability, comparability, data quality and reliability as well as uncertainty and interpretability.37Joumard, R. & Gudmundsson, H. Indicators of environmental sustainability in transport: an interdisciplinary approch to methods. (INRETS COST, 2010). The data used needs to be comparable, understandable, and accessible to form an effective indicator.37Joumard, R. & Gudmundsson, H. Indicators of environmental sustainability in transport: an interdisciplinary approch to methods. (INRETS COST, 2010). The question of whether indicators as a measurement method are appropriate and effective or not lies in the process of choosing the indicators. If chosen based on sophisticated assessment and taking into account the aforementioned criteria sustainability measurement based on indicators is valid.37Joumard, R. & Gudmundsson, H. Indicators of environmental sustainability in transport: an interdisciplinary approch to methods. (INRETS COST, 2010).
3 Sustainability strategies and measures
Strategies and measures are needed to explain sector-specific technologies and related processes for sustainable road transport. To introduce these, a brief definition and categorization of sustainable road transport is given. Afterwards the strategies are explained for the passenger and freight transport of road mobility.
3.1 Sustainable road transport: Concepts and principles
To introduce strategies for sustainable road transport, it is first necessary to define sustainable road transport. Therefore, sustainable mobility aims to provide accessible, safe, and efficient transport options for all, while minimizing negative impacts on the environment and society. Current sustainable transport planning aims to enable commuting for daily activities and energy-efficient freight transport, whilst seeking to relieve negative impacts on the environment and human health.40Shah, K. J. et al. Green transportation for sustainability: Review of current barriers, strategies, and innovative technologies. Journal of Cleaner Production 326, 129392 (2021). This definition is based on the Brundtland definition of sustainability. As such, sustainable road transportation has to prioritize meeting the mobility needs of today’s society in a way that has the least environmental impact and does not compromise the mobility needs of the next generation.40Shah, K. J. et al. Green transportation for sustainability: Review of current barriers, strategies, and innovative technologies. Journal of Cleaner Production 326, 129392 (2021). Additionally, it is crucial to consider the social implications, including ensuring affordable and accessible transportation for disadvantaged communities, rural areas, and individuals with limited mobility.41European Commission. Sustainable and smart mobility strategy – putting european transport on track for the future. (2020).
In general, the actors responsible for implementation of sustainable strategies (governments, practitioners, researchers) are of the opinion that combined strategies for short and long-term integration have to be adopted.42Othman, B., De Nunzio, G., Di Domenico, D. & Canudas-de-Wit, C. Ecological traffic management: A review of the modeling and control strategies for improving environmental sustainability of road transportation. Annual Reviews in Control 48, 292–311 (2019). For short-term strategies, the outcome focuses on behavioral change and travel habits, whereas long-term strategies concentrate on the widespread adoption of technological solutions.42Othman, B., De Nunzio, G., Di Domenico, D. & Canudas-de-Wit, C. Ecological traffic management: A review of the modeling and control strategies for improving environmental sustainability of road transportation. Annual Reviews in Control 48, 292–311 (2019). The extent of these will be further discussed in the following sections.
Sustainable Mobility calls for the need of integrated policies, which generally include the integration of strategies across different modes of transport and objectives such as economy, health and environment while also considering the different needs of social groups.17Santos, G., Behrendt, H. & Teytelboym, A. Part II: Policy instruments for sustainable road transport. Research in Transportation Economics 28, 46–91 (2010). This translates to the need of widespread implementation of sustainable transport policies to reduce and eliminate CO2 emissions in the road transport sector using economic instruments, land use measures and technological innovations.17Santos, G., Behrendt, H. & Teytelboym, A. Part II: Policy instruments for sustainable road transport. Research in Transportation Economics 28, 46–91 (2010). The use of a variety of policies is necessary to integrate sustainable strategies, and it is therefore advised that a mix of physical policies related to technologies and traffic infrastructure, such as public transport and land use, as well as soft policies related to behavior, such as transport choices, and information and research policies are beneficial in aiming to change consumer and business behavior using different methods.17Santos, G., Behrendt, H. & Teytelboym, A. Part II: Policy instruments for sustainable road transport. Research in Transportation Economics 28, 46–91 (2010).
As established, the effective implementation of sustainable road transport results in decreased traffic congestion, energy and resource savings, reduced pollution and accident prevention, increased safety and security, and optimized travelling speed and traffic flow on the roads.40Shah, K. J. et al. Green transportation for sustainability: Review of current barriers, strategies, and innovative technologies. Journal of Cleaner Production 326, 129392 (2021). Consequently, sustainable mobility should be built on interconnected multimodal transport systems for both freight and passengers.41European Commission. Sustainable and smart mobility strategy – putting european transport on track for the future. (2020).,43Velazquez, L. et al. Sustainable transportation strategies for decoupling road vehicle transport and carbon dioxide emissions. Management of Environmental Quality: An International Journal 26, 373–388 (2015). In general, more sustainable transport strategies relate to measures that help avoiding the need to travel, promotion of a shift to more sustainable transport modes, improving fuel efficiency and the financing of sustainable urban development.44Wang, Y. & Boggio-Marzet, A. Evaluation of Eco-Driving Training for Fuel Efficiency and Emissions Reduction According to Road Type. Sustainability 10, 3891 (2018). However, successful solutions for tackling climate change require differentiated strategies for passenger and freight transport.43Velazquez, L. et al. Sustainable transportation strategies for decoupling road vehicle transport and carbon dioxide emissions. Management of Environmental Quality: An International Journal 26, 373–388 (2015). As seen in the following overview, passenger transport can be categorized into non-motorized and motorized mobility, with walking, cycling or public transport generally having lower emissions, resource consumption, greater variety and accessibility.43Velazquez, L. et al. Sustainable transportation strategies for decoupling road vehicle transport and carbon dioxide emissions. Management of Environmental Quality: An International Journal 26, 373–388 (2015). Private transport and freight transport are the other aspects to be considered in sustainability strategies. Freight transport, on the other hand, is mainly motorized. Derived from this classification, three main categories for sustainable road transport strategies can be described: Sustainable Technologies, Sustainable Infrastructure, and Sustainable Policies.
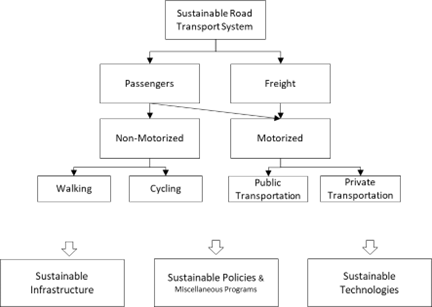
Figure 1: Sustainable Road Transport System (Own Illustration based on Velazquez, L. et al. )
3.2 Passenger transport
3.2.1 Sustainable technologies
Road transport is expected to move towards large-scale automated mobility concepts.41European Commission. Sustainable and smart mobility strategy – putting european transport on track for the future. (2020). The usage of private vehicles is considered as a cost-effective measure for improving fuel consumption and reducing CO2 emissions44Wang, Y. & Boggio-Marzet, A. Evaluation of Eco-Driving Training for Fuel Efficiency and Emissions Reduction According to Road Type. Sustainability 10, 3891 (2018)., whereas fuel consumption remains a main issue in the debate on energy efficient motor vehicles.46Monzon, A. & Wang, Y. Toward Sustainable and Low Carbon Road Transportation: Policies, Tools, and Planning Methods. Sustainability 11, 1709 (2019). As a precondition for achieving sustainability, it is necessary that the right vehicles and fuels are supplied by the industry. For this purpose, the development of new and innovative technologies is reliant on suitable research.41European Commission. Sustainable and smart mobility strategy – putting european transport on track for the future. (2020). The use of sustainable mobility offers many possibilities for reducing pollution and emissions. According to literature, the increased use of electric options facilitates the decarbonizing of both vehicles and synthetic fuel production.47Helgeson, B. & Peter, J. The role of electricity in decarbonizing European road transport – Development and assessment of an integrated multi-sectoral model. Applied Energy 262, 114365 (2020). Next to this, the connectivity and as well automation are expected to allow for a shift in mobility.42Othman, B., De Nunzio, G., Di Domenico, D. & Canudas-de-Wit, C. Ecological traffic management: A review of the modeling and control strategies for improving environmental sustainability of road transportation. Annual Reviews in Control 48, 292–311 (2019).
As mentioned above, in the realm of sustainable technologies, two primary areas are identifiable – sustainable vehicles and alternative fuels.48Axsen, J., Plötz, P. & Wolinetz, M. Crafting strong, integrated policy mixes for deep CO2 mitigation in road transport. Nat. Clim. Chang. 10, 809–818 (2020).
The first area aims towards improving the energy efficiency of motor vehicles and thereby reducing fuel consumption and vehicle emissions. This involves integrating the use of more sustainable mobility such as electric or hybrid vehicles.43Velazquez, L. et al. Sustainable transportation strategies for decoupling road vehicle transport and carbon dioxide emissions. Management of Environmental Quality: An International Journal 26, 373–388 (2015). Especially the manufacturing of battery-EVs used as cars, vans, and buses is already established, while hydrogen fuel-cell vehicles for use in buses, commercial fleets, and heavy goods transport are growing.41European Commission. Sustainable and smart mobility strategy – putting european transport on track for the future. (2020).,48Axsen, J., Plötz, P. & Wolinetz, M. Crafting strong, integrated policy mixes for deep CO2 mitigation in road transport. Nat. Clim. Chang. 10, 809–818 (2020).Technological innovation, environmental education of end consumers, and political and economic incentives are reasons for this trend.49Bureika, G., Matijošius, J. & Rimkus, A. Alternative Carbonless Fuels for Internal Combustion Engines of Vehicles. in Ecology in Transport: Problems and Solutions (ed. Sładkowski, A.) vol. 124 1–49 (Springer International Publishing, 2020). Existing cars are already less polluting than comparable models in 2015.41European Commission. Sustainable and smart mobility strategy – putting european transport on track for the future. (2020). However, battery electric vehicles (BEVs) emit lower greenhouse gas emissions than conventional cars, as well as most biofuels.50Panchuk, M., Kryshtopa, S., Sładkowski, A. & Panchuk, A. Environmental Aspects of the Production and Use of Biofuels in Transport. in Ecology in Transport: Problems and Solutions (ed. Sładkowski, A.) vol. 124 115–168 (Springer International Publishing, 2020). Nonetheless, it is important to consider the electricity generation conditions during production and use-phase of EVs with respect to CO2 emissions.50Panchuk, M., Kryshtopa, S., Sładkowski, A. & Panchuk, A. Environmental Aspects of the Production and Use of Biofuels in Transport. in Ecology in Transport: Problems and Solutions (ed. Sładkowski, A.) vol. 124 115–168 (Springer International Publishing, 2020).
In future, the increased availability of zero-emission vehicles is considered to make sustainable mobility more affordable41European Commission. Sustainable and smart mobility strategy – putting european transport on track for the future. (2020)., and the promotion of innovative technologies through the establishment of partnerships within the industry will be an important measure for securing these ambitions.41European Commission. Sustainable and smart mobility strategy – putting european transport on track for the future. (2020).
The second area aims to introduce renewable and low-carbon fuels on a large-scale.41European Commission. Sustainable and smart mobility strategy – putting european transport on track for the future. (2020). Vehicle fuel-switching involves transitioning from fossil fuels to alternative sources, predominately hydrogen and biofuels from low-carbon sources48Axsen, J., Plötz, P. & Wolinetz, M. Crafting strong, integrated policy mixes for deep CO2 mitigation in road transport. Nat. Clim. Chang. 10, 809–818 (2020)., to support decarbonization.43Velazquez, L. et al. Sustainable transportation strategies for decoupling road vehicle transport and carbon dioxide emissions. Management of Environmental Quality: An International Journal 26, 373–388 (2015).,50Panchuk, M., Kryshtopa, S., Sładkowski, A. & Panchuk, A. Environmental Aspects of the Production and Use of Biofuels in Transport. in Ecology in Transport: Problems and Solutions (ed. Sładkowski, A.) vol. 124 115–168 (Springer International Publishing, 2020). Greenhouse gas emissions from biofuels, for instance, depend heavily on their value chain and especially the raw material procurement and conversion technologies used.50Panchuk, M., Kryshtopa, S., Sładkowski, A. & Panchuk, A. Environmental Aspects of the Production and Use of Biofuels in Transport. in Ecology in Transport: Problems and Solutions (ed. Sładkowski, A.) vol. 124 115–168 (Springer International Publishing, 2020). In contrast, hydrogen is a carbon-free fuel that emits no direct CO2 or particulate matter emissions during use, although it is not yet considered as a safe fuel source.49Bureika, G., Matijošius, J. & Rimkus, A. Alternative Carbonless Fuels for Internal Combustion Engines of Vehicles. in Ecology in Transport: Problems and Solutions (ed. Sładkowski, A.) vol. 124 1–49 (Springer International Publishing, 2020).
Additional strategies may include substituting other polluting car components. For example, vehicle tires are significant contributor to noise pollution and microplastics from road transport. High-performance tires that require less energy could replace them.41European Commission. Sustainable and smart mobility strategy – putting european transport on track for the future. (2020).
Lastly, it is important to note that reduction CO2 emissions from road vehicles does not necessarily guarantee an overall decrease in emissions as vehicle use continues to grow and the possibility of rebound effects may lead to increased emissions and greater traffic congestion as a consequence of access to mobility overall.42Othman, B., De Nunzio, G., Di Domenico, D. & Canudas-de-Wit, C. Ecological traffic management: A review of the modeling and control strategies for improving environmental sustainability of road transportation. Annual Reviews in Control 48, 292–311 (2019).,49Bureika, G., Matijošius, J. & Rimkus, A. Alternative Carbonless Fuels for Internal Combustion Engines of Vehicles. in Ecology in Transport: Problems and Solutions (ed. Sładkowski, A.) vol. 124 1–49 (Springer International Publishing, 2020). In general, it is essential to establish the required charging infrastructure to enable the adoption of sustainable mobility alternatives.
3.2.2 Sustainable infrastructure
Sustainable Infrastructure includes the areas of urban planning and integrated land use, as well as traffic management. Taking a comprehensive viewpoint, to understand the environmental impact of road transport it is important to consider the required infrastructure and social aspects associated with vehicles. Resulting from this, the approach towards sustainable technology must go beyond mere technological advancements and focus on reducing infrastructure needs, optimizing travel routes and distances.43Velazquez, L. et al. Sustainable transportation strategies for decoupling road vehicle transport and carbon dioxide emissions. Management of Environmental Quality: An International Journal 26, 373–388 (2015). In general, sustainable road transport should be designed to discourage the use of private vehicles, thereby affecting the planning and management of infrastructure.43Velazquez, L. et al. Sustainable transportation strategies for decoupling road vehicle transport and carbon dioxide emissions. Management of Environmental Quality: An International Journal 26, 373–388 (2015).
When considering land use and urban planning, the main strategies that exist refer to urban planning and short-distance travel. Four categories of travel reduction strategies may be applied to foster sustainable road transport. Support for active travel (walking and cycling) should be provided, public transport should be enhanced, and the requirement for travel should be decreased.48Axsen, J., Plötz, P. & Wolinetz, M. Crafting strong, integrated policy mixes for deep CO2 mitigation in road transport. Nat. Clim. Chang. 10, 809–818 (2020). Therefore, the emphasis of land use policies should be on reducing travel, for example by decreasing the separation of facilities and destinations. Furthermore, the core of urban mobility should focus on walking, cycling, and public transport (buses).17Santos, G., Behrendt, H. & Teytelboym, A. Part II: Policy instruments for sustainable road transport. Research in Transportation Economics 28, 46–91 (2010). For walking and cycling to be established and gain acceptance, it is essential to promote them as safe and accessible short-distance solutions for transportation.43Velazquez, L. et al. Sustainable transportation strategies for decoupling road vehicle transport and carbon dioxide emissions. Management of Environmental Quality: An International Journal 26, 373–388 (2015). For this, the maintenance of pavements, building of safe crossings and cycle paths, alongside the implementation of lower speed limits and crime prevention measures, are necessary actions.17Santos, G., Behrendt, H. & Teytelboym, A. Part II: Policy instruments for sustainable road transport. Research in Transportation Economics 28, 46–91 (2010). Additionally, it’s crucial to acknowledge and integrate road safety into urban sustainability in this particular context.51McLeod, S. & Curtis, C. Integrating urban road safety and sustainable transportation policy through the hierarchy of hazard controls. International Journal of Sustainable Transportation 16, 166–180 (2022). In order to establish sustainability beyond urban planning, it is necessary to integrate different modes of transport, for example park and ride facilities that combine private and public transportation.17Santos, G., Behrendt, H. & Teytelboym, A. Part II: Policy instruments for sustainable road transport. Research in Transportation Economics 28, 46–91 (2010). Supporting this, many cities have implemented parking restrictions to lessen the dependence on private cars43Velazquez, L. et al. Sustainable transportation strategies for decoupling road vehicle transport and carbon dioxide emissions. Management of Environmental Quality: An International Journal 26, 373–388 (2015). and alleviate traffic and parking congestions.48Axsen, J., Plötz, P. & Wolinetz, M. Crafting strong, integrated policy mixes for deep CO2 mitigation in road transport. Nat. Clim. Chang. 10, 809–818 (2020). The shift towards public transport results in reduced CO2 emissions.17Santos, G., Behrendt, H. & Teytelboym, A. Part II: Policy instruments for sustainable road transport. Research in Transportation Economics 28, 46–91 (2010). To facilitate this shift, it is necessary to concentrate on setting routes, increasing frequencies and monitoring the service quality to assure an efficient and convenient mobility alternative to private vehicles.43Velazquez, L. et al. Sustainable transportation strategies for decoupling road vehicle transport and carbon dioxide emissions. Management of Environmental Quality: An International Journal 26, 373–388 (2015).
Traffic management measures involve controlling traffic flow to reduce emissions and energy consumption.42Othman, B., De Nunzio, G., Di Domenico, D. & Canudas-de-Wit, C. Ecological traffic management: A review of the modeling and control strategies for improving environmental sustainability of road transportation. Annual Reviews in Control 48, 292–311 (2019). To model traffic flow, measurements of traffic density and trends are considered for both passenger and freight transport.52Merkisz-Guranowska, A., Merkisz, J., Kozak, M. & Jacyna, M. Development of a sustainable road transport system. in 507–517 (2013). doi:10.2495/UT130411. Thus, new opportunities should be utilized to enhance transport planning methods and efficiency of road operations. For example, digitalization or automation can be employed towards sustainable transport planning. To accomplish this goal, traffic flow can be optimized through the implementation of intelligent traffic lights and dynamic traffic management systems to decrease congestion and reveal areas of ineffective traffic.46Monzon, A. & Wang, Y. Toward Sustainable and Low Carbon Road Transportation: Policies, Tools, and Planning Methods. Sustainability 11, 1709 (2019). A well-established example of coordinated traffic management is the inclusion of “green waves” to reduce the number of cars that have to stop at red lights.44Wang, Y. & Boggio-Marzet, A. Evaluation of Eco-Driving Training for Fuel Efficiency and Emissions Reduction According to Road Type. Sustainability 10, 3891 (2018). However, measures that are taken based on traffic management systems require careful consideration. Increasing road capacity may result in induced traffic due to reduced congestion for vehicles.17Santos, G., Behrendt, H. & Teytelboym, A. Part II: Policy instruments for sustainable road transport. Research in Transportation Economics 28, 46–91 (2010).
In conclusion, these strategies contribute to GHG mitigation and reducing vehicle ownership and usage.48Axsen, J., Plötz, P. & Wolinetz, M. Crafting strong, integrated policy mixes for deep CO2 mitigation in road transport. Nat. Clim. Chang. 10, 809–818 (2020). However, the redevelopment of already existing cities is challenging17Santos, G., Behrendt, H. & Teytelboym, A. Part II: Policy instruments for sustainable road transport. Research in Transportation Economics 28, 46–91 (2010). and furthermore the individual preferences for the available transport modes vary depending on various factors such as modal and demographic characteristics.43Velazquez, L. et al. Sustainable transportation strategies for decoupling road vehicle transport and carbon dioxide emissions. Management of Environmental Quality: An International Journal 26, 373–388 (2015).
Zurich, Switzerland is an exemplary city for sustainable infrastructure. The city has implemented sustainable mobility within urban planning and designed a public transport system which permits effortless commuting. This includes elements such as an easily accessible public transport system, including trains, trams, and buses, with reduced fares to encourage frequent use. In addition, the city has created extra road space for pedestrians and cyclists, imposed high tolls to discourage car use in densely populated areas, and installed inductive loop sensors to monitor car movements and manage traffic flow. As a result, Zurich’s sustainable transport system has proved effective, with car ownership falling by 17% between 2000 and 2017, while the population grew by around 15%.53Menendez, M. & Ambühl, L. Implementing Design and Operational Measures for Sustainable Mobility: Lessons from Zurich. Sustainability 14, 625 (2022).
3.2.3 Sustainable policies
Sustainable policies and miscellaneous programs refer to the information and education programs concerning sustainable road transport. These policies and programs serve as tools and instruments to implement new standards that can potentially affect behavioral change. They are typically necessary actions that may not be sufficient measures in themselves17Santos, G., Behrendt, H. & Teytelboym, A. Part II: Policy instruments for sustainable road transport. Research in Transportation Economics 28, 46–91 (2010). they complement strong policy mixes for sustainable road transport.48Axsen, J., Plötz, P. & Wolinetz, M. Crafting strong, integrated policy mixes for deep CO2 mitigation in road transport. Nat. Clim. Chang. 10, 809–818 (2020). Research and development are important factors for much-needed and continuous innovation within sustainability and zero-carbon transport. Thus, the provision of incentives by policymakers and governments is vital for the large-scale development and implementation of other strategies. Within the same category, using promotional and information campaigns to communicate the economic and environmental consequences of individual actions is one way of facilitating sustainable behavior and investments.17Santos, G., Behrendt, H. & Teytelboym, A. Part II: Policy instruments for sustainable road transport. Research in Transportation Economics 28, 46–91 (2010).
Therefore, traditional economic policies may be employed alongside other measures to achieve sustainability in road transport. Pricing is a viable mechanism in this concept and is recognized as particularly effective and efficient in terms of climate policies. Various forms of pricing mechanisms exist, some of which target specific technologies such as subsidies for EVs or low-carbon fuels. Others include the “polluter pays” or “user pays” principles, such as higher prices during peak times of road use or for the use of specific roads.41European Commission. Sustainable and smart mobility strategy – putting european transport on track for the future. (2020).,48Axsen, J., Plötz, P. & Wolinetz, M. Crafting strong, integrated policy mixes for deep CO2 mitigation in road transport. Nat. Clim. Chang. 10, 809–818 (2020). A combination of pricing, subsidies, and regulations are deemed most effective, all these concepts lead to increased demand for more sustainable modes of transport.
Another policy involves implementing and enhancing vehicle emission standards.48Axsen, J., Plötz, P. & Wolinetz, M. Crafting strong, integrated policy mixes for deep CO2 mitigation in road transport. Nat. Clim. Chang. 10, 809–818 (2020). These standards for CO2 and air pollutant emissions aim to ensure vehicle compliance throughout their lifetimes41European Commission. Sustainable and smart mobility strategy – putting european transport on track for the future. (2020)., as well as offer incentives, such as discounted rates or exemptions, for vehicles that meet these stringent emission standards.
In addition, digital solutions are causing changes to mobility patterns and consumer behavior. This is particularly evident in the shift towards working from home, which has been further reinforced by the COVID-19 pandemic. The main requirements and limitations for changing daily commuting and mobility patterns are being described by cost, availability, and speed regarding the use of public transportation, as previously discussed in the earlier section. The incentivizing of these factors by policymakers will lead to mixed policy implementation and therefore result in higher acceptability.43Velazquez, L. et al. Sustainable transportation strategies for decoupling road vehicle transport and carbon dioxide emissions. Management of Environmental Quality: An International Journal 26, 373–388 (2015). The promotion of EV-sharing and ride pooling in cities is incentivized by policymakers to increase accessibility and strengthen political support and acceptance.46Monzon, A. & Wang, Y. Toward Sustainable and Low Carbon Road Transportation: Policies, Tools, and Planning Methods. Sustainability 11, 1709 (2019).
Lastly, the need for public awareness about the role of the driver should be raised. Eco-driving could be implemented as a more widespread strategy, which should be included within driving lessons, or via instant feedback provided by the car equipment measuring fuel consumption.44Wang, Y. & Boggio-Marzet, A. Evaluation of Eco-Driving Training for Fuel Efficiency and Emissions Reduction According to Road Type. Sustainability 10, 3891 (2018). Eco-driving campaigns are targeted to inform and educate drivers17Santos, G., Behrendt, H. & Teytelboym, A. Part II: Policy instruments for sustainable road transport. Research in Transportation Economics 28, 46–91 (2010). and modify driving behaviors to enhance fuel efficiency, reduce road accidents and lower noise levels.44Wang, Y. & Boggio-Marzet, A. Evaluation of Eco-Driving Training for Fuel Efficiency and Emissions Reduction According to Road Type. Sustainability 10, 3891 (2018).
3.3 Freight transport
This chapter aims to establish the similarities and differences between sustainable road passenger transport and freight transport. Notably, sustainable road passenger transport strategies mainly target end users, whereas freight transport primarily focuses on companies and logistics. Freight transport, driven by economic factors and cost, distinguishes itself from road passenger transport.54Kadłubek, M. Relevance of modern technologies for sustainability-focused road freight transport service management in a competitive market. Procedia Computer Science 207, 2013–2022 (2022). Starting with technology, similar to the aforementioned points, freight transport follows the strategy of replacing existing fleets with low- and zero-emission vehicles while enhancing the use of renewable and low-carbon fuels. The implementation of these technologies varies widely by usage, with heavy-duty battery EVs being most commonly implemented for short-distances such as regional delivery and delivery trucks, while hydrogen fuel cell vehicles are used for long-distances.48Axsen, J., Plötz, P. & Wolinetz, M. Crafting strong, integrated policy mixes for deep CO2 mitigation in road transport. Nat. Clim. Chang. 10, 809–818 (2020). Switching to different modes of transportation and using road transport solely as a last-mile solution is a crucial factors in establishing sustainable mix-policies for freight transport.17Santos, G., Behrendt, H. & Teytelboym, A. Part II: Policy instruments for sustainable road transport. Research in Transportation Economics 28, 46–91 (2010). Many of the policy mix principles identified for passenger transport apply similarly to road freight. Especially carbon or road pricing could efficiently incentivize a range of freight mitigation actions, provided that the price level is sufficient.48Axsen, J., Plötz, P. & Wolinetz, M. Crafting strong, integrated policy mixes for deep CO2 mitigation in road transport. Nat. Clim. Chang. 10, 809–818 (2020). Implementation of these strategies could facilitate efficient green freight corridors that deploy zero-emission technologies across the entire delivery chain.40Shah, K. J. et al. Green transportation for sustainability: Review of current barriers, strategies, and innovative technologies. Journal of Cleaner Production 326, 129392 (2021). Overall, the road freight transport sector exhibits potential for improvement in terms of sustainability.
4 Drivers and barriers
In this chapter, the drivers and barriers of sustainable road transport and motor vehicles, which encompasses EVs, traffic regulations, policies, and infrastructure will be listed and elaborated on. This includes political and economic drivers about government incentives, regulations and policies, and EV procurement costs. Furthermore, there are several technological drivers such as charging infrastructure and the battery of EVs. Subsequently, social, and environmental drivers will be discussed. The same structure is followed for the barriers.
4.1 Drivers
4.1.1 Policy and economic drivers
The economic drivers for sustainable transport include government regulations, policies, and incentives.As an example, fiscal incentives such as vehicle purchase, and registration tax rebates as well as purchase subsidies have been implemented to make it more appealing for price conscious car buyers to switch to EVs and narrow the price gap.55IEA. Global EV Outlook 2021. IEA https://www.iea.org/reports/global-ev-outlook-2021 (2021).
An important policy striving towards sustainability and combating climate change is the European Green Deal. This deal promises to transform the EU into a modern, resource-efficient, and competitive economy, ensuring zero net emissions by 2050, economic growth decoupled from resource use. The European Commission has adopted a set of proposals to reduce net GHG emissions by at least 55% by 2030, compared to 1990 levels.56European Commission. A European Green Deal. https://commission.europa.eu/strategy-and-policy/priorities-2019-2024/european-green-deal_en (2021).
As for government incentives, in the UK the rapid charging fund57Department for transport. Rapid charging fund. GOV.UK https://www.gov.uk/guidance/rapid-charging-fund (2021). will help motorway operators and major road service area operators to prepare the network for 100% zero emission vehicles.57Department for transport. Rapid charging fund. GOV.UK https://www.gov.uk/guidance/rapid-charging-fund (2021). In 2020, the department for transport in the UK published the Prime Minister’s ten-point plan for a green industrial revolution. The plan includes the objective to end the sale of new petrol and diesel cars and vans by 2030. All new vehicles will be required to have 100% zero emissions from 2035.57Department for transport. Rapid charging fund. GOV.UK https://www.gov.uk/guidance/rapid-charging-fund (2021). Furthermore, in May 2020, the Department for Transport published a government proposal for the rapid charging point network in England. The proposal outlines several targets. By 2023, there should be a minimum of 6 high-powered, open-access charge points at motorway service areas in England.57Department for transport. Rapid charging fund. GOV.UK https://www.gov.uk/guidance/rapid-charging-fund (2021). In November 2020, it was announced that support for EV infrastructure would be increased to £1.3 billion over the next 3 years. This includes an increase in the rapid charging fund to £950 million, alongside increases in the existing grant schemes for workplaces, homes, and on-street charging facilities. Additionally, there will be a new fund of £90 million for larger-scale local charging projects. The National Infrastructure Strategy also clarified that the government expects the private sector to provide charge points where they are commercially viable, and that government intervention will only occur when there is a clear market failure.57Department for transport. Rapid charging fund. GOV.UK https://www.gov.uk/guidance/rapid-charging-fund (2021).
In 2009, the E-Mobility Development plan was established to promote research and development on e-mobility and EVs with batteries. Several ministries have allocated funding of 500 million euros in total distributed to 15 different projects.58Dr. Gerd Leutner & Dr. Antje Becker-Boley. Electric vehicle regulation and law in Germany | CMS Expert Guides. https://cms.law/en/int/expert-guides/cms-expert-guide-to-electric-vehicles/germany (2018). Furthermore, there are several regulations regarding EVs which can differ by country and region. The Regulation (EU) 2019/631 sets a standard for CO2 emissions and incentivizes the uptake of zero- and low-emission vehicles.59European Commission. CO₂ emission performance standards for cars and vans. https://climate.ec.europa.eu/eu-action/transport/road-transport-reducing-co2-emissions-vehicles/co2-emission-performance-standards-cars-and-vans_en (2023). It sets EU fleet-wide CO2 emission targets applying from 2020, 2025, and 2030 and includes a mechanism to incentivize the uptake of zero- and low-emission vehicles.59European Commission. CO₂ emission performance standards for cars and vans. https://climate.ec.europa.eu/eu-action/transport/road-transport-reducing-co2-emissions-vehicles/co2-emission-performance-standards-cars-and-vans_en (2023).
In 2020, the European Commission has released a document with the title “Sustainable and Smart Mobility Strategy – putting European transport on track for the future”. In this document, the EU Commission’s vision has been written down including some targets for the following years. By 2030, they envision that at least 30 million zero-emission vehicles will be in operation on European roads, 100 European cities will be climate neutral, high-speed rail traffic will double, scheduled collective travel of under 500 km should be carbon neutral within the EU, automated mobility will be deployed at large scale, and zero-emission vessels will become ready for market.41European Commission. Sustainable and smart mobility strategy – putting european transport on track for the future. (2020). To achieve a more sustainable road transportation system the increased deployment and use of renewable and low-carbon fuels must go hand-in-hand with the creation of a comprehensive network of recharging and refueling infrastructure to fully enable the widespread uptake of low- and zero-emission vehicles in all transport modes. “Recharge and refuel” is a European flagship under the Recovery and Resilience Facility41European Commission. Sustainable and smart mobility strategy – putting european transport on track for the future. (2020).: by 2025, the aim is to build half of the 1,000 hydrogen stations and one million out of 3 million public recharging points needed by 2030.59European Commission. CO₂ emission performance standards for cars and vans. https://climate.ec.europa.eu/eu-action/transport/road-transport-reducing-co2-emissions-vehicles/co2-emission-performance-standards-cars-and-vans_en (2023).
In Germany, the E-Mobility Act which was published in 2015 gives owners of EVs more freedom in choosing their parking spots and benefit from reduced parking rates.58Dr. Gerd Leutner & Dr. Antje Becker-Boley. Electric vehicle regulation and law in Germany | CMS Expert Guides. https://cms.law/en/int/expert-guides/cms-expert-guide-to-electric-vehicles/germany (2018). These regulations also introduce new traffic signs and number plates with an “E” following the number to indicate that the vehicle is electric, which gives its owners privileges and exempts them from certain traffic restrictions.58Dr. Gerd Leutner & Dr. Antje Becker-Boley. Electric vehicle regulation and law in Germany | CMS Expert Guides. https://cms.law/en/int/expert-guides/cms-expert-guide-to-electric-vehicles/germany (2018). In some cities in Germany, the “E” on the number plate gives the owner the privilege of free parking and can allow the drivers to drive on the bus lane as well. In Stuttgart for example, there has been a special parking permit for EVs already since 2012. Owners of EVs are allowed to park in metered parking spaces without charge, but as of 2017 they must apply for the new license plate to park without a fee.58Dr. Gerd Leutner & Dr. Antje Becker-Boley. Electric vehicle regulation and law in Germany | CMS Expert Guides. https://cms.law/en/int/expert-guides/cms-expert-guide-to-electric-vehicles/germany (2018).
Another driver towards sustainability in road transport is the lowering of speed limits in Europe. The European Transport Safety Council has welcomed new recommendations made by the European Commission to local, regional, and national authorities to reduce speeds on motorways and in urban areas. The aim is to reduce dependence on Russian oil, save lives and reduce pollution. As a result, numerous countries have taken action. In 2020, the Netherlands implemented a reduction of the speed limit on motorways to 100 km/h during the daytime to reduce pollutant emissions. A car driving at 120 km/h uses about 20% more fuel than at 100 km/h.60ETCS. ETSC statement on ‘EU Save Energy’ speed recommendations – ETSC. ETSC statement on ‘EU save energy’ speed recommendations https://etsc.eu/etsc-statement-on-eu-save-energy-speed-recommendations/ (2022). In addition to that, Brussels and Paris have reduced the urban speed limit to 30km/h. An analysis by the Brussels region showed toxic emissions, noise and crashes all declined since the lower limit was introduced, with journey times being largely unaffected. Research conducted in the UK has demonstrated that lower speeds lead to decreased CO2 emissions and fuel consumption by 25% for typical cars due to the removal of additional acceleration required during stop/start driving.
Furthermore, the operating costs of electric vehicles (EVs) may act as an economic incentive for consumers to purchase them. A 2018 study by the University of Michigan’s Transportation Research Institute61McMahon, J. Electric Vehicles Cost Less Than Half As Much To Drive. Forbes. https://www.forbes.com/sites/jeffmcmahon/2018/01/14/electric-vehicles-cost-less-than-half-as-much-to-drive/#61e6ef7f3f97 (2018). found that the annual operating cost of an electric vehicle (EV) in the US was $485 which is more than half compared to the annual operating cost of $1,117 for a petrol-fueled vehicle. According to Lanz et al., the levelized cost of charging an EV in Germany was around 0.30-0.35€ kw/h in 2014.62Lanz, L., Noll, B., Schmidt, T. S. & Steffen, B. Comparing the levelized cost of electric vehicle charging options in Europe. Nat Commun 13, 5277 (2022). However, this number can differ across countries and users. The average public charging price in 2023 increased to around 0.55€ kw/h63Statista. Electricity prices for charging stations for electric cars in Germany in 2023, by provider. Statista https://www.statista.com/statistics/1167538/electricity-prices-charging-stations-electric-cars-by-provider-germany/ (2023).. Considering an average consumption of 25 kw/h for 100km and the average of around 13,000 annual kilometers travelled in Germany64Bäumer, M., Hautzinger, H., Kuhnimhof, T. & Pfeiffer, M. The German Vehicle Mileage Survey 2014: Striking the balance between methodological innovation and continuity. Transportation Research Procedia 32, 329–338 (2018)., this would make up around 1788€ per year only for charging. Compared to the fuel prices of an ICE with an average consumption of 7.7 liters per 100km65Statista. Durchschnittlicher Kraftstoffverbrauch der in Deutschland zugelassenen Pkw in den Jahren von 2011 bis 2021. Statistahttps://de.statista.com/statistik/daten/studie/484054/umfrage/durchschnittsverbrauch-pkw-in-privaten-haushalten-in-deutschland/#:~:text=Der%20durchschnittliche%20Kraftstoffverbrauch%20von%20Personenkraftwagen,Kraftstoff%20für%20die%20gleiche%20Strecke. (2022). and an average petrol price of 1.8566Statista. Durchschnittlicher Preis für Superbenzin in Deutschland in den Jahren 1972 bis 2023. Statista https://de.statista.com/statistik/daten/studie/776/umfrage/durchschnittspreis-fuer-superbenzin-seit-dem-jahr-1972/ (2023). with the same annual number of kilometers this would make 1850€. Hence, refueling an ICE is slightly more expensive than charging an EV.
4.1.2 Technological drivers
A significant technological driver concerns the charging infrastructure for EVs. Building more charging stations and making them more easily accessible for owners of EVs is of high importance, especially for long distance travel demand. In 2021, the ratio of electric vehicles to charging points was ten to one.55IEA. Global EV Outlook 2021. IEA https://www.iea.org/reports/global-ev-outlook-2021 (2021). In the USA, a policy that works towards the goal of building more charging infrastructure is President Biden’s Bipartisan Infrastructure Law which includes a funding of $7.5 billion to build out a nationwide network of 500,000 EV chargers.67US Department of Transportation. President Biden, U.S. Department of Transportation Releases Toolkit to Help Rural Communities Build Out Electric Vehicle Charging Infrastructure | US Department of Transportation. U.S. Department of Transportation https://www.transportation.gov/briefing-room/president-biden-us-department-transportation-releases-toolkit-help-rural-communities (2022). In Germany, the government has launched a 300 million euro subsidy program for EV charging stations, with the goal being the building of more charging infrastructure and reach 100,000 charging stations.58Dr. Gerd Leutner & Dr. Antje Becker-Boley. Electric vehicle regulation and law in Germany | CMS Expert Guides. https://cms.law/en/int/expert-guides/cms-expert-guide-to-electric-vehicles/germany (2018). In addition to building more charging infrastructure, Germany introduced the Immediate Action Plan Clean Air 2017-202068The Federal Government. What the government is doing for the climate. Website of the Federal Government | Bundesregierung https://www.bundesregierung.de/breg-en/issues/climate-action/government-climate-policy-1779414. which is based on a government fund of 1 billion euros and contains several incentive schemes. The proposal enables local authorities and public transport providers to secure financing of between 75-90% to cover additional investment costs incurred from the purchase of EVs. Commercial providers such as craftsmen, nursing services and car sharing operators can receive up to 60% refund of additional costs if their purchase is integrated in a local mobility concept. The purchase of buses for public transportation and other related services as well as maintenance activities are eligible for subsidies of up to 80% of the additional cost.58Dr. Gerd Leutner & Dr. Antje Becker-Boley. Electric vehicle regulation and law in Germany | CMS Expert Guides. https://cms.law/en/int/expert-guides/cms-expert-guide-to-electric-vehicles/germany (2018). In addition to that, the plan provides funding for research and development projects that exploit the potential of e-mobility and contribute to strengthening the competitive position of the German industrial sector.58Dr. Gerd Leutner & Dr. Antje Becker-Boley. Electric vehicle regulation and law in Germany | CMS Expert Guides. https://cms.law/en/int/expert-guides/cms-expert-guide-to-electric-vehicles/germany (2018).
For private citizens and entities, the Federal Government is cooperating with car manufacturers to offer an Environment Bonus. The program, which is state funded with 600 million pounds, offers individuals the opportunity to acquire a federal contribution of 4,000€ when purchasing or leasing a new EV. Alternatively, they can receive 3,000€ for plug-in hybrid vehicles, provided that the manufacturer offers a discount of the same amount. As of February 2018, 31,312 applications had been entered for EVs and 22,946 applications for hybrid cars. However, the impact of the program is controversial, with studies showing limited influence on consumers’ decisions to invest in EVs.58Dr. Gerd Leutner & Dr. Antje Becker-Boley. Electric vehicle regulation and law in Germany | CMS Expert Guides. https://cms.law/en/int/expert-guides/cms-expert-guide-to-electric-vehicles/germany (2018).
4.1.3 Social and environmental drivers
There are several social and environmental factors that drive individuals and companies towards sustainable transport. The key drivers for individuals to purchase EVs include environmental concern, high expected performance of EVs, and increased cost efficiency.69Zheng, S. et al. Identifying Intention-Based Factors Influencing Consumers’ Willingness to Pay for Electric Vehicles: A Sustainable Consumption Paradigm. Sustainability 14, 16831 (2022). Similarly, the Deloitte consumer study70Deloitte. 2023 Global Automotive Consumer Study | Deloitte US. Deloitte.https://www.deloitte.com/global/en/Industries/automotive/perspectives/global-automotive-consumer-study.html (2023). from 2020 found that people desired to positively impact the environment. As EVs are more environmentally friendly due to decreased air pollution individuals with increased environmental knowledge and concern show a higher willingness to purchase EVs.71Secinaro, S., Calandra, D., Lanzalonga, F. & Ferraris, A. Electric vehicles’ consumer behaviors: Mapping the field and providing a research agenda. Journal of Business Research 150, 399–416 (2022). Reduced air pollution and emissions also becomes a social driver due to the linked health benefits.72Guno, C. S., Collera, A. A. & Agaton, C. B. Barriers and Drivers of Transition to Sustainable Public Transport in the Philippines. WEVJ 12, 46 (2021). An additional potential driver is the possibility of improving the social status due to being an early adopter of the latest technology.70Deloitte. 2023 Global Automotive Consumer Study | Deloitte US. Deloitte.https://www.deloitte.com/global/en/Industries/automotive/perspectives/global-automotive-consumer-study.html (2023). EV owners in Singapore have different motivators, with the availability of charging stations (44%), brand reputation (41%), and environmental impact (41%) as their top reasons.73Kantar. Understanding Consumer Attitudes Towards Electric Vehicles. Kantarhttps://www.kantar.com/inspiration/research-services/understanding-consumer-attitudes-towards-electric-vehicles-pf (2023). It is most likely that the most sustainable forms of transport are walking and cycling as movement in general has scientifically proven health benefits and no GHGs are emitted.74Sustainable transport: planning for walking and cycling in urban environments. (CRC Press ; Woodhead Pub, 2003).
A good road transport infrastructure leads to more social drivers as it connects people to health care and allows individuals to pursue education, a job, as well as real-life social interactions.75Leila Mead. The Road to Sustainable Transport. International Institute for Sustainable Development https://www.iisd.org/articles/deep-dive/road-sustainable-transport (2021).
4.2 Barriers
4.2.1 Policy and economic barriers
One of the economic barriers concerns the limited availability of EVs. There has been a surge of people opting for a more sustainable mode of transport and people considering the purchase of an EV. While in 2011 only 60,000 plug-in electric vehicles (PEVs) were sold, this number increased to 1.2 million PEVs in 2017.76Pelegov, D. & Pontes, J. Main Drivers of Battery Industry Changes: Electric Vehicles—A Market Overview. Batteries 4, 65 (2018). By the end of 2023, a total sales volume of 14 million EVs is expected.77IEA. Electric car sales break new records with momentum expected to continue through 2023. IEA https://www.iea.org/reports/global-ev-outlook-2023/executive-summary (2023). Although the availability of EVs is on the rise the limited availability of these models still presents a challenge to the widespread adoption of EVs.
Furthermore, the cost of purchase of EVs pose an economic barrier to EV adoption since costs of EVs are on average higher than costs of ICEs.78Krishna, G. Understanding and identifying barriers to electric vehicle adoption through thematic analysis. Transportation Research Interdisciplinary Perspectives 10, 100364 (2021). According to Deloitte’s 2022 Global Automotive Consumer Study, 75% of potential EV buyers intend to spend less than $50,000. In an empirical study investigating key factors influencing consumers’ purchase intention towards EV in Bangkok, only around 33% of the respondents were willing to buy the cheapest EV which cost around $20,000 at that time. This finding suggests that even the most affordable EV option is perceived as expensive. According to most respondents, the cost-performance ratio of EVs is not justifiable.78Krishna, G. Understanding and identifying barriers to electric vehicle adoption through thematic analysis. Transportation Research Interdisciplinary Perspectives 10, 100364 (2021).
Car sharing companies face several challenges regarding the profitability of providing EVs. Approximately 10% of the car sharing fleets in Germany are EVs. The issue lies in the high procurement costs and reduced occupancy rates branch association Bundesverband CarSharing faces because of long charging cycles.58Dr. Gerd Leutner & Dr. Antje Becker-Boley. Electric vehicle regulation and law in Germany | CMS Expert Guides. https://cms.law/en/int/expert-guides/cms-expert-guide-to-electric-vehicles/germany (2018).
4.2.2 Technological barriers
Problems with the charging of EVs include long charging times, the inaccessibility of chargers and the cost of chargers. Chargers vary depending on the vehicle and fall into two categories: Alternative Current (AC), which is generally slower and used in EV owners’ homes whereas Direct Current (DC) charging is a rapid charging technology mostly found in public spaces and has the ability to fully charge a car within one hour.75Leila Mead. The Road to Sustainable Transport. International Institute for Sustainable Development https://www.iisd.org/articles/deep-dive/road-sustainable-transport (2021). Furthermore, a significant barrier to EV adoptions is the cost of batteries. Lithium-ion batteries of the Nissan LEAF initially constituted a third of the vehicles total cost. However, it is expected that this cost will be gradually reduced. At the end of 2013, battery pack expenses decreased to around $500 per kWh (up to half the price per kWh it cost in 2009). Currently, the price per kWh is $200, and it is expected to fall around $100 in 2025. Another fact reinforcing the battery cost reduction trend is Tesla Motors building a “Gigafactory” in order to decrease production costs and increase manufacturing of batteries.79Sanguesa, J. A., Torres-Sanz, V., Garrido, P., Martinez, F. J. & Marquez-Barja, J. M. A Review on Electric Vehicles: Technologies and Challenges. Smart Cities 4, 372–404 (2021). However, another issue with EVs is the battery’s limited driving range,80Silvia, C. & Krause, R. M. Assessing the impact of policy interventions on the adoption of plug-in electric vehicles: An agent-based model. Energy Policy 96, 105–118 (2016). causing range anxiety among consumers. The driving distance of EVs fluctuates from just 62 miles of the Mitsubishi MiEV up to 265 miles of the Tesla Model S P85.81Bonges, H. A. & Lusk, A. C. Addressing electric vehicle (EV) sales and range anxiety through parking layout, policy and regulation. Transportation Research Part A: Policy and Practice 83, 63–73 (2016).
4.2.3 Social and environmental barriers
One of the social barriers are concerns about the availability of accessible charging spots and range anxiety. Range anxiety explains the fear of not reaching a charging spot within the reach of an EV which is amplified in regions with insufficient charging infrastructures.81Bonges, H. A. & Lusk, A. C. Addressing electric vehicle (EV) sales and range anxiety through parking layout, policy and regulation. Transportation Research Part A: Policy and Practice 83, 63–73 (2016). According to Kantar’s consumer study on attitudes towards EVs in the UK, 43% expressed range anxiety.73Kantar. Understanding Consumer Attitudes Towards Electric Vehicles. Kantarhttps://www.kantar.com/inspiration/research-services/understanding-consumer-attitudes-towards-electric-vehicles-pf (2023). Another linked barrier to EV adoption is the fear of not having an accessible and usable charging point. Long queues at chargers, broken chargers or a car parked in front of a charger could be reasons for this fear.81Bonges, H. A. & Lusk, A. C. Addressing electric vehicle (EV) sales and range anxiety through parking layout, policy and regulation. Transportation Research Part A: Policy and Practice 83, 63–73 (2016).
Nevertheless, there are measures to alleviate these fears, including apps for public charging stations like ChargeHub, PlugShare, Chargepoint, or EVgo that provide information on available plug types and locations. This facilitates locating charging spots and alleviates concerns about the missing availability of a nearby station for charging their vehicle.82Muhammad, Z., Anwar, Z. & Saleem, B. A cybersecurity risk assessment of electric vehicle mobile applications: findings and recommendations. in 2023 3rd International Conference on Artificial Intelligence (ICAI) 45–51 (IEEE, 2023). doi:10.1109/ICAI58407.2023.10136682.
Another concern is the perception of technology involving batteries as unsafe, due to the nature of the parts and components they contain. The main safety concern is the fact that batteries can explode in an accident or in extreme weather conditions, causing a fire. The most common type of battery used in EVs today is the lithium‐ion battery, which has a tendency to explode and generate a lot of heat if the battery itself is punctured or damaged.78Krishna, G. Understanding and identifying barriers to electric vehicle adoption through thematic analysis. Transportation Research Interdisciplinary Perspectives 10, 100364 (2021).
An additional safety‐related issue cited is the lack of noise. EVs are comparatively quieter than conventional vehicles during operation. This silence is perceived as unsafe by users, as the driver is unaware of the vehicle’s speed unless they look at the speedometer. It is worth noting that drivers tend to judge speed from engine noise, as looking at the speedometer is particularly distracting.78Krishna, G. Understanding and identifying barriers to electric vehicle adoption through thematic analysis. Transportation Research Interdisciplinary Perspectives 10, 100364 (2021).
There is another barrier that relates to the environmental impact of EVs. It has been said that, although EVs do not produce direct CO2 emissions, they are not entirely environmentally friendly when considering their full life cycle. A major reason for this is due to the need for mining to produce batteries and other related components. The emissions from the mining operations of battery components such as lithium need consideration. Also, the negative environmental impact due to the toxicity of the materials used to manufacture the battery, and therefore the risk of this technology merely changing the nature of environmental impact and not reducing it is a reason represented in literature. The same concerns are applied to the end-of-life management and with this the lack of current options to recycle batteries and their components.78Krishna, G. Understanding and identifying barriers to electric vehicle adoption through thematic analysis. Transportation Research Interdisciplinary Perspectives 10, 100364 (2021). Further, EVs do not reduce congestion which is a main reason for additional air pollution.75Leila Mead. The Road to Sustainable Transport. International Institute for Sustainable Development https://www.iisd.org/articles/deep-dive/road-sustainable-transport (2021).
References
- 1Tolley, R., Tolley, R. S., Turton, B. J. & Turton, B. J. Transport systems, policy and planning: a geographical approach. (Wiley, 1995).
- 2European Commission. Joint Research Centre. The future of road transport : implications of automated, connected, low-carbon and shared mobility. (Publications Office, 2019).
- 3Rodrigue, J.-P. The Geography of Transport Systems. (Routledge, 2020). doi:10.4324/9780429346323.
- 4Fenelon, K. G. The economics of road transport. (Routledge, 2017).
- 5Eurostat. Freight Transport Statistics – Modal Split. Eurostat – Statistics Explainedhttps://ec.europa.eu/eurostat/statistics-explained/index.php?title=Freight_transport_statistics_-_modal_split#:~:text=The%20share%20of%20road%20transport%20in%20the%20total%20EU%20freight,in%202012%2C%20at%2022.0%20%25. (2023).
- 6Crainic, T. G. & Kim, K. H. Chapter 8 Intermodal Transportation. in Handbooks in Operations Research and Management Science vol. 14 467–537 (Elsevier, 2007).
- 7DHL International GmbH. Glossary. Glossary https://lot.dhl.com/glossary-index/m/ (2023).
- 8Yin, W., He, S., Zhang, Y. & Hou, J. A Product-Focused, Cloud-Based Approach to Door-to-Door Railway Freight Design. IEEE Access 6, 20822–20836 (2018).
- 9Statistisches Bundesamt (Destatis). Passenger Transport. Passenger Transporthttps://www.destatis.de/EN/Themes/Economic-Sectors-Enterprises/Transport/Passenger-Transport/Tables/passengers-carried.html (2023).
- 10Statistisches Bundesamt (Destatis). Important Transport Indicators. Europe Transporthttps://www.destatis.de/Europa/EN/Topic/Key-indicators/Transport.html (2023).
- 11Eurostat. Number of cars per inhabitant increased in 2021. News Articleshttps://ec.europa.eu/eurostat/web/products-eurostat-news/w/ddn-20230530-1#:~:text=In%202021%2C%20the%20average%20number,central%20and%20eastern%20EU%20members. (2023).
- 12The number of cars worldwide is set to double by 2040. World Economic Forumhttps://www.weforum.org/agenda/2016/04/the-number-of-cars-worldwide-is-set-to-double-by-2040 (2016).
- 13Nitch Smith, M. World Development Indicatos. The World Bank – Data Cataloghttps://datacatalog.worldbank.org/search/dataset/0037712 (2023).
- 14European Commission. Why the automotive industry is important. Automotive industryhttps://single-market-economy.ec.europa.eu/sectors/automotive-industry_en (2023).
- 15Carlier, M. Automotive industry worldwide – statistics and facts. Statistahttps://www.statista.com/topics/1487/automotive-industry/#topicOverview (2023).
- 16Jong, G. C. D. & Riet, O. V. D. The Driving Factors of Passenger Transport. European Journal of Transport and Infrastructure Research Vol 8 No 3 (2008) (2008) doi:10.18757/EJTIR.2008.8.3.3348.
- 17Santos, G., Behrendt, H. & Teytelboym, A. Part II: Policy instruments for sustainable road transport. Research in Transportation Economics 28, 46–91 (2010).
- 18Santos, G. Road transport and CO 2 emissions: What are the challenges? Transport Policy 59, 71–74 (2017).
- 19Williams, I. D. & Blyth, M. Autogeddon or autoheaven: Environmental and social effects of the automotive industry from launch to present. Science of The Total Environment 858, 159987 (2023).
- 20Maciorowski, M. M. & Souza, J. C. Urban Roads and Non-Motorized Transport: The Barrier Effect and Challenges in the Search for Sustainable Urban Mobility. Transportation Research Procedia 33, 123–130 (2018).
- 21World Health Organization. Road traffic injuries. Road traffic injuries https://www.who.int/news-room/fact-sheets/detail/road-traffic-injuries (2022).
- 22Ecology in Transport: Problems and Solutions. vol. 124 (Springer International Publishing, 2020).
- 23Mo & Wang. Environmental Sustainability of Road Transport in OECD Countries. Energies 12, 3525 (2019).
- 24Tsemekidi Tzeiranaki, S. et al. “The impact of energy efficiency and decarbonisation policies on the European road transport sector”. Transportation Research Part A: Policy and Practice 170, 103623 (2023).
- 25Towards a climate-neutral europe: curbing the trend. (Routledge, 2020).
- 26Tiseo, I. Distribution of greenhouse gas emissions worldwide in 2020, by sub sector. Statistahttps://www.statista.com/statistics/1167298/share-ghg-emissions-by-sub-sector-sector-globally/ (2023).
- 27Ritchie, H. Cars, planes, trains: where do CO2 emissions from transport come from? Our World in Data https://ourworldindata.org/co2-emissions-from-transport (2020).
- 28IEA. Comparative life-cycle greenhouse gas emissions of a mid-size BEV and ICE vehicle. IEA, Paris https://www.iea.org/data-and-statistics/charts/comparative-life-cycle-greenhouse-gas-emissions-of-a-mid-size-bev-and-ice-vehicle (2021).
- 29International Transport Forum. ITF work on Gender in Transport. International Transport Forumhttps://www.itf-oecd.org/itf-work-gender-transport.
- 30Duchene, C. Gender and Transport. OECD vol. 2011/11 https://www.oecd-ilibrary.org/transport/gender-and-transport_5kg9mq47w59w-en (2011).
- 31Smit-Jacobs, K. Women working in transport. European Parliament – Think Tankhttps://www.europarl.europa.eu/thinktank/en/document/EPRS_ATA(2022)729293 (2022).
- 32European Parliament. Women and transport. https://www.europarl.europa.eu/RegData/etudes/STUD/2021/701004/IPOL_STU(2021)701004_EN.pdf (2021).
- 33Statistisches Bundesamt (Destatis). Quality of Employment – Gender Pay Gap. Statistisches Bundesamt (Destatis) https://www.destatis.de/EN/Themes/Labour/Labour-Market/Quality-Employment/Dimension1/1_5_GenderPayGap.html#:~:text=The%20gender%20pay%20gap%20was,few%20women%20were%20employed%20here. (2023).
- 34Hamilton, K., Jenkins, L., Hodgson, F. & Turner, J. Promoting gender equality in transport. (Equality and Human Rights Commission, 2005).
- 35World Health Organization. The top 10 causes of death. World Health Organizationhttps://www.who.int/news-room/fact-sheets/detail/the-top-10-causes-of-death (2020).
- 36Let farmers judge: experiences in assessing the sustainability of agriculture. (Intermediate Technology Publications, 1992).
- 37Joumard, R. & Gudmundsson, H. Indicators of environmental sustainability in transport: an interdisciplinary approch to methods. (INRETS COST, 2010).
- 38Toth-Szabo, Z. & Várhelyi, A. Indicator Framework for Measuring Sustainability of Transport in the City. Procedia – Social and Behavioral Sciences 48, 2035–2047 (2012).
- 39Umweltbundesamt. Air quality index. Umweltbundesamthttps://www.umweltbundesamt.de/en/data/air/air-data/air-quality/eJzrWJSSuMrIwMhY18BC18hiUUnmIkOLRXmpCxYVlyxYnOJWhJA0XJwSko-sNreKbVFuctPinMSS0w6eq-a9apQ7vjgnL_20g8o5F4dPFrMBTwEkjg== (2023).
- 40Shah, K. J. et al. Green transportation for sustainability: Review of current barriers, strategies, and innovative technologies. Journal of Cleaner Production 326, 129392 (2021).
- 41European Commission. Sustainable and smart mobility strategy – putting european transport on track for the future. (2020).
- 42Othman, B., De Nunzio, G., Di Domenico, D. & Canudas-de-Wit, C. Ecological traffic management: A review of the modeling and control strategies for improving environmental sustainability of road transportation. Annual Reviews in Control 48, 292–311 (2019).
- 43Velazquez, L. et al. Sustainable transportation strategies for decoupling road vehicle transport and carbon dioxide emissions. Management of Environmental Quality: An International Journal 26, 373–388 (2015).
- 44Wang, Y. & Boggio-Marzet, A. Evaluation of Eco-Driving Training for Fuel Efficiency and Emissions Reduction According to Road Type. Sustainability 10, 3891 (2018).
- 46Monzon, A. & Wang, Y. Toward Sustainable and Low Carbon Road Transportation: Policies, Tools, and Planning Methods. Sustainability 11, 1709 (2019).
- 47Helgeson, B. & Peter, J. The role of electricity in decarbonizing European road transport – Development and assessment of an integrated multi-sectoral model. Applied Energy 262, 114365 (2020).
- 48Axsen, J., Plötz, P. & Wolinetz, M. Crafting strong, integrated policy mixes for deep CO2 mitigation in road transport. Nat. Clim. Chang. 10, 809–818 (2020).
- 49Bureika, G., Matijošius, J. & Rimkus, A. Alternative Carbonless Fuels for Internal Combustion Engines of Vehicles. in Ecology in Transport: Problems and Solutions (ed. Sładkowski, A.) vol. 124 1–49 (Springer International Publishing, 2020).
- 50Panchuk, M., Kryshtopa, S., Sładkowski, A. & Panchuk, A. Environmental Aspects of the Production and Use of Biofuels in Transport. in Ecology in Transport: Problems and Solutions (ed. Sładkowski, A.) vol. 124 115–168 (Springer International Publishing, 2020).
- 51McLeod, S. & Curtis, C. Integrating urban road safety and sustainable transportation policy through the hierarchy of hazard controls. International Journal of Sustainable Transportation 16, 166–180 (2022).
- 52Merkisz-Guranowska, A., Merkisz, J., Kozak, M. & Jacyna, M. Development of a sustainable road transport system. in 507–517 (2013). doi:10.2495/UT130411.
- 53Menendez, M. & Ambühl, L. Implementing Design and Operational Measures for Sustainable Mobility: Lessons from Zurich. Sustainability 14, 625 (2022).
- 54Kadłubek, M. Relevance of modern technologies for sustainability-focused road freight transport service management in a competitive market. Procedia Computer Science 207, 2013–2022 (2022).
- 55IEA. Global EV Outlook 2021. IEA https://www.iea.org/reports/global-ev-outlook-2021 (2021).
- 56European Commission. A European Green Deal. https://commission.europa.eu/strategy-and-policy/priorities-2019-2024/european-green-deal_en (2021).
- 57Department for transport. Rapid charging fund. GOV.UK https://www.gov.uk/guidance/rapid-charging-fund (2021).
- 58Dr. Gerd Leutner & Dr. Antje Becker-Boley. Electric vehicle regulation and law in Germany | CMS Expert Guides. https://cms.law/en/int/expert-guides/cms-expert-guide-to-electric-vehicles/germany (2018).
- 59European Commission. CO₂ emission performance standards for cars and vans. https://climate.ec.europa.eu/eu-action/transport/road-transport-reducing-co2-emissions-vehicles/co2-emission-performance-standards-cars-and-vans_en (2023).
- 60ETCS. ETSC statement on ‘EU Save Energy’ speed recommendations – ETSC. ETSC statement on ‘EU save energy’ speed recommendations https://etsc.eu/etsc-statement-on-eu-save-energy-speed-recommendations/ (2022).
- 61McMahon, J. Electric Vehicles Cost Less Than Half As Much To Drive. Forbes. https://www.forbes.com/sites/jeffmcmahon/2018/01/14/electric-vehicles-cost-less-than-half-as-much-to-drive/#61e6ef7f3f97 (2018).
- 62Lanz, L., Noll, B., Schmidt, T. S. & Steffen, B. Comparing the levelized cost of electric vehicle charging options in Europe. Nat Commun 13, 5277 (2022).
- 63Statista. Electricity prices for charging stations for electric cars in Germany in 2023, by provider. Statista https://www.statista.com/statistics/1167538/electricity-prices-charging-stations-electric-cars-by-provider-germany/ (2023).
- 64Bäumer, M., Hautzinger, H., Kuhnimhof, T. & Pfeiffer, M. The German Vehicle Mileage Survey 2014: Striking the balance between methodological innovation and continuity. Transportation Research Procedia 32, 329–338 (2018).
- 65Statista. Durchschnittlicher Kraftstoffverbrauch der in Deutschland zugelassenen Pkw in den Jahren von 2011 bis 2021. Statistahttps://de.statista.com/statistik/daten/studie/484054/umfrage/durchschnittsverbrauch-pkw-in-privaten-haushalten-in-deutschland/#:~:text=Der%20durchschnittliche%20Kraftstoffverbrauch%20von%20Personenkraftwagen,Kraftstoff%20für%20die%20gleiche%20Strecke. (2022).
- 66Statista. Durchschnittlicher Preis für Superbenzin in Deutschland in den Jahren 1972 bis 2023. Statista https://de.statista.com/statistik/daten/studie/776/umfrage/durchschnittspreis-fuer-superbenzin-seit-dem-jahr-1972/ (2023).
- 67US Department of Transportation. President Biden, U.S. Department of Transportation Releases Toolkit to Help Rural Communities Build Out Electric Vehicle Charging Infrastructure | US Department of Transportation. U.S. Department of Transportation https://www.transportation.gov/briefing-room/president-biden-us-department-transportation-releases-toolkit-help-rural-communities (2022).
- 68The Federal Government. What the government is doing for the climate. Website of the Federal Government | Bundesregierung https://www.bundesregierung.de/breg-en/issues/climate-action/government-climate-policy-1779414.
- 69Zheng, S. et al. Identifying Intention-Based Factors Influencing Consumers’ Willingness to Pay for Electric Vehicles: A Sustainable Consumption Paradigm. Sustainability 14, 16831 (2022).
- 70Deloitte. 2023 Global Automotive Consumer Study | Deloitte US. Deloitte.https://www.deloitte.com/global/en/Industries/automotive/perspectives/global-automotive-consumer-study.html (2023).
- 71Secinaro, S., Calandra, D., Lanzalonga, F. & Ferraris, A. Electric vehicles’ consumer behaviors: Mapping the field and providing a research agenda. Journal of Business Research 150, 399–416 (2022).
- 72Guno, C. S., Collera, A. A. & Agaton, C. B. Barriers and Drivers of Transition to Sustainable Public Transport in the Philippines. WEVJ 12, 46 (2021).
- 73Kantar. Understanding Consumer Attitudes Towards Electric Vehicles. Kantarhttps://www.kantar.com/inspiration/research-services/understanding-consumer-attitudes-towards-electric-vehicles-pf (2023).
- 74Sustainable transport: planning for walking and cycling in urban environments. (CRC Press ; Woodhead Pub, 2003).
- 75Leila Mead. The Road to Sustainable Transport. International Institute for Sustainable Development https://www.iisd.org/articles/deep-dive/road-sustainable-transport (2021).
- 76Pelegov, D. & Pontes, J. Main Drivers of Battery Industry Changes: Electric Vehicles—A Market Overview. Batteries 4, 65 (2018).
- 77IEA. Electric car sales break new records with momentum expected to continue through 2023. IEA https://www.iea.org/reports/global-ev-outlook-2023/executive-summary (2023).
- 78Krishna, G. Understanding and identifying barriers to electric vehicle adoption through thematic analysis. Transportation Research Interdisciplinary Perspectives 10, 100364 (2021).
- 79Sanguesa, J. A., Torres-Sanz, V., Garrido, P., Martinez, F. J. & Marquez-Barja, J. M. A Review on Electric Vehicles: Technologies and Challenges. Smart Cities 4, 372–404 (2021).
- 80Silvia, C. & Krause, R. M. Assessing the impact of policy interventions on the adoption of plug-in electric vehicles: An agent-based model. Energy Policy 96, 105–118 (2016).
- 81Bonges, H. A. & Lusk, A. C. Addressing electric vehicle (EV) sales and range anxiety through parking layout, policy and regulation. Transportation Research Part A: Policy and Practice 83, 63–73 (2016).
- 82Muhammad, Z., Anwar, Z. & Saleem, B. A cybersecurity risk assessment of electric vehicle mobile applications: findings and recommendations. in 2023 3rd International Conference on Artificial Intelligence (ICAI) 45–51 (IEEE, 2023). doi:10.1109/ICAI58407.2023.10136682.