Authors: Janna Geesen, Thomas Lorch, Melissa Tietje
Edited by: Vanessa Heidt, Anne Hovehne, Lea Neill, Annika Strehl, David Koch, Florian Pfeiffer, Yannick Borchers, Timon Bloemen, Amelie Harms, Rouven Heidrich, Erik Neumann, Sönke Sanders
Last updated: March 26, 2026
Executive summary
This article explains biodiversity, its dimensions, and its critical role in sustaining ecosystems and businesses. Biodiversity spans genetic, species, and ecosystem levels, enabling essential ecosystem services such as climate regulation, food provision, and cultural benefits. Human activities have accelerated biodiversity loss, driven by land and sea use changes, overexploitation, climate change, pollution, and invasive species.
Businesses depend on biodiversity for raw materials and ecosystem services, yet they contribute significantly to its decline. Firms face risks such as supply chain disruptions and reputational damage but can benefit from proactive biodiversity strategies through innovation, market expansion, and improved stakeholder relations.
Measurement tools and frameworks, including the Global Biodiversity Score and Biodiversity Impact Matrix, help companies assess and manage their biodiversity footprint. Key performance indicators and metrics like mean species abundance and habitat hectares support decision-making. Tools such as IBAT, biodiversity audits, and offset programs enable firms to integrate biodiversity into operations and reporting.
Drivers for corporate biodiversity action include regulatory pressures, market demand, and stakeholder expectations, while barriers involve high costs, lack of expertise, and insufficient regulations. Voluntary initiatives, certifications, and technological innovations offer pathways for improvement. Firms that act early gain resilience, competitive advantage, and long-term sustainability.
1 Definition
Biodiversity refers to the variety of life on our planet or in a particular region. This includes different species of microbes, plants, animals, and even entire ecosystems. A biodiverse planet is essential for human health and well-being. Without it, entire food chains would collapse, farming would yield fewer and lower-quality crops, diseases would spread more easily, and many other consequences would follow. The loss of biodiversity on our planet is currently occurring at a rate 10 to 100 times faster than the natural baseline. The primary factors contributing to biodiversity loss are climate change, deforestation, and habitat fragmentation. Therefore, the WHO and other international institutions advocate for the protection of biodiversity.1World Health Organization. Biodiversity. WHO https://www.who.int/news-room/fact-sheets/detail/biodiversity (2025). [Accessed on 15.09.2025]
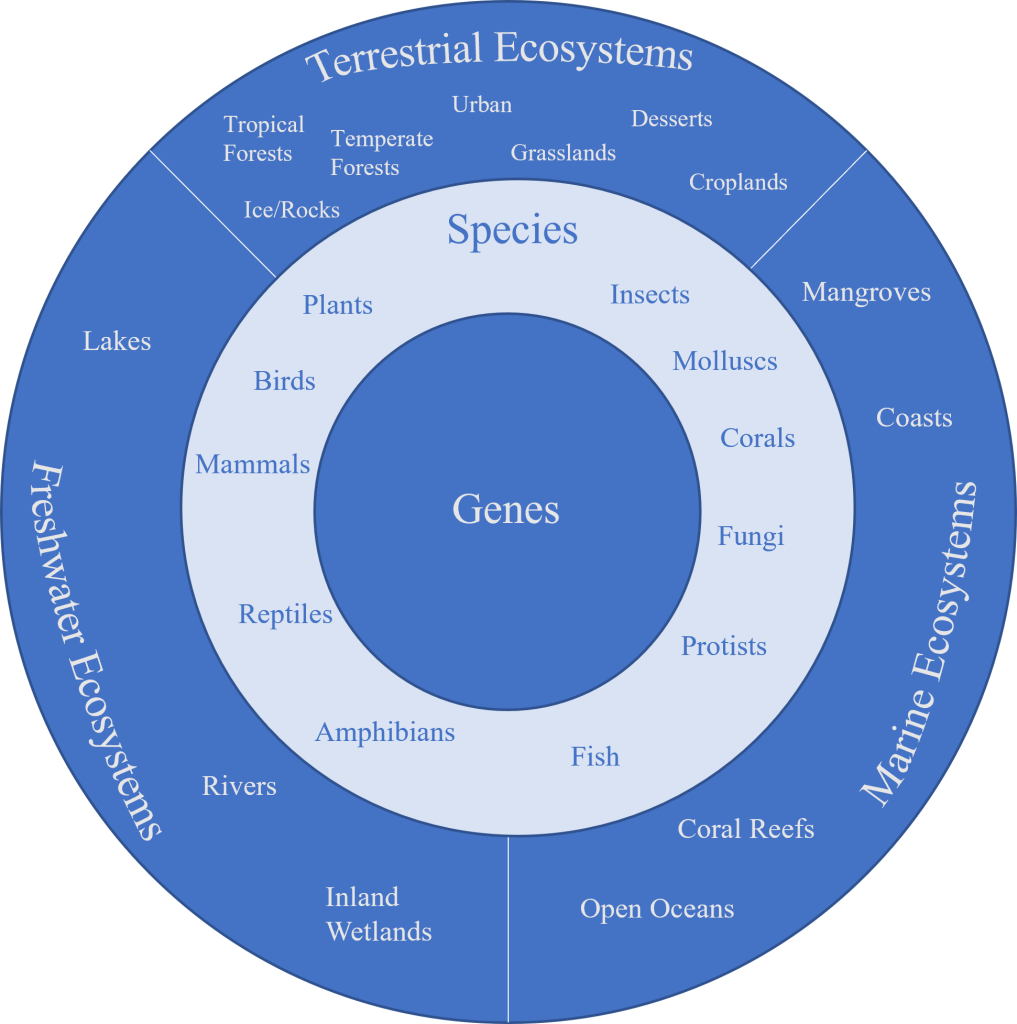
As can be seen in figure 1, Biodiversity describes the following dimensions: On the smallest level, biodiversity encompasses genetic variability. This refers to the distinctiveness of genes within a species or breed. An important aspect determined by genetic variability is the adaptability of a species to threats and changes in the environment. The next level is the species level. This depicts the variety of plants, animals, and microorganisms.2NABU, “The Biodiversity Imperative for Business Preserving the Foundations of Our Well-Being,” NABU-Bundesverband, Berlin, 2020.3IPBES. Global Assessment Report of the Intergovernmental Science-Policy Platform on Biodiversity and Ecosystem Services (Bonn: IPBES secretariat, 2019). The total number of species is estimated at 8.7 million. According to the identification and classification of the International Union for Conservation of Nature (IUCN), there are 112,400 known species, of which 45% are vertebrates, 35% are plants, and 20% are invertebrates. On the next level, biodiversity includes ecosystems, particularly the mutual interplay of plants, animals, and microorganisms and their nonliving environment within a system. The size and species abundance of an ecosystem are important measures used to rate the health of an ecosystem. There are three major types of ecosystems that occur in a wide range of local forms: terrestrial, freshwater, and marine. All are subject to constant development and react sensitively to external conditions.2NABU, “The Biodiversity Imperative for Business Preserving the Foundations of Our Well-Being,” NABU-Bundesverband, Berlin, 2020.
Marine ecosystems are the largest in terms of area, accounting for 70% of the earth’s surface, including open oceans, coastal areas, mangroves, and coral reefs. Marine ecosystems have an enormous influence on the global climate, the amount and frequency of precipitation, and the distribution of atmospheric humidity. Terrestrial ecosystems take up 29% of the earth’s surface. They include tropical, temperate, and boreal forests, grasslands, deserts, ice and rock regions, croplands, and urban ecosystems. Terrestrial ecosystems require precipitation and/or freshwater sources to sustain their respective species populations. Freshwater ecosystems are the smallest in terms of area, including inland wetlands, peatlands, lakes, and rivers. However, although they cover only 0.5% of the earth’s surface, freshwater ecosystems are immensely important and extremely sensitive, providing high-value ecosystem services. They often link terrestrial ecosystems with marine ecosystems, giving them a systemic function.2NABU, “The Biodiversity Imperative for Business Preserving the Foundations of Our Well-Being,” NABU-Bundesverband, Berlin, 2020.
The interplay of the aforementioned levels and dimensions is the basis of the so-called ecosystem services, which comprise regulating, cultural, habitat, and provisioning services (compare Figure 1). Regulating services include essential functions for a stable environment, such as the regulation of the climate, wastewater treatment, recycling of nutrients, erosion prevention, and flood control. Cultural services provided by ecosystems relate to physical and mental recreation, cultural heritage, spiritual values, education, and inspiration. Habitat services refer to nature’s ability to provide refuges, nurseries, and habitats for animals and plants, as well as to form the humus-rich, fertile soils that are the basis for agriculture. Provisioning services include the supply of food, raw materials, and genetic and medical recourses.2NABU, “The Biodiversity Imperative for Business Preserving the Foundations of Our Well-Being,” NABU-Bundesverband, Berlin, 2020.3IPBES. Global Assessment Report of the Intergovernmental Science-Policy Platform on Biodiversity and Ecosystem Services (Bonn: IPBES secretariat, 2019). Likewise to the definition of biodiversity, biodiversity loss is defined as follows:
“The reduction of any aspect of biological diversity (i.e. diversity at the genetic, species, and ecosystem levels) is lost in a particular area through death (including extinction), destruction or manual removal; it can refer to many scales, from global extinctions to population extinctions, resulting in decreased total diversity at the same scale.”4IPBES. Glossary. Biodiversity Loss https://ipbes.net/glossary/biodiversity-loss#:~:text=The%20reduction%20of%20any%20aspect,extinctions%2C%20resulting%20in%20decreased%20total (2020).
Changes in only one element of the biodiversity cycle can curtail these functions. In fact, human activities are largely responsible for biodiversity loss. In particular, humans are responsible for the destruction of ecosystems, the loss of ecosystem services, the extinction of species, and the decline of genetic diversity.2NABU, “The Biodiversity Imperative for Business Preserving the Foundations of Our Well-Being,” NABU-Bundesverband, Berlin, 2020. In fact, human activities are largely responsible for biodiversity loss through the destruction of ecosystems, which leads to a loss of ecosystem services, the extinction of species, and the decline of genetic diversity.2NABU, “The Biodiversity Imperative for Business Preserving the Foundations of Our Well-Being,” NABU-Bundesverband, Berlin, 2020. These issues and the severity of biodiversity loss have been known for decades. International, national, and regional political agreements have tried to establish different goals and guidelines for preserving biodiversity to maintain functional and diverse ecosystems. In recent years, international agreements like the SDGs5United Nations (n.d.). Biodiversity and ecosystems. https://sustainabledevelopment.un.org/topics/biodiversityandecosystems. or the EU with its ‘biodiversity strategy 2030’ included biodiversity topics more and more into the different aspects of society. This also covered aspects for the economic aspects and business activities regarding biodiversity as one of the most relevant actors in this topic6European Commission (2021). EU Biodiversity Strategy for 2030. Bringing nature back into our lives. https://op.europa.eu/de/publication-detail/-/publication/31e4609f-b91e-11eb-8aca-01aa75ed71a1.. Businesses contribute to this loss through their use of water, land, and other recourses as well as through their emissions.7UN Environment Programme World Conservation Monitoring Centre (UNEP-WCMC). Biodiversity Measures for Business: Corporate Biodiversity Measurement and Disclosure Within the Current and Future Global Policy Context (Cambridge: UNEP-WCMC, 2020). According to the global assessment report of the Intergovernmental Science-Policy Platform on Biodiversity and Ecosystem Services, the decline in biodiversity is faster than ever in human history.3IPBES. Global Assessment Report of the Intergovernmental Science-Policy Platform on Biodiversity and Ecosystem Services (Bonn: IPBES secretariat, 2019).
2 Measures
2.1 General perspective
Since biodiversity includes several levels and dimensions, various indicators measure biodiversity and biodiversity loss. The Global Assessment Report on Biodiversity and Ecosystem Services, however, provides several indicators that capture biodiversity loss. The following are examples of some of these indicators. The report includes an analysis of 18 ecosystem service categories based on a systematic review of over 2,000 studies. The analysis shows a decline in 14 out of 18 categories from 1970 to the present. Global indicators for ecosystems’ extents and conditions show an average decline of 47% relative to their earliest estimated baseline. Many of the indicators continue to decline by at least 4% per decade. The global rate of species extinction is estimated to be 10-100 times higher than the average rate in the past, 10 million, with an accelerating trend. Anthropogenic activities have led to at least 680 vertebrate species extinctions since 1500. According to the International Union for the Conservation of Nature’s Red List, 25% of species are threatened with extinction. Human-driven changes in species diversity within local ecological communities lead to an average decrease of 20% for naturally occurring species relative to their original abundance.3IPBES. Global Assessment Report of the Intergovernmental Science-Policy Platform on Biodiversity and Ecosystem Services (Bonn: IPBES secretariat, 2019).
2.2 Business perspective and current trends
Businesses have increasingly acknowledged the importance of measuring their impact on biodiversity. However, the UN Sustainable Development Goals related to biodiversity are the least prioritized in business reporting. This is also related to the complexity of biodiversity measurement. Businesses are struggling to find relevant measurement tools that are practical and pragmatic. The landscape of biodiversity measurement tools for businesses, however, is growing rapidly. These tools are based on data collection, measurement, and valuation, as well as on the interpretation of the outcome as a base for decision making. While some approaches are piloted by companies, other approaches are still under development. Most approaches are continuously improved and upgraded with new insights and recent data.3IPBES. Global Assessment Report of the Intergovernmental Science-Policy Platform on Biodiversity and Ecosystem Services (Bonn: IPBES secretariat, 2019).8Lammerant, J. et al. Assessment of Biodiversity Measurement Approaches for Businesses and Financial Institutions, Update Report 3 on Behalf of the EU Business @ Business Platform https://ec.europa.eu/environment/biodiversity/business/assets/pdf/EU%20B@B%20Platform%20Update%20Report%203_FINAL_1March2021.pdf (2021).
The EU Business @ Biodiversity (B@B) Platform, which is set up by the European Commission to help businesses integrate natural capital and biodiversity considerations into their business practices, published an assessment report on biodiversity measurement approaches for business and financial institutions. This report reflects on 19 measurement approaches and offers a decision framework for selecting measurement tools and metrics, or a combination of them that fit the specific context of a business. Table 1 gives an overview of 13 approaches that include a quality-reviewed case study.8Lammerant, J. et al. Assessment of Biodiversity Measurement Approaches for Businesses and Financial Institutions, Update Report 3 on Behalf of the EU Business @ Business Platform https://ec.europa.eu/environment/biodiversity/business/assets/pdf/EU%20B@B%20Platform%20Update%20Report%203_FINAL_1March2021.pdf (2021).
| Name of tool/framework | Developer |
| Biodiversity Footprint Financial Institutions | ASN Bank (NL) CREM (NL) PRé Sustainability (NL) |
| Biodiversity Indicators for Site-based Impacts | United Nations Environment Programme World Conservation Monitoring Centre, Conservation International, and Fauna & Flora International (Int) |
| Biodiversity Impact Metric | Cambridge Institute for Sustainable Leadership (UK) |
| Global Biodiversity Score® | CDC Biodiversité (France) |
| GBS® _for financial institutions | CDC Biodiversité (France) & partners |
| LIFE Key | LIFE Institute (Brazil) |
| Product Biodiversity Footprint | I CARE – Sayari (France) |
| Species Threat Abatement and Restoration metric | IUCN (Int) |
| Biodiversity Footprint Methodology and Calculator | Plansup |
| Corporate Biodiversity Footprint | Iceberg Data Lab |
| Biodiversity Net Gain Calculator | Arcadis |
| Biodiversity Indicator and Reporting System and ecosystem service assessment | LafargeHolcim |
| ReCiPe2016 | Radboud University, RIVM, Norwegian University of Science and Technology, PRé Sustainability |
The so-called biodiversity measurement navigation wheel helps businesses to find fitting approaches and metrics. The biodiversity measurement navigation wheel includes different criteria and navigation questions stated in the Annex and is supported by tables, matrixes, and case studies for guidance.8Lammerant, J. et al. Assessment of Biodiversity Measurement Approaches for Businesses and Financial Institutions, Update Report 3 on Behalf of the EU Business @ Business Platform https://ec.europa.eu/environment/biodiversity/business/assets/pdf/EU%20B@B%20Platform%20Update%20Report%203_FINAL_1March2021.pdf (2021).
2.3 Key performance indicators
These measurement approaches include different kinds of metrics and key performance indicators (KPIs). The B@B assessment report includes the biodiversity metric table that lists common metrics for measuring biodiversity, which is shown in a shortened version in Table 2.
| Type of metric | Commonly used metrics | Unit of biodiversity | Approaches relying on these metrics |
| Species metrics | Number of individuals | Number of individuals of any one species | Biodiversity Indicators for Site-based Impacts |
| Species Threat Abatement and Restoration metric | Globally threatened species | Species Threat Abatement and Restoration metric | |
| Extent * Condition metrics | Habitat hectares; quality hectares | Ecosystems | – |
| Mean species abundance | All species | Biodiversity Footprint Methodology/Calculator; Global Biodiversity Score; Corporate Biodiversity Footprint | |
| Potentially disappeared fraction | All species | ReCiPe Product Biodiversity Footprint Biodiversity Footprint for Financial Institutions | |
| Extent (or Area) * Condition (or Quality) * Significance metrics | Biodiversity Intactness Index | All species | – |
| Biodiversity Impact Metric | All species | Biodiversity Impact Metric | |
| Site Biodiversity Condition Class | Habitats | Biodiversity Indicator and Reporting System | |
| Biodiversity Net Gain Calculator score | Biodiversity value per m2 | Biodiversity Net Gain Calculator | |
| Thematic metrics | e.g., deforestation free commodities/ palm oil free | Km2 or % Measures | – |
| Other types of biodiversity | Agrobiodiversity Index | Agro-biodiversity | Agrobiodiversity Index |
| Financial metrics | Environmental Profit & Loss accounts | Ecosystem services | Kering’s E P&L (product): LafargeHolcim’s ES valuation (site) |
| Combined state, pressure and response metrics (dashboard) | No single quantitative metric, with score cards used to identify risk areas appreciation of progress (e.g., color codes). | Habitat / species population / biodiversity management unit | Biodiversity Indicators for Site-based Impacts; LIFE Key |
The different metrics all have advantages and disadvantages. The B@B assessment report states the following insights from their analysis: Biodiversity is hard to state by one metric for all business applications and organizational areas. Extend, condition, and significance, however, are metrics that are generally accepted elements of biodiversity metrics and therefore reflect the value of biodiversity well. Model-based approaches such as Globio or ReCiPe, which rely on metrics like mean species abundance (MSA) and potentially disappeared fraction (PDF), have the benefit of being applicable for aggregation of different areas of an organization. However, they lack a local dimension, which is vital since biodiversity is a local phenomenon in the first place. Measurement approaches that are dependent on significance, such as the Species Threat Abatement and Restoration (STAR) metric, also have the benefit of allowing aggregation, which makes them more accurate. A disadvantage is that they only take biodiversity that is covered by the IUCN Threatened Species list into consideration. Financial metrics and thematic metrics measure biodiversity in different dimensions. Since different metrics have different foci, it is suggested that biodiversity metrics be combined to cover multiple angles.8Lammerant, J. et al. Assessment of Biodiversity Measurement Approaches for Businesses and Financial Institutions, Update Report 3 on Behalf of the EU Business @ Business Platform https://ec.europa.eu/environment/biodiversity/business/assets/pdf/EU%20B@B%20Platform%20Update%20Report%203_FINAL_1March2021.pdf (2021).
Annex 4 of the assessment report includes several case studies and best practice examples. Since the appropriate tool for a business is dependent on the business case, the organizational focus area, and other aspects, at this point, reference is made to those case studies.
3 Mutual influence of firms and biodiversity loss
Biodiversity and businesses are closely interrelated. On one hand, most of the global economy and its value chains are founded and dependent on ecosystem services provided by nature. On the other hand, the main drivers of biodiversity loss arise from economic activities.2NABU, “The Biodiversity Imperative for Business Preserving the Foundations of Our Well-Being,” NABU-Bundesverband, Berlin, 2020.7UN Environment Programme World Conservation Monitoring Centre (UNEP-WCMC). Biodiversity Measures for Business: Corporate Biodiversity Measurement and Disclosure Within the Current and Future Global Policy Context (Cambridge: UNEP-WCMC, 2020).
Due to the dependency of businesses on biodiversity, biodiversity loss can cause a disruption to entire supply chains and industries. The Nature and Biodiversity Conservation Union (NABU) conducted a monetary valuation of ecosystem services and estimated an annual economic benefit of $170-190 trillion, which is equivalent to twice the current global GDP. Even though only a fraction of ecosystem services can be financially assessed, this shows the scale of the economic value associated with ecosystem services. It is estimated that anthropogenic impact leads to a loss of ecosystem services worth $6-30 trillion per year. These external costs are borne by both public and private stakeholders. For businesses, this may, for example, lead to higher raw material costs.2NABU, “The Biodiversity Imperative for Business Preserving the Foundations of Our Well-Being,” NABU-Bundesverband, Berlin, 2020.
Figure 2 shows that there are five major drivers for the loss of biodiversity and ecosystem services: land and sea use change, direct overexploitation, climate change, pollution of soil, water, and air, and the spread of invasive species.9IPBES, « Global Assessment Report of the Intergovernmental Science-Policy Platform on Biodiversity and Ecosystem Services,» IPBES secretariat, Bonn, 2019.
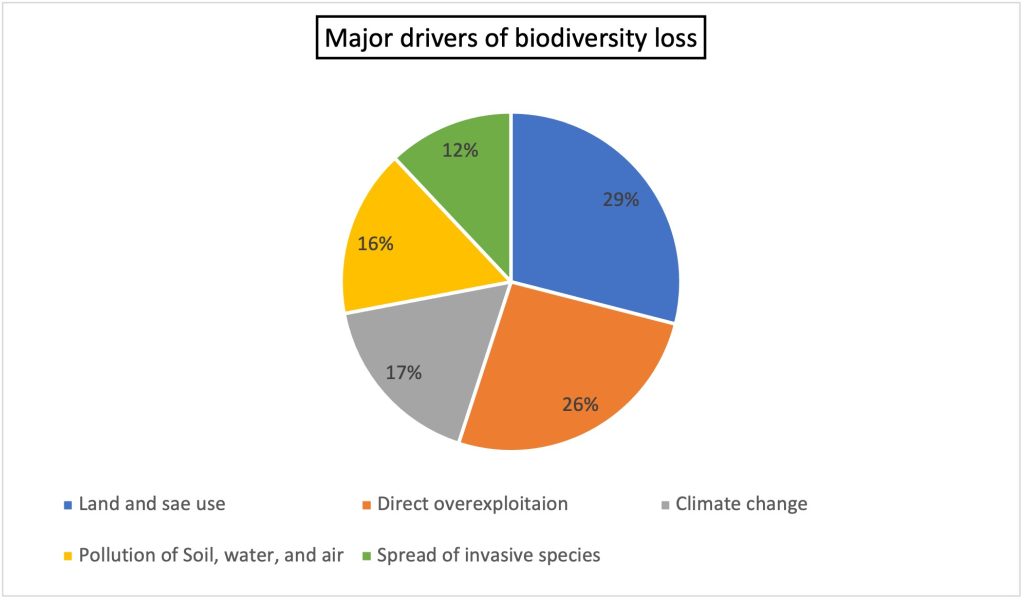
Anthropogenic pressure is unequally split among the five drivers. Human activities in the context of resource extraction, production, service provision, and consumption cause these drivers and thus the loss of biodiversity.2NABU, “The Biodiversity Imperative for Business Preserving the Foundations of Our Well-Being,” NABU-Bundesverband, Berlin, 2020.10UN Environment Programme World Conservation Monitoring Centre (UNEP-WCMC), ” Biodiversity Measures for Business: Corporate Biodiversity Measurement and Disclosure Within the Current and Future Global Policy Context,” UNEP-WCMC, Cambridge, 2020. The drivers, however, differ among regions and countries.9IPBES, « Global Assessment Report of the Intergovernmental Science-Policy Platform on Biodiversity and Ecosystem Services,» IPBES secretariat, Bonn, 2019. The five drivers of biodiversity loss are determined by economic activities at all stages along the value chains of goods and services (see figure 3).2NABU, “The Biodiversity Imperative for Business Preserving the Foundations of Our Well-Being,” NABU-Bundesverband, Berlin, 2020.
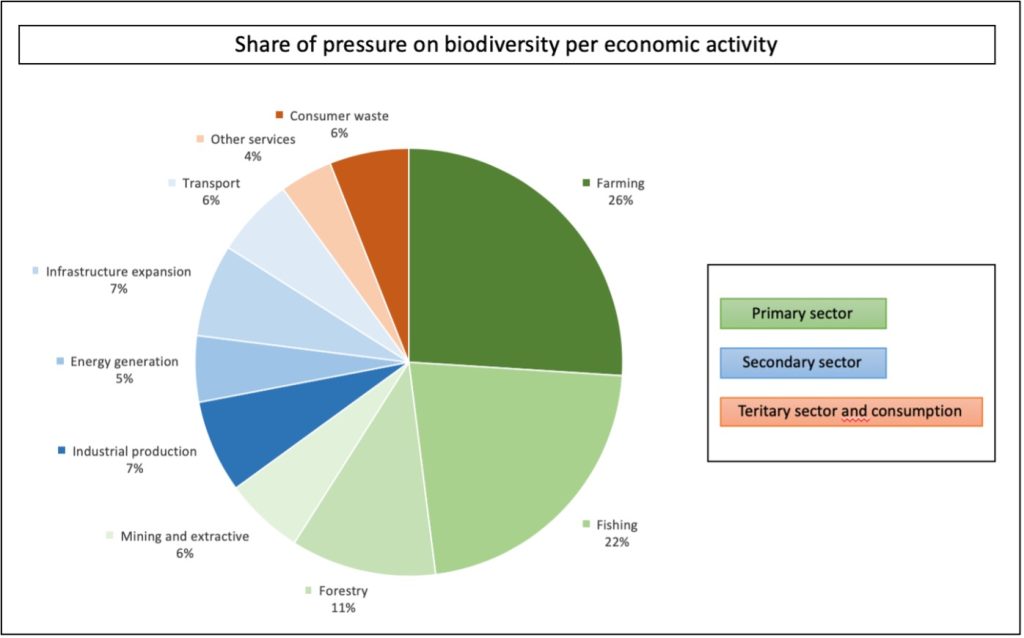
Different economic sectors as shown in Figure 3 have different impacts on the drivers of biodiversity loss.2NABU, “The Biodiversity Imperative for Business Preserving the Foundations of Our Well-Being,” NABU-Bundesverband, Berlin, 2020. The following paragraph describes the drivers of biodiversity loss in more detail and presents the main influence of the mentioned economic sectors.
The main driver of biodiversity loss is land and sea usage. Land and sea use refers to habitat conversion and degradation, e.g. deforestation and over-intensive use of (agricultural) ecosystems. The share of biodiversity pressure per economic sector mainly relates to the primary sector. (Direct) Overexploitation of animals, plants and ecosystems, e.g. from illegal trade, unsustainable logging and overfishing is also mainly caused by the primary sector. Future changes in temperature and precipitation due to increased greenhouse gas concentrations in the atmosphere (climate change) are caused in particular by agriculture and industrial production and energy generation (secondary sector). Pollution of soil, water and air mean the release of harmful or toxic substances, e.g. through excessive use of chemicals, as well as light, noise and heat pollution. Framing, mining and extractive as well as industrial production, plays the largest role here. Invasive species spread refers to plants, animals, or other non-native organisms that invade or spread into a given habitat. Here the biggest influencing factors are called farming, forestry, and transportation.
However, climate change, pollution, and the spread of invasive species are driven by activities along all steps of the value chain. The results of the NABU study show that most pressure comes from the very beginning of economic value chains due to the dominant drivers of land and sea use change and overexploitation. Altogether, nearly 80% of the pressure on biodiversity and ecosystem services arises from activities in the primary and secondary sectors. Consumer waste, however, which has been the focus of public debate, is only responsible for 6% of the pressure.2NABU, “The Biodiversity Imperative for Business Preserving the Foundations of Our Well-Being,” NABU-Bundesverband, Berlin, 2020.
3.1 Why should firms act on biodiversity?
Companies can use strategic measures protecting biodiversity to mitigate risks, create benefits, and become more resilient for the future. Biodiversity is fundamental for the balance of our planet and its inhabitants, from humans to the smallest bacteria. Due to the complexity of our ecosystems, a business can trigger unpredictable and potentially irreversible consequences. First, it is important for companies to address the impacts of their own activities on biodiversity to mitigate the physical and systemic risks of the loss of ecosystem services. This is particularly relevant for the sectors that benefit from supply functions in the industrial and primary sectors, as well as tourism, which is highly dependent on the recreational value of nature. Considering the increasing public awareness, not acting on biodiversity and having a negative impact on biodiversity may lead to regulatory and reputational risks. Companies that do not meet expectations might face fines, sanctions, declining revenues, and higher financing costs.2NABU, “The Biodiversity Imperative for Business Preserving the Foundations of Our Well-Being,” NABU-Bundesverband, Berlin, 2020.7UN Environment Programme World Conservation Monitoring Centre (UNEP-WCMC). Biodiversity Measures for Business: Corporate Biodiversity Measurement and Disclosure Within the Current and Future Global Policy Context (Cambridge: UNEP-WCMC, 2020).. On the other hand, NABU states four potential ways for companies to benefit from acting on biodiversity protection and restoration: “First, by fostering the value proposition of existing products and services through certified biodiversity standards and full disclosure. Second, by expanding to new markets or business fields with a biodiversity-friendly product portfolio. Third, by optimizing production processes, for example, through increased circularity. And fourth, by addressing the increasing environmental priorities of consumers and investors and improving the firm‘s attractiveness as an employer.”2NABU, “The Biodiversity Imperative for Business Preserving the Foundations of Our Well-Being,” NABU-Bundesverband, Berlin, 2020. The pressure on companies due to government regulations is increasing, which may lead to the development of additional costs in the future. Companies that lead on biodiversity will have significant opportunities to benefit from their efforts. First, they will be in a position to develop new products, services and business models and to enter new markets. Already, companies that do not support natural diversity are suffering due to a decline in demand. This is because they are already consciously opting for companies that make a positive contribution. Also, companies that lead on biodiversity will have better access to capital and potential operational synergies. Investors include sustainable action in their decisions.11Kurth et. al. (2020) The Biodiversity Imperative for Business. Preserving the Foundations of Our Well-Being. NABU- Bundesverband. Berlin
3.2 How can firms take action?
To protect biodiversity firms can take various measures. NABU names five sector activities that are playing an important role in the biodiversity crisis and need to change to reduce ongoing biodiversity loss. These five examples, “farming, forestry, mining, industrial production, and infrastructure expansion”2NABU, “The Biodiversity Imperative for Business Preserving the Foundations of Our Well-Being,” NABU-Bundesverband, Berlin, 2020., share similar possible activities to reduce their biodiversity footprint: Companies must integrate the protection of biodiversity into their decision-making and operational processes. Executives should work toward transparency regarding their companies’ biodiversity footprints. They also should develop strategies to reduce land conversion, water and raw material consumption, and avoid emissions and pollution.2NABU, “The Biodiversity Imperative for Business Preserving the Foundations of Our Well-Being,” NABU-Bundesverband, Berlin, 2020. The Boston Consulting Group (BCG) furthermore mentions that the energy and fashion sector contribute to biodiversity loss.12Boston Consulting Group. The Biodiversity Crisis Is a Business Crisis. https://www.bcg.com/publications/2021/biodiversity-loss-business-implications-responses (Boston: Boston Consulting Group, 2021). Companies in these sectors also can act with the mentioned activities proposed by NABU, for instance the reduction of greenhouse gases by power generation or water usage in cloth fiber production.
NABU also states the following general opportunities to act on biodiversity as a company: “1. Measure and disclose biodiversity impact; 2. Adopt biodiversity-friendly standards and drive change in value chain; 3. Develop innovative concepts and solutions; 4. Financially support protection and restoration; 5. Lobby for legal certainty and level playing field; 6. Raise biodiversity awareness among employees, suppliers, and costumers.”2NABU, “The Biodiversity Imperative for Business Preserving the Foundations of Our Well-Being,” NABU-Bundesverband, Berlin, 2020.
BCG developed a management approach for a biodiversity-positive business that consists of four stages. First, the scope of action on biodiversity is determined by considering key issues along the value chain. After that, measurable science-based targets are set. The third stage is to train and incentivize employees and gain partnerships. The last stage focuses on the actions and includes Footprint management, Innovation and Advanced biodiversity support.12Boston Consulting Group. The Biodiversity Crisis Is a Business Crisis. https://www.bcg.com/publications/2021/biodiversity-loss-business-implications-responses (Boston: Boston Consulting Group, 2021).
4 Biodiversity loss-related processes, measures, and tools for sustainability management
Assessing biodiversity impacts is a means of risk assessment for companies to understand their impact and dependency on biodiversity. Ignoring the risks of corporate biodiversity impacts can lead to legitimacy and reputational loss.7UN Environment Programme World Conservation Monitoring Centre (UNEP-WCMC). Biodiversity Measures for Business: Corporate Biodiversity Measurement and Disclosure Within the Current and Future Global Policy Context (Cambridge: UNEP-WCMC, 2020). Based on a survey of around 74,000 people in more than 16 countries, the Biodiversity Barometer showed that consumers demand that companies respect biodiversity and ask for more transparency regarding products’ biodiversity impact.13Union for Ethical BioTrade. UEBT Biodiversity Barometer 2020 https://static1.squarespace.com/static/577e0feae4fcb502316dc547/t/5faba5647c9a080d1659515b/1605084543908/UEBT+Biodiversity+Barometer+2020.pdf (2020).
At the twelfth meeting of the Conference of the Parties to the Convention on Biological Diversity, which took place in 2014 in the Republic of Korea, the parties acknowledged that many companies around the globe are not aware of the importance of biodiversity and the incorporation of biodiversity into their business models. Thus, the parties encourage companies to analyze their impact on biodiversity and develop action plans to take biodiversity in their business operations and along the supply chain into account.14Conference of the Parties to the Convention on Biological Diversity. Decision XII/10. Business Engagement (Pyeongchang: UNEP, 2014).
There is a range of tools and instruments that have been developed to support companies’ internal decision making regarding biodiversity impact management to improve their biodiversity performance. Although these tools are commonly designed for internal purposes, some can nonetheless be used for external disclosure of corporate biodiversity impacts.7UN Environment Programme World Conservation Monitoring Centre (UNEP-WCMC). Biodiversity Measures for Business: Corporate Biodiversity Measurement and Disclosure Within the Current and Future Global Policy Context (Cambridge: UNEP-WCMC, 2020).
Various instruments have been designed for specific contexts or industries and do not apply to all types of businesses. In the following, general biodiversity management tools, which can be used by a wide range of different businesses, are discussed. Table 3 provides an overview of additional biodiversity management tools, including those that are industry- or region-specific, as well as tools that are not directly related to biodiversity but can be adapted to its context.
| Tools and instruments | Description |
| Agrobiodiversity Index15Biodiversity International. Mainstreaming Agrobiodiversity in Sustainable Food Systems: Scientific Foundations for an Agrobiodiversity Index (Rome: Biodiversity International, 2017). | Assessment of risk in food and agriculture related to low agrobiodiversity, based on 33 indicators. |
| Biodiversity Audit16Schaltegger, S. & Beständig, U. Corporate Biodiversity Management Handbook (Berlin: BMU, 2010). | Checklist-based monitoring tool in the form of gap analysis. |
| Biological Diversity Protocol17Endangered Wildlife Trust. Biological Diversity Protocol (South Africa: National Biodiversity and Business Network, 2020). | Internal and external disclosure, non-financial accounting, and net biodiversity impacts. |
| Biodiversity Footprint Calculator18Plansup. Biodiversity Footprint Calculator http://www.plansup.nl/biodiversity-footprint-calculator/ (n.d.). | Calculation of a company’s biodiversity impact in its supply chain, production processes, and transport. |
| Biodiversity Footprints for Financial Institutions19Berger, J. et al. Common Ground in Biodiversity Footprint Methodologies for the Financial Sector https://ieeb.fundacion-biodiversidad.es/sites/default/files/common-ground-report-asn-bank.pdf (2018). | Biodiversity footprint calculation for economic activities that a financial institution invests in. |
| Biodiversity Impact Metric20University of Cambridge Institute for Sustainability Leadership (CISL). Measuring Business Impacts on Nature: A Framework to Support Better Stewardship of Biodiversity in Global Supply Chains (Cambridge: University of Cambridge Institute for Sustainability Leadership, 2020). | Impact assessment of a company’s activities related to raw material sourcing. |
| Biodiversity Indicators for Site-Based Impacts21UN Environment Programme World Conservation Monitoring Centre, Conservational International and Fauna & Flora International. Biodiversity Indicators for Site- based Impacts (Cambridge: UNEP-WCMC, 2020). | Mitigates extractive companies’ impacts on biodiversity. |
| Biodiversity Monitoring System for the Food Sector22European Business and Biodiversity Campaign (EBBC). Biodiversity Performance Tool and Monitoring System https://www.business-biodiversity.eu/en/biodiversity-performance-tool (n.d.). | Twenty-five indicators focused on supply-chain and site-level biodiversity impacts, related to drivers of biodiversity loss. |
| Biodiversity Net Gain Calculator 8Lammerant, J. et al. Assessment of Biodiversity Measurement Approaches for Businesses and Financial Institutions, Update Report 3 on Behalf of the EU Business @ Business Platform https://ec.europa.eu/environment/biodiversity/business/assets/pdf/EU%20B@B%20Platform%20Update%20Report%203_FINAL_1March2021.pdf (2021). | Metric built on extent, condition, and significance to gain insights into actual and potential biodiversity value of companies’ sites. |
| Biodiversity Offsets 2NABU, “The Biodiversity Imperative for Business Preserving the Foundations of Our Well-Being,” NABU-Bundesverband, Berlin, 2020. , 16Schaltegger, S. & Beständig, U. Corporate Biodiversity Management Handbook (Berlin: BMU, 2010). | (Monetary) compensation for unavoidable damage to biodiversity. |
| Biodiversity Performance Tool[22European Business and Biodiversity Campaign (EBBC). Biodiversity Performance Tool and Monitoring System https://www.business-biodiversity.eu/en/biodiversity-performance-tool (n.d.). | Seventy-eight indicators to develop action plans for farms to promote or preserve biodiversity. |
| Biodiversity SWOT16Schaltegger, S. & Beständig, U. Corporate Biodiversity Management Handbook (Berlin: BMU, 2010). | Assessment of company‘s strengths and weaknesses and opportunities by biodiversity, and threats resulting from biodiversity loss. |
| Biodiversity Indicator and Reporting System and ecosystem service assessment23International Union for Conservation of Nature (IUCN). Biodiversity Management in the Cement and Ag-gregates Sector: Biodiversity Indicator and Reporting System (BIRS) (Gland: IUCN, 2014b). | Biodiversity Indicator and Reporting System guides companies in the cement and aggregates sector for monitoring biodiversity at extraction sites. Ecosystem service assessment includes quantitative, qualitative, and monetized assessments. |
| Cooperation with environmental organizations16Schaltegger, S. & Beständig, U. Corporate Biodiversity Management Handbook (Berlin: BMU, 2010). | Use of networks and expertise of nature conservation organizations. |
| Corporate policies, codes of conduct, guidelines & instructions16Schaltegger, S. & Beständig, U. Corporate Biodiversity Management Handbook (Berlin: BMU, 2010). | Guidelines that influence behavior of employees or external actors by supplier agreements. |
| Corporate volunteering16Schaltegger, S. & Beständig, U. Corporate Biodiversity Management Handbook (Berlin: BMU, 2010). | Non-profit volunteering of employees in projects for nature conservation. |
| Environmental Impact Assessment16Schaltegger, S. & Beständig, U. Corporate Biodiversity Management Handbook (Berlin: BMU, 2010). | Identifies, predicts, and evaluates environmental impacts of projects. |
| Environmental Profit & Loss Account24Kering. What is an EP&L? https://www.kering.com/en/sustainability/measuring-our-impact/our-ep-l/what-is-an-ep-l/ (n.d.). | Measurement of carbon emissions, water consumption, air and water pollution, land use, and waste production along the supply chain that converts impacts in monetary values. |
| Global Biodiversity Score25Mission Économie de la Biodiversité & CDC Biodiversité. Global Biodiversity Score: A Tool to Establish and Measure Corporate and Financial Commitments for Biodiversity – 2018 Technical Update http://www.mission-economie-biodiversite.com/wp-content/uploads/2019/04/N14-GBS-2018-UPDATE-MD_FR.pdf (2019). | Overall depiction of biodiversity footprint, measured by mean species abundance. |
| Indicators and Key Ratios16Schaltegger, S. & Beständig, U. Corporate Biodiversity Management Handbook (Berlin: BMU, 2010). | Used for the analysis of business activities’ effect on biodiversity. |
| Integrated Biodiversity Assessment Tool 26International Union for Conservation of Nature (IUCN). Biodiversity for Business: A Guide to Using Knowledge Products Delivered Through IUCN (Gland: IUCN, 2014a) , 27World Business Council for Sustainable Development (WBCSD). Ecosystem Services and Biodiversity Tools to Support Business Decision-making https://www.wbcsd.org/contentwbc/download/567/6319/1 (2014). | Basic risk screening on biodiversity. The mapping tool helps decision makers access information on biodiversity impacts. |
| Labels16Schaltegger, S. & Beständig, U. Corporate Biodiversity Management Handbook (Berlin: BMU, 2010). | Introduction or acquisition of labels related to biodiversity affecting companies’ internal structures and processes. |
| LIFE Key28Lasting Initiative For Earth (LIFE). Management Software – LIFE Key https://institutolife.org/o-que-fazemos/software-de-gestao-life-key/?lang=en (n.d.). | Tool to support firms in identifying the impact on biodiversity and developing strategic plans to reduce, mitigate, and compensate for impacts. |
| Product Biodiversity Footprint29Product Biodiversity Footprint. Method: Overall Framework http://www.productbiodiversityfootprint.com/method/ (n.d.). | Quantifies the impact of a product on biodiversity (considering all life stages) and provides recommendations for change. |
| Product Chain-of-Custody certification16Schaltegger, S. & Beständig, U. Corporate Biodiversity Management Handbook (Berlin: BMU, 2010). | Transparent tracking of biodiversity impacts of raw materials from final product to original raw material. |
| ReCiPe20168Lammerant, J. et al. Assessment of Biodiversity Measurement Approaches for Businesses and Financial Institutions, Update Report 3 on Behalf of the EU Business @ Business Platform https://ec.europa.eu/environment/biodiversity/business/assets/pdf/EU%20B@B%20Platform%20Update%20Report%203_FINAL_1March2021.pdf (2021). | Method used in Life Cycle Impact Assessment, showing causal relationship between environmental intervention and potential impacts. |
| Species Threat Abatement and Recovery (STAR) metric30International Union for Conservation of Nature (IUCN). Species Threat Abatement and Recovery (STAR) Metric https://www.iucn.org/regions/washington-dc-office/our-work/species-threat-abatement-and-recovery-star-metric (n.d.). | Measurement of the contribution that investments make to reduce species extinction risk. Supports investors in making investments that help meet global targets. |
4.1 Global Biodiversity Score
The Global Biodiversity Score (GBS) was developed by the French public financial institution Caisse des Dépôts, which first had the idea for the score in 2015. The goal of the tool is to support companies in understanding and reducing their impact on biodiversity. In the GBS, the MSA approach is used to calculate a company’s biodiversity footprint. MSA is measured in MSA*km2 and describes the ratio between observed biodiversity and biodiversity in its pristine state. The unit is given in percentages, where 100% denotes an undisturbed pristine ecosystem. After the MSA is measured, stakeholders can build up indicators, such as KPIs, against which they can measure their performance.25Mission Économie de la Biodiversité & CDC Biodiversité. Global Biodiversity Score: A Tool to Establish and Measure Corporate and Financial Commitments for Biodiversity – 2018 Technical Update http://www.mission-economie-biodiversite.com/wp-content/uploads/2019/04/N14-GBS-2018-UPDATE-MD_FR.pdf (2019).
Currently, the GBS covers the following terrestrial and aquatic (freshwater) biodiversity im-pacts: land use, fragmentation of natural ecosystems, human encroachment, atmospheric nitrogen deposition, climate change, hydrological disturbance, wetland conversion, freshwa-ter eutrophication, land use in catchment, and ecotoxicity.31Schneider Electric & CDC Biodiversité. Assessing Biodiversity Footprint, the Occasion to Accelerate Corporate Biodiversity Strategy Schneider Electric Performs the First Ever End-to-end Biodiversity Footprint Assessment with the Global Biodiversity Score (GBS), a Tool Developed by CDC Biodiversité https://download.schneider-electric.com/files?p_File_Name=Schneider+Electric+Biodiversity+White+Paper+-+September+2020.pdf&p_Doc_Ref=WPBiodiversity&p_enDocType=White+Paper (2020). As a data source, peer-reviewed tools such as EXIOBASE or Globio are used. The GBS follows a hybrid approach, which means that in every step, the best data available is used. If the company cannot provide data for a certain step, industry and regional averages or turnover figures are used. Furthermore, the GBS differentiates between dynamic and static footprints. Dynamic footprints are caused by changes, consumption, or restorations, while static footprints illustrate the ecological opportunity cost of persistent pressures. Even if no new dynamic impacts occur, these persistent pressures are biodiversity impacts that prevent the return to an undisturbed state of biodiversity. An example is palm oil plantations, whose existence prevents the region from turning back to a natural tropical rainforest, and therefore makes it impossible to reach an MSA of 100%.25Mission Économie de la Biodiversité & CDC Biodiversité. Global Biodiversity Score: A Tool to Establish and Measure Corporate and Financial Commitments for Biodiversity – 2018 Technical Update http://www.mission-economie-biodiversite.com/wp-content/uploads/2019/04/N14-GBS-2018-UPDATE-MD_FR.pdf (2019).
An advantage of the GBS is that it aims to fill gaps of other already existing tools, such as through cooperation between CDC Biodiversité, ASN Bank, and ACTIAM, supported by Finance in Motion, aiming for convergence between GBS and the Biodiversity Footprint Financial Institutions tool to find a common ground for a methodology for financials. Further, it gives a comparatively complete overview of a company’s biodiversity impacts since it not only includes the company’s direct economic activities but also takes the value chain into account. However, there is the shortcoming that it currently only considers the upstream supply chain, apart from the direct operations. Nevertheless, in the long term, it is planned to cover the complete value chain within the calculations, including downstream impacts.25Mission Économie de la Biodiversité & CDC Biodiversité. Global Biodiversity Score: A Tool to Establish and Measure Corporate and Financial Commitments for Biodiversity – 2018 Technical Update http://www.mission-economie-biodiversite.com/wp-content/uploads/2019/04/N14-GBS-2018-UPDATE-MD_FR.pdf (2019).
Generally, biodiversity footprints, including the calculations from the GBS, are related to five different use categories: public policy, corporate (financial asset) portfolio, supply options, product or service, and project or site. A practical example of a company that uses the GBS for the supply option is Michelin. As a tire producer, Michelin is a major buyer of natural rubber, which is commonly produced in tropical and subtropical areas, where its production may have significant impacts on local biodiversity. Using the GBS tool, Michelin calculated the average biodiversity impact of one ton of natural rubber, depending on the country of origin. The results showed that the dynamic footprint of rubber cultivation is 136 times higher in the Democratic Republic of Congo than in Indonesia, which is mainly caused by differences in land use dynamics. Regarding the static footprint, the research also identified significant differences between countries that are correlated with production yield. This example illustrates the use of the GBS to inform decision makers to reduce the company’s impact on biodiversity.25Mission Économie de la Biodiversité & CDC Biodiversité. Global Biodiversity Score: A Tool to Establish and Measure Corporate and Financial Commitments for Biodiversity – 2018 Technical Update http://www.mission-economie-biodiversite.com/wp-content/uploads/2019/04/N14-GBS-2018-UPDATE-MD_FR.pdf (2019).
4.2 Biodiversity Impact Matrix (BIM)
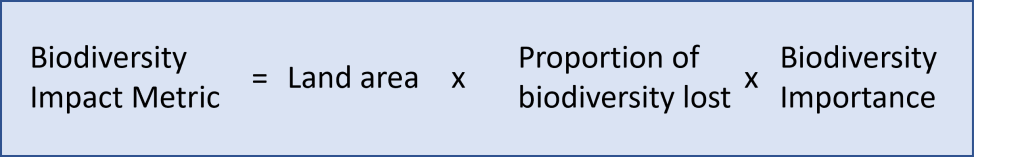
The Natural Capital Impact Group, convened by the University of Cambridge Institute of Sustainable Leadership (CISL) in collaboration with several business partners like Kering, Mars, and Primark, published the Biodiversity Impact Metric (BIM) in 2020 to provide companies with a risk screening tool for potential biodiversity impacts in agricultural production. The purpose of the BIM for companies is to identify their impact on nature through biodiversity loss that results from land and habitat transformation and the intensity of land use for their economic activities. This helps identify high-risk locations where the impact is most likely to threaten biodiversity. This information can be used to establish clear goals and targets for the development of strategies, which, in turn, can be aligned with global goals for nature and biodiversity. The assessment of companies’ biodiversity impact is based on 1. The land area needed to produce the commodity, 2. The proportion of biodiversity loss when land is transformed, and 3. The relative global importance of that type of biodiversity. The land area describes the hectares under production, where the land footprint plays a large role since the size of used land determines the potential for biodiversity loss. A possible problem is the limited visibility in a company’s supply chain. If a company cannot provide exact data on the number of hectares, data from a Food and Agriculture Organization of the United Nations database can be used to make estimations if no other reliable sources are available. The quantity impacted is given by the proportion of lost biodiversity throughout a firm’s production activities. Biodiversity importance represents the relative global importance of the biodiversity in the studied area, which is mainly based on species richness (number of different species) and uniqueness (rarity of these species). The calculation of the BIM is a multiplication of these three variables (see Figure 3). The output is measured in ‘weighted hectares’ (hectares weighted by biodiversity impact).20University of Cambridge Institute for Sustainability Leadership (CISL). Measuring Business Impacts on Nature: A Framework to Support Better Stewardship of Biodiversity in Global Supply Chains (Cambridge: University of Cambridge Institute for Sustainability Leadership, 2020).
The BIM works at all scales, ranging from small scales, such as farms, to larger scales, such as at the country level. The outcomes of the metric should be interpreted in a relative way, for example, to compare the impacts in two different regions to support decision making. There are three ways of intervention suggested for decision-making. First, the land area used could be reduced, either by reducing the quantity of raw materials, turning to alternatives, or increasing the yield on the existing agricultural ground. Second, the land use intensity could be reduced, or the type of land used changed. Third, the company could change the source location by choosing areas that are less important for biodiversity to source raw materials.20University of Cambridge Institute for Sustainability Leadership (CISL). Measuring Business Impacts on Nature: A Framework to Support Better Stewardship of Biodiversity in Global Supply Chains (Cambridge: University of Cambridge Institute for Sustainability Leadership, 2020).
The BIM can be integrated into a company’s biodiversity strategy, such as the eight-step plan for companies to develop a biodiversity strategy developed by the CISL, together with Kering and Biodiversify, into which the BIM can be easily incorporated.20University of Cambridge Institute for Sustainability Leadership (CISL). Measuring Business Impacts on Nature: A Framework to Support Better Stewardship of Biodiversity in Global Supply Chains (Cambridge: University of Cambridge Institute for Sustainability Leadership, 2020). A corporate example for the integration of the BIM into the overall biodiversity strategy is the French multinational corporation Kering, which specializes in luxury goods. It implemented the BIM across its supply chain and focused on biodiversity as a priority, especially in the cotton supply chain since cotton production can have severe impacts, such as water use, agrochemical input, and soil degradation. As recommended, Kering implemented the results from the BIM into its biodiversity strategy.32Kering. Biodiversity Strategy: Bending the Curve on Biodiversity Loss https://keringcorporate.dam.kering.com/m/6b254da158b2d217/original/Kering-Biodiversity-Strategy.pdf (n.d.) The outcomes of the analysis of the current state show that there is a higher biodiversity impact in India than in other sourcing locations. This finding can serve as a basis for managerial decision making, such as deciding to stop sourcing from high-risk regions and/or suppliers.20University of Cambridge Institute for Sustainability Leadership (CISL). Measuring Business Impacts on Nature: A Framework to Support Better Stewardship of Biodiversity in Global Supply Chains (Cambridge: University of Cambridge Institute for Sustainability Leadership, 2020).
A benefit of the BIM is that it can be implemented in a wide range of contexts. It supports businesses in disclosing their biodiversity impacts and helps them make decisions in a way that maximizes the benefits for business, the environment, and society. Nevertheless, there are some shortcomings in the methodology that need to be considered. For instance, the BIM does not assess when land transformation took place and the responsibilities for this. Furthermore, it does not analyze impacts on individual species; instead, it examines only the overall impact on biodiversity. The metric also does not consider any biodiversity protection efforts that are implemented on land that is outside the production area since it just includes impacts on land that is used for the company’s production.20University of Cambridge Institute for Sustainability Leadership (CISL). Measuring Business Impacts on Nature: A Framework to Support Better Stewardship of Biodiversity in Global Supply Chains (Cambridge: University of Cambridge Institute for Sustainability Leadership, 2020).
4.3 Biological Diversity Protocol
The Biological Diversity (BD) Protocol is the outcome of the Biodiversity Disclosure Project by the National Biodiversity and Business Network of South Africa and the Endangered Wildlife Trust, which collaborates with a wide range of stakeholders. It is not a tool for biodiversity management in the narrow sense; rather, it provides companies’ decision making with a framework for accounting for and reporting on biodiversity. Nevertheless, it is worth mentioning, as it gives guidance on how to identify, measure, and account for impacts on biodiversity by supporting companies in establishing a baseline dataset that helps to identify the impacts and areas of improvement. Further, it can be used to complement other tools for measuring biodiversity impacts.17Endangered Wildlife Trust. Biological Diversity Protocol (South Africa: National Biodiversity and Business Network, 2020).
Using the BD Protocol, companies need to establish a biodiversity impact inventory. First, they set their biodiversity impact inventory boundaries, which consist of organizational and value chain boundaries. Then, they defined the components of the inventory by determining material biodiversity impacts and segregating direct and indirect impacts. In the following, the BD Protocol provides guidance on impact measurement and accounting. It explains how to assess biodiversity impacts, where the nature of the biodiversity that is impacted needs to be defined, differentiating between ecosystem and taxa impacts. Further points include information on how to account for net changes in biodiversity. The Biodiversity Accounting Framework is used to create statements of biodiversity and position, taking the time perspective of biodiversity impacts into account. Finally, the biodiversity impact assessment needs to be validated or verified before a company discloses its biodiversity impacts in a coherent way.17Endangered Wildlife Trust. Biological Diversity Protocol (South Africa: National Biodiversity and Business Network, 2020).
The advantage of the BD Protocol is that it targets all types of organizations from all sectors to account for their impacts on various business applications. Thus, it can be used in a wide range of contexts and enables comparability between industries and companies. Further, it complements and supports other existing biodiversity impact measurement and accounting approaches, such as the Global Reporting Initiative Sustainability Reporting Standards (see Section 4.6). However, uncertainties when preparing a biodiversity impact inventory might occur, so assessing unbiased and consistent data for all parameters may be challenging, especially for large companies.17Endangered Wildlife Trust. Biological Diversity Protocol (South Africa: National Biodiversity and Business Network, 2020).
The Danish company Better Energy provides a practical example of how to make use of the BD Protocol with its Blangslev solar plant. The company implemented eight points of impact, grouped into ecosystem or use type, to improve biodiversity conditions. Following the steps of the protocol, they projected different stages (right after construction, after 5 years, and after 30 years) to compare them with the status before the construction of the solar plant, where the land had been used for conventional agriculture, including fertilizers and biocides. The projections show that through biodiversity initiatives like planting bushes and trees and sowing seeds right after construction, the company could already reach a Positive Biodiversity Footprint (PBF) of around 20% in the first stage.33Habitats. Measuring Biodiversity Improvements at Solar Plant in Blangslev (DK): Case Study for Better Energy’s Integration of Biodiversity Into a Newly Constructed Solar Plant Site, Using the Biological Diversity Protocol to Assess the Scale of Impact https://www.betterenergy.com/media/1701/be_blangslev_study_case_final.pdf (2020). The PBF is the sum of accumulated positive impacts on an ecosystem expressed in surface area equivalents (e.g., square meters or hectares). In turn, accumulated positive impacts are impacts on each biodiversity impact inventory feature of an organization.17Endangered Wildlife Trust. Biological Diversity Protocol (South Africa: National Biodiversity and Business Network, 2020). After 30 years, the projections show a PBF of 65%. This exemplifies the potential for a positive biodiversity impact for companies by engaging in biodiversity initiatives in their production sites.33Habitats. Measuring Biodiversity Improvements at Solar Plant in Blangslev (DK): Case Study for Better Energy’s Integration of Biodiversity Into a Newly Constructed Solar Plant Site, Using the Biological Diversity Protocol to Assess the Scale of Impact https://www.betterenergy.com/media/1701/be_blangslev_study_case_final.pdf (2020).
4.4 Integrated Biodiversity Assessment
The Integrated Biodiversity Assessment Tool (IBAT), published in 2005, was developed in the context of a partnership between the United Nations Environment Programme World Conservation Monitoring Centre, IUCN, Conservation International, and Birdlife International. The tool supports companies in integrating biodiversity considerations into their project planning and managerial decision making. It provides companies with access to ecological datasets like the IUCN Red List of Threatened Species, World Database on Protected Areas, and Key Biodiversity Areas, among others. It is a mapping tool with up-to-date data that facilitates rapid risk screening.26International Union for Conservation of Nature (IUCN). Biodiversity for Business: A Guide to Using Knowledge Products Delivered Through IUCN (Gland: IUCN, 2014a)27World Business Council for Sustainable Development (WBCSD). Ecosystem Services and Biodiversity Tools to Support Business Decision-making https://www.wbcsd.org/contentwbc/download/567/6319/1 (2014).
To adopt a biodiversity management system, Holcim, a cement supplier with around 500 extraction sites around the globe, used the IBAT to determine overlaps of the company’s sites with globally threatened species ranges (using The IUCN Red List of Threatened Species), protected areas (using The World Database on Protected Areas), and sites of global significance for biodiversity (using Key Biodiversity Areas). Managers of the most sensitive sites could seek external consultation from local experts to confirm the results. Based on the outcomes, an adequate level of management and biodiversity targets were determined.34International Union for Conservation of Nature (IUCN). Biodiversity for Business: A Guide to Using Knowledge Products Delivered Through IUCN (Gland: IUCN, 2014a).
An advantage of the IBAT is that it helps companies integrate biodiversity considerations into key project planning and decision making, as the Holcim case illustrated. However, it only provides an initial assessment that needs to be complemented by further literature reviews, spatial analyses, local expert advice, and stakeholder consultation.27World Business Council for Sustainable Development (WBCSD). Ecosystem Services and Biodiversity Tools to Support Business Decision-making https://www.wbcsd.org/contentwbc/download/567/6319/1 (2014).
4.5 Biodiversity offsets
Biodiversity offsets are a means for companies to compensate for damage to biodiversity that is unavoidable while conducting business activities. The goal is to avoid a net loss or even reach a net gain in biodiversity.16Schaltegger, S. & Beständig, U. Corporate Biodiversity Management Handbook (Berlin: BMU, 2010). Biodiversity offsetting can be a mandatory or voluntary means, depending on the national context, to compensate for unavoidable damage by funding restoration in another location. However, the mitigation hierarchy should be followed when a company decides to use biodiversity offsetting: 1. Avoid, 2. Reduce; 3. Restore locally and like-for-like, and 4. Offset elsewhere.2NABU, “The Biodiversity Imperative for Business Preserving the Foundations of Our Well-Being,” NABU-Bundesverband, Berlin, 2020.
The advantage of biodiversity offsets is that, at most, companies compensate for impacts that are not avoidable to reach no net loss of biodiversity and approach their environmental liabilities. Still, challenges might occur since it is difficult to quantify the impact on biodiversity in the first place. Additionally, it is challenging to account for biodiversity gains when conservation action is taking place at a different site than the one impacted.35European Initiative on Business & Biodiversity. Background Discussion Note for Workshop B: Business-related Biodiversity Assessments https://www.globalnature.org/bausteine.net/f/6641/Businessrelatedbiodiversityassessments.pdf?fd=2 (2007).
A corporate example of voluntary biodiversity offsets is the UK company Network Rail’s Thameslink Railway Project, which has the goal of constructing new railways over long distances. It thereby has a high potential for biodiversity impacts in different environments (the impact size was 2 hectares). Although the UK legislation had no legal requirements for biodiversity offsets, Network Railway engages in voluntary biodiversity offsets with an offset size of 8 hectares with the goal of creating new woodland in a nature reserve. The biodiversity outcomes showed a net gain in biodiversity, while the company followed the aforementioned mitigation hierarchy.36Darbi, M. Biodiversity Offsets Between Regulation and Voluntary Commitment: A Typology of Approaches Towards Environmental Compensation and No Net Loss of Biodiversity (Cham: Springer, 2020).
4.6 Global Reporting Initiative
The Global Reporting Initiative (GRI) developed the GRI Sustainability Reporting Standards, which can be voluntarily used by companies and other stakeholders to understand and report on their impacts on the economy, environment, and society. The three standardsGRI 101: Foundation, GRI 102: General Disclosures, and GRI 103: Management Approachare mandatory for all organizations that use the GRI Standards for sustainability reporting. Apart from these mandatory standards, a company needs to report on its material topics, choosing from a range of topic-specific GRI standards. There are three categories, 200 (economic topics), 300 (environmental topics), and 400 (social topics), which are designed to be used jointly with the mandatory GRI 103: Management Approach. As part of the environmental topics, GRI standard 304 is related to biodiversity and is used jointly with GRI 103 to report on the management approach related to biodiversity. There are four disclosures for GRI 304: Biodiversity, each containing reporting requirements, recommendations, and guidance. Disclosure 304-1 deals with “operational sites owned, leased, managed in, or adjacent to, protected areas and areas of high biodiversity value outside protected areas.”37Global Reporting Initiative (GRI). GRI 304: Biodiversity 2016 https://www.globalreporting.org/standards/media/1011/gri-304-biodiversity-2016.pdf (2018). Disclosure 304-2 focuses on “significant impacts of activities, products, and services on biodiversity.”37Global Reporting Initiative (GRI). GRI 304: Biodiversity 2016 https://www.globalreporting.org/standards/media/1011/gri-304-biodiversity-2016.pdf (2018). Disclosure 304-3 gives information about “habitats protected or restored,”37Global Reporting Initiative (GRI). GRI 304: Biodiversity 2016 https://www.globalreporting.org/standards/media/1011/gri-304-biodiversity-2016.pdf (2018).and Dis-closure 304-4 is about the IUCN Red List species and national conservation list species with habitats in areas affected by operations.”37Global Reporting Initiative (GRI). GRI 304: Biodiversity 2016 https://www.globalreporting.org/standards/media/1011/gri-304-biodiversity-2016.pdf (2018).
The benefit of the GRI is that it provides a consistent way for companies to communicate biodiversity activities on the corporate level to the external environment, and therefore supports them in setting up a sustainability report. The generalizability makes the results comparable, so a company’s performance can be, for example, compared over time.35European Initiative on Business & Biodiversity. Background Discussion Note for Workshop B: Business-related Biodiversity Assessments https://www.globalnature.org/bausteine.net/f/6641/Businessrelatedbiodiversityassessments.pdf?fd=2 (2007). On the other hand, reporting on biodiversity in the context of the GRI Standards is not mandatory; it depends on whether biodiversity is considered a material topic of a company.7UN Environment Programme World Conservation Monitoring Centre (UNEP-WCMC). Biodiversity Measures for Business: Corporate Biodiversity Measurement and Disclosure Within the Current and Future Global Policy Context (Cambridge: UNEP-WCMC, 2020). Even if companies report on biodiversity, the GRI does not capture whether companies achieve positive biodiversity outcomes.38Addison, P. et al. Bringing sustainability to life: A framework to guide biodiversity indicator development for business performance management. Business Strategy and The Environment, 29(8), 3303-3313 (2020). Further, it only displays biodiversity efforts externally but does not guide company-internal decision making.39Adler, R., Mansi, M. & Pandey, R. Biodiversity and threatened species reporting by the top Fortune Global companies. Accounting, Auditing & Accountability Journal 31(3), 787-825 (2018).
4.7 Biodiversity Intactness Index
The BII measures the abundance of a broad range of organisms in a certain geographic area, relative to a reference population. The organisms include all well researched, that includes plants and vertebrates, and excludes invertebrates and microbes. The population that existed in the terrain before to being altered by modern industrial society is an easily understood reference population for most of the world. If, as often the case, reliable data from pre-modern industrial society isn’t available, then contemporary populations in large, protected areas can be of useful guidance.
Calculating the BII is generally possible by aggregating population data for individual species. The exception to that rule are parts of the world that have high biodiversity but are poorly studied. After aggregating the population data, it is then investigated, how certain land use practices would affect the population sizes of groupings of ecologically related species. This is done via a special algorithm, that converts the data into a single number. The land use is in this case split into categories: protected, moderately used, degraded, cultivated, used as plantation and urban. Each of the land uses has a different effect on the biodiversity.
The goal for the BII is to give the general public and decisionmakers a clear overview over the biodiversity in their region and as a result to simplify decision making. A specialty of the BII is that it can be split in several ways to better fit the information needs of the user, i.e., into ecosystem units or by functional type.40Scholes, R., Biggs, R., A biodiversity intactness index, nature (2005).
5 Drivers and barriers of firm action
5.1 Barriers
5.1.1 Internal barriers
From an economic perspective, prevention activities might be very costly for firms.2NABU, “The Biodiversity Imperative for Business Preserving the Foundations of Our Well-Being,” NABU-Bundesverband, Berlin, 2020. Investing in preventive measures against biodiversity loss could even be prohibitive for high pollutive industries while having uncertain outcomes.41Houdet, J., Tommetter, M. & Weber, J. Changing Business Perceptions Regarding Biodiversity: From Impact Mitigation Towards New Strategies and Practices (Ecole Polytechnique Centre National de la Recherche Scientifique, 2009). It is problematic, however, that this cost-benefit calculation does not consider the societally and ecologically positive effects of preventive measures over the negative financial effects. As those positive externalities are not recognized by the market, they will not be part of a company’s profit and loss accounting.42Schiappacasse, I., Nahuelhual, L., Vásquez, F. & Echeverría, C. Assessing the benefits and costs of dryland forest restoration in central Chile. Journal of Environmental Management 97, 38-45 (2012). A cost-benefit analysis has shown that conservation of biodiversity has great value in terms of ecosystem services for the local communities as well as for the company.43Naidoo, R. & Ricketts, T. H. Mapping the Economic Costs and Benefits of Conservation. PLOS Biology 4(11), 2153-2164 (2006). Still, in the current market situation, the economic opportunity costs of biodiversity-friendly production are too large to make sustainable business more lucrative than, for example, mass crops.44Fisher, B. et al. Cost-effective conservation: calculating biodiversity and logging trade-offs in Southeast Asia. Conservation Letters 4, 443-450 (2011). When aiming for biodiversity conservation, firms might choose not to concentrate on the environmental improvement itself but more on their image improvement among their stakeholders. That is why communication with stakeholders about the preservative actions might be more important than the actions themselves.45Boiral, O. & Heras-Saizarbitorian, I. Corporate commitment to biodiversity in mining and forestry: Identifying drivers from GRI reports. Journal of Cleaner Production 162, 153-161 (2017).
Most companies lack the availability of information about biodiversity-protective activities. Neither do they have the expertise about how to collect appropriate data on their impact on biodiversity and the potential impacts of adverse activities.46Overbeek, G., Harms, B. & van den Burg, S. Biodiversity and the Corporate Social Responsibility Agenda. Journal of Sustainable Development 6(9), 1-11 (2013). Concrete practical suggestions on how to internalize biodiversity protection would be necessary.47Marsden, K. et al. Integration biologischer Vielfalt in CSR-Prozesse in der Tourismusindustrie (Berlin: adelphi, 2014). That is why the UN Environmental Programme provides the integrated biodiversity assessment tool with which companies can gather biodiversity-related data to conduct analyses themselves, either free of charge or with a premium account.48UNEP. Biodiversity Data for Business. What is IBAT? https://www.youtube.com/watch?v=YnpngcuoUDk (n.d.).
5.1.2 External barriers
From a political and legal perspective, there are still regulations and incentives, such as subsidies, that encourage companies to damage biodiversity for better returns. Thus, many OECD countries encourage the increasing production of environmentally sensitive industry sectors. Here, cost-reducing and revenue-enhancing measures are supported, which lead to an increasing use of possibly hazardous inputs like chemical fertilizers.49Lehmann, M. & ten Brink, P. Reforming Subsidies. In The Economics of Ecosystems and Biodiversity (TEEB) in National and International Policy Making – An output of TEEB (ed ten Brink, P.) 260-297 (London: Earthscan, 2011). Through offsetting, businesses are allowed to voluntarily compensate harmful actions against biodiversity with monetary payments.2NABU, “The Biodiversity Imperative for Business Preserving the Foundations of Our Well-Being,” NABU-Bundesverband, Berlin, 2020. If there are regulations favoring biodiversity protection, these were often developed through market incentives and collaborations within selfregulatory, non-binding approaches.45Boiral, O. & Heras-Saizarbitorian, I. Corporate commitment to biodiversity in mining and forestry: Identifying drivers from GRI reports. Journal of Cleaner Production 162, 153-161 (2017). Additionally, connected to the economic barriers, environmental standards and constraints concerning the exploitation of the ecosystem often require costly investments from companies and low return on investment (ROI). They might even require reduced production, which causes great financial pressure for companies.41Houdet, J., Tommetter, M. & Weber, J. Changing Business Perceptions Regarding Biodiversity: From Impact Mitigation Towards New Strategies and Practices (Ecole Polytechnique Centre National de la Recherche Scientifique, 2009). Through corporate governance, firms can conduct their own principles and guidelines to protect biodiversity. The Spanish energy company Iberdrola has implemented a biodiversity policy that goes beyond legal requirements by, for example, monitoring flora and fauna themselves and training professionals such as suppliers with their gained knowledge.49Lehmann, M. & ten Brink, P. Reforming Subsidies. In The Economics of Ecosystems and Biodiversity (TEEB) in National and International Policy Making – An output of TEEB (ed ten Brink, P.) 260-297 (London: Earthscan, 2011).
From the economic perspective, conflicts with stakeholders and investors about biodiversity protection may reduce the legitimacy and reputation of the firm and lower receivable investment payments.45Boiral, O. & Heras-Saizarbitorian, I. Corporate commitment to biodiversity in mining and forestry: Identifying drivers from GRI reports. Journal of Cleaner Production 162, 153-161 (2017). Deloitte, as a business consulting and service company, enhances their stakeholders’ conscience concerning biodiversity by offering annual events and workshops where they promote voluntary work in biodiversity protection and motivate their employees to use free spaces on the company’s premises to grow their own fruits and vegetables in a pollinator-friendly manner.50Hamilton, H., Reynolds, N. & McMahon, C. The Biodiversity Handbook for Business (Dublin: BITCI, 2019).
Companies in the primary industry sector, in particular, face serious concerns regarding the founding of new mandatory production standards and increasing competition around sustainability. They fear the complexity of certification systems and labelling as well as the duration and costs of the transition period when developing more biodiversity-friendly production processes.51Bishop, J., Kapila, S., Hicks, F., Mitchell, P. & Vorhies, F. New Business Models for Biodiversity Conservation. Journal of Sustainable Forestry 28, 285-303 (2009). The food company Danone has started its own label with which it certifies all products that originate from non-genetically modified agriculture to transparently disclose biodiversity action and help customers decide which agricultural model they want to support. Danone states that by that, it omits the official type of labelling but profits from the label and from gathering customer preference information.52Op2b. Case Studies https://op2b.org/wp-content/uploads/2019/09/OP2B_Case_Studies.pdf (2019).
Environmental ecosystem externalities might not always fall within the company’s sphere of control.45Boiral, O. & Heras-Saizarbitorian, I. Corporate commitment to biodiversity in mining and forestry: Identifying drivers from GRI reports. Journal of Cleaner Production 162, 153-161 (2017). Nevertheless, their influence can be larger than expected. Companies indeed have a limited sphere of control comprised of their direct actions, but their overall influence has a wider reach. They may influence their supply chains by deciding about their raw materials and end-of-life management. Even the system can be influenced by companies, such as with the governance through lobbying activities or the food system influenced by agricultural or marine activities.53Science-Based Targets for Nature. International Guidance for Business https://sciencebasedtargetsnetwork.org/wp-content/uploads/2020/09/SBTN-initial-guidance-for-business.pdf (2020). Furthermore, biodiversity is less easily measurable due to different ecological conditions in different regions of, for example, Co2 emissions. Thus, more effort is needed to set clear standards for corporate biodiversity protection.46Overbeek, G., Harms, B. & van den Burg, S. Biodiversity and the Corporate Social Responsibility Agenda. Journal of Sustainable Development 6(9), 1-11 (2013).
Until the advent of current scientific research on barriers to biodiversity protection, none could be identified from the technological or social dimensions.
5.2 Drivers
5.2.1 Internal drivers
From a market point of view, there are non-regulatory influences on biodiversity protection that encourage companies to engage in protective measures. Companies that act sustainably in biodiversity preservation might be granted access exclusively to important regions or favored by investors. It also helps them to recruit and retain employees because of better employee loyalty, which originates from employees having an improved self-identification with the company’s norms and values.51Bishop, J., Kapila, S., Hicks, F., Mitchell, P. & Vorhies, F. New Business Models for Biodiversity Conservation. Journal of Sustainable Forestry 28, 285-303 (2009). By addressing biodiversity, firms may exemplify corpo-rate best practice and address ethical concerns. They serve as a pioneer, leader, or a bench-mark.45Boiral, O. & Heras-Saizarbitorian, I. Corporate commitment to biodiversity in mining and forestry: Identifying drivers from GRI reports. Journal of Cleaner Production 162, 153-161 (2017). Furthermore, there is a positive correlation between revenue and environmental protection, which signals that a company with well-organized biodiversity management tends to have better overall management.54Bhattacharya, T. R. & Managi, S. Contributions of the private sector to global biodiversity protection: case study of the Fortune 500 companies. International Journal of Biodiversity Science, Ecosystem Services & Management 9(1), 65-86 (2013).
As mentioned in the first section, global supply chains rely heavily on biodiversity.2NABU, “The Biodiversity Imperative for Business Preserving the Foundations of Our Well-Being,” NABU-Bundesverband, Berlin, 2020.39Adler, R., Mansi, M. & Pandey, R. Biodiversity and threatened species reporting by the top Fortune Global companies. Accounting, Auditing & Accountability Journal 31(3), 787-825 (2018). They have a two-way relationship, as biodiversity is a critical business factor of a company’s survival55Hasan, A. M., Roberts, L. & Atkins, J. Exploring factors relating to extinction disclosures: What motivates companies to report on biodiversity and species protection? Business Strategy Environment 29, 1419-1436 (2019). but those environmental benefits of ecosystems are no longer granted due to biodiversity loss.51Bishop, J., Kapila, S., Hicks, F., Mitchell, P. & Vorhies, F. New Business Models for Biodiversity Conservation. Journal of Sustainable Forestry 28, 285-303 (2009). This is why businesses are motivated to protect biodiversity for the sake of their own economic resilience as successively more customers demand protective actions and voluntary commitments.2NABU, “The Biodiversity Imperative for Business Preserving the Foundations of Our Well-Being,” NABU-Bundesverband, Berlin, 2020.51Bishop, J., Kapila, S., Hicks, F., Mitchell, P. & Vorhies, F. New Business Models for Biodiversity Conservation. Journal of Sustainable Forestry 28, 285-303 (2009). The increased awareness of biodiversity that was initiated by scholars and the media56Boiral, O. & Heras-Saizarbitorian, I. Corporate commitment to biodiversity in mining and forestry: Identi-fying drivers from GRI reports. Journal of Cleaner Production 162, 153-161 (2017). nudges consumers into more conscious decisions and the demand for ecologically friendly products is on the rise.2NABU, “The Biodiversity Imperative for Business Preserving the Foundations of Our Well-Being,” NABU-Bundesverband, Berlin, 2020. In order to fulfill this demand, companies are required to demonstratively reduce their impacts on biodiversity.45Boiral, O. & Heras-Saizarbitorian, I. Corporate commitment to biodiversity in mining and forestry: Identifying drivers from GRI reports. Journal of Cleaner Production 162, 153-161 (2017). By doing so, firms receive a competitive advantage and distinguish themselves from their competitors,51Bishop, J., Kapila, S., Hicks, F., Mitchell, P. & Vorhies, F. New Business Models for Biodiversity Conservation. Journal of Sustainable Forestry 28, 285-303 (2009). which in the end enhances their ROI.2NABU, “The Biodiversity Imperative for Business Preserving the Foundations of Our Well-Being,” NABU-Bundesverband, Berlin, 2020.45Boiral, O. & Heras-Saizarbitorian, I. Corporate commitment to biodiversity in mining and forestry: Identifying drivers from GRI reports. Journal of Cleaner Production 162, 153-161 (2017). A key factor is that the biodiversity protective actions are publicly seen through, for example, ecolabelling, which is moving from a niche to the mainstream economy.57 The baby food company HiPP labels itself as a consumer of sustainable and ecological agriculture, which, according to their reports, adds value to their products and improves the consumers’ satisfaction.16Schaltegger, S. & Beständig, U. Corporate Biodiversity Management Handbook (Berlin: BMU, 2010). But it is not only consumers who are demanding a reduction in environmental impacts. Other stakeholders, like investors, are also changing their attitudes concerning the importance of biodiversity.41Houdet, J., Tommetter, M. & Weber, J. Changing Business Perceptions Regarding Biodiversity: From Impact Mitigation Towards New Strategies and Practices (Ecole Polytechnique Centre National de la Recherche Scientifique, 2009). Protective measures may contribute to cooperative exchange and improve corporate social legitimacy.45Boiral, O. & Heras-Saizarbitorian, I. Corporate commitment to biodiversity in mining and forestry: Identifying drivers from GRI reports. Journal of Cleaner Production 162, 153-161 (2017). HeidelbergCement AG communicates openly with its stakeholders, like NGOs or local municipalities, and thereby avoids high administrative costs and enhances its societal reputation.16Schaltegger, S. & Beständig, U. Corporate Biodiversity Management Handbook (Berlin: BMU, 2010).
Firms may directly benefit from protective measures in biodiversity loss by protecting themselves from physical risks.2NABU, “The Biodiversity Imperative for Business Preserving the Foundations of Our Well-Being,” NABU-Bundesverband, Berlin, 2020. Negative impacts on their business activities can be less water quality, raw material constraints, higher production costs, lower production quality, soil contamination, or pesticide overshoot.54Bhattacharya, T. R. & Managi, S. Contributions of the private sector to global biodiversity protection: case study of the Fortune 500 companies. International Journal of Biodiversity Science, Ecosystem Services & Management 9(1), 65-86 (2013). Rescue programs for damaged ecosystems are immensely costly and threaten companies’ economic sustainability. This is why precautionary biodiversity actions may prevent firms from experiencing future economic losses. Especially in sectors such as tourism or fishery, which rely on biodiversity, preservative actions contribute to the long-term survival of the affected firms.45Boiral, O. & Heras-Saizarbitorian, I. Corporate commitment to biodiversity in mining and forestry: Identifying drivers from GRI reports. Journal of Cleaner Production 162, 153-161 (2017).54Bhattacharya, T. R. & Managi, S. Contributions of the private sector to global biodiversity protection: case study of the Fortune 500 companies. International Journal of Biodiversity Science, Ecosystem Services & Management 9(1), 65-86 (2013). Corrective actions are usually more costly than preventive ones, which makes it economically and environmentally attractive to use the advantage of preventive actions.41Houdet, J., Tommetter, M. & Weber, J. Changing Business Perceptions Regarding Biodiversity: From Impact Mitigation Towards New Strategies and Practices (Ecole Polytechnique Centre National de la Recherche Scientifique, 2009). Mars, for example, built its business based on sensitive cocoa plants that need insects for pollination and other plants for shadow. That is why they aim to extract 100% of their raw materials from sustainable production.16Schaltegger, S. & Beständig, U. Corporate Biodiversity Management Handbook (Berlin: BMU, 2010). Unilever, as another example, works on the use of cover crops in their US soy production that help keep nutrients in the ground and lower soil erosion.57Mehta, A. It’s Not Enough to Cut CO2 Emissions. The Natural Systems that Sustain Life are on the Critical List https://www.reutersevents.com/sustainability/its-not-enough-cut-co2-emissions-natural-systems-sustain-life-are-critical-list (2020). Additionally, it is not only prevention from economic disasters or enhanced corporate resilience that make preventive measures profitable. Evidence has shown that changing processes for the sake of sustainability often leads to optimization, such as in raw material usage. The application of closed loops reduces raw material needs within the process2NABU, “The Biodiversity Imperative for Business Preserving the Foundations of Our Well-Being,” NABU-Bundesverband, Berlin, 2020. and the reduction of energy consumption reduces overall energy costs.41Houdet, J., Tommetter, M. & Weber, J. Changing Business Perceptions Regarding Biodiversity: From Impact Mitigation Towards New Strategies and Practices (Ecole Polytechnique Centre National de la Recherche Scientifique, 2009). The German publisher Axel Springer, for example, has advanced biodiversity on its business premises and sees less costs for the maintenance of the area.16Schaltegger, S. & Beständig, U. Corporate Biodiversity Management Handbook (Berlin: BMU, 2010). Changing processes to protect biodiversity also protects firms themselves from economic problems through lawsuits or fines.45Boiral, O. & Heras-Saizarbitorian, I. Corporate commitment to biodiversity in mining and forestry: Identifying drivers from GRI reports. Journal of Cleaner Production 162, 153-161 (2017).
In recent decades, new technologies and innovations have emerged that make it more attractive and profitable for companies to engage in biodiversity conservation. First, they may help identify the affected ecosystem through satellites or other non-invasive approaches. Thus, the databases for information on biodiversity have been vastly expanded.58Pimm, S. L et al. Emerging Technologies to Conserve Biodiversity. Trends in Ecology & Evolution 30(11), 685-696 (2015).
In the social dimension, stakeholder management, especially within local communities, has a huge impact on businesses. This is why it is important to involve them and reduce external pressure. By doing so, companies can benefit from knowledge sharing and avoid conflicts.58Pimm, S. L et al. Emerging Technologies to Conserve Biodiversity. Trends in Ecology & Evolution 30(11), 685-696 (2015). Companies have additional motivations to promote stakeholder involvement; the knowledge of local communities and indigenous peoples about their ecosystems in combination with scientific knowledge can be a key factor in identifying and protecting biodiversity.54Bhattacharya, T. R. & Managi, S. Contributions of the private sector to global biodiversity protection: case study of the Fortune 500 companies. International Journal of Biodiversity Science, Ecosystem Services & Management 9(1), 65-86 (2013). By involving policy stakeholders and cooperating, companies might reduce regulatory pressure and constraints.59Boiral, O. & Heras-Saizarbitoria, I. Managing Biodiversity Through Stakeholder Involvement: Why, Who, and for What Initiatives? Journal of Business Ethics 140, 403-421 (2017). Biodiversity projects provide firms with a source of exchange with stake-holders, obtaining social permission and being beneficial for local communities, such as through job creation or social development.45Boiral, O. & Heras-Saizarbitorian, I. Corporate commitment to biodiversity in mining and forestry: Identifying drivers from GRI reports. Journal of Cleaner Production 162, 153-161 (2017). The Japanese enterprise Mitsui Sumitomo Insurance supports projects to remediate the forests in Indonesia. Through these projects, they not only help to preserve this ecosystem but also create jobs for local communities.16Schaltegger, S. & Beständig, U. Corporate Biodiversity Management Handbook (Berlin: BMU, 2010). The legitimacy and social responsiveness of the company improve, which again prevents conflicts with customers and organizations like NGOs and enhances the acceptability of operations.59Boiral, O. & Heras-Saizarbitoria, I. Managing Biodiversity Through Stakeholder Involvement: Why, Who, and for What Initiatives? Journal of Business Ethics 140, 403-421 (2017).
5.2.2 External drivers
Political drivers are concerned with both binding regulations imposed by national governments and non-binding regulations, such as initiatives, campaigns, or other voluntary regulations. Starting with the binding regulations, each national law is in charge of imposing its own standards of biodiversity conservation. However, they may orient themselves to international or multinational conventions and plans in which participating member states have decided on goals. These goals need to be achieved at a certain time by the member states. The most important multinational organization concerning biodiversity is the Convention on Biological Diversity, which has the target of protecting biodiversity, creating more sustainable resource usage, and conducting access and benefit sharing.60Conference of the Parties to the Convention on Biological Diversity (2014). Decision XII/10. Business En-gagement. Pyeongchang: UNEP. https://www.cbd.int/doc/decisions/cop-12/cop-12-dec-10-en.pdf, accessed 12th August 2021. Although their measures, like the Aichi Targets (from which, for example, Target 7 concerns the conservation and sustainable management of agriculture, aquaculture, and forestry)61Bebbington, J. & Unerman, J. Achieving the United Nations Sustainable Development Goals – An enabling role for accounting research. Accounting, Auditing & Accountability Journal 31(1), 2-24 (2018). or the UN’s 2030 Agenda Sustainable Development Goals,7UN Environment Programme World Conservation Monitoring Centre (UNEP-WCMC). Biodiversity Measures for Business: Corporate Biodiversity Measurement and Disclosure Within the Current and Future Global Policy Context (Cambridge: UNEP-WCMC, 2020). do not explicitly affect or address companies, they raise awareness of ecosystem risks and develop common standards for investors and stakeholders.51Bishop, J., Kapila, S., Hicks, F., Mitchell, P. & Vorhies, F. New Business Models for Biodiversity Conservation. Journal of Sustainable Forestry 28, 285-303 (2009). These increasing regulatory and societal pressures cannot be ignored by companies in the long term because they would risk losing their legitimacy or even their licenses.41Houdet, J., Tommetter, M. & Weber, J. Changing Business Perceptions Regarding Biodiversity: From Impact Mitigation Towards New Strategies and Practices (Ecole Polytechnique Centre National de la Recherche Scientifique, 2009). Fur-thermore, evidence has shown that considering the danger of prohibitions or caps on certain hazardous actions or substances might be reasonable to adjust beforehand.2NABU, “The Biodiversity Imperative for Business Preserving the Foundations of Our Well-Being,” NABU-Bundesverband, Berlin, 2020. Defining a company’s path to more biodiversity protection before it is forced to enables them to design and manage changes more independently and flexibly, pay more attention to consumers’ needs and innovate to reduce costs.62Bishop, J., Kapila, S., Hicks, F., Mitchell, P. & Vorhies, F. New Business Models for Biodiversity Conser-vation. Journal of Sustainable Forestry 28, 285-303 (2009).
Non-binding approaches include, for example, the Initiative One Planet Business for Biodiversity, where 20 international companies from different industries have joined to preserve biodiversity in the specific sector of agriculture. The Business for Nature Initiative, in contrast, helps companies to work with NGOs to influence the policymaking process and consider the environment in economic decisions.2NABU, “The Biodiversity Imperative for Business Preserving the Foundations of Our Well-Being,” NABU-Bundesverband, Berlin, 2020. Companies that are actively involved in the decision-making process may have the chance to influence politicians and coin new regulations to their advantage. The same is true for firms that actively support innovation processes and scholarly research.
Other voluntary regulations and certifiable standards are, for example, the ISO 14001:2015 or the EU EcoManagement and Audit Scheme (EMAS III), which include the preservation of biodiversity as the main topic.45Boiral, O. & Heras-Saizarbitorian, I. Corporate commitment to biodiversity in mining and forestry: Identifying drivers from GRI reports. Journal of Cleaner Production 162, 153-161 (2017). Certification programs drive biodiversity protection among firms as they symbolize a unique selling point (USP) and provide a competitive advantage.63Rainey, H. J., Pollard, E. H. B., Dutson, G., Ekstorm, J. M. M., Livingstone S. R., Temple, H. J. & Pilgrim, J. D. A review of corporate goals of No Net Loss and Net Positive Impact on biodiversity. Oryx 49(2), 232-238 (2014). Another approach of earning a USP is to report about the biodiversity footprint. This, in fact, becomes successively mandatory among nations. Methods for measuring firms’ influence on biodiversity have also become successively diverse and accurate, which, in combination with reporting, makes the biodiversity footprint of certain firms more visible and tangible for stakeholders.7UN Environment Programme World Conservation Monitoring Centre (UNEP-WCMC). Biodiversity Measures for Business: Corporate Biodiversity Measurement and Disclosure Within the Current and Future Global Policy Context (Cambridge: UNEP-WCMC, 2020).
Companies have a social responsibility to protect the ecosystems in which they operate. Biodiversity has served humankind with food production. In particular, fruits requiring pollination need animals and insects to serve them. Furthermore, about 70% of all cancer drugs are based on natural mechanisms, and 4 billion people use natural medicine or genetic resources for their healthcare.2NABU, “The Biodiversity Imperative for Business Preserving the Foundations of Our Well-Being,” NABU-Bundesverband, Berlin, 2020. Additionally, local communities may suffer from health problems in-duced by a degraded local environment.54Bhattacharya, T. R. & Managi, S. Contributions of the private sector to global biodiversity protection: case study of the Fortune 500 companies. International Journal of Biodiversity Science, Ecosystem Services & Management 9(1), 65-86 (2013). It would even be arguable that high restrictions within ecologically sensitive regions affect firms within their locations choice, as they fear vast requirements concerning their processes.45Boiral, O. & Heras-Saizarbitorian, I. Corporate commitment to biodiversity in mining and forestry: Identifying drivers from GRI reports. Journal of Cleaner Production 162, 153-161 (2017). Companies see themselves in a situation of pressure, as especially natural extraction, construction, and production are the most important factors to exacerbate biodiversity loss. It is said that they are responsible for 60% of the occurring destructions.2NABU, “The Biodiversity Imperative for Business Preserving the Foundations of Our Well-Being,” NABU-Bundesverband, Berlin, 2020. This imposes societal pressure and makes firms vulnerable to bad publicity.
Until this point, no drivers of the ecological dimension have been scientifically identified.
References
- 1World Health Organization. Biodiversity. WHO https://www.who.int/news-room/fact-sheets/detail/biodiversity (2025). [Accessed on 15.09.2025]
- 2NABU, “The Biodiversity Imperative for Business Preserving the Foundations of Our Well-Being,” NABU-Bundesverband, Berlin, 2020.
- 3IPBES. Global Assessment Report of the Intergovernmental Science-Policy Platform on Biodiversity and Ecosystem Services (Bonn: IPBES secretariat, 2019).
- 4IPBES. Glossary. Biodiversity Loss https://ipbes.net/glossary/biodiversity-loss#:~:text=The%20reduction%20of%20any%20aspect,extinctions%2C%20resulting%20in%20decreased%20total (2020).
- 5United Nations (n.d.). Biodiversity and ecosystems. https://sustainabledevelopment.un.org/topics/biodiversityandecosystems.
- 6European Commission (2021). EU Biodiversity Strategy for 2030. Bringing nature back into our lives. https://op.europa.eu/de/publication-detail/-/publication/31e4609f-b91e-11eb-8aca-01aa75ed71a1.
- 7UN Environment Programme World Conservation Monitoring Centre (UNEP-WCMC). Biodiversity Measures for Business: Corporate Biodiversity Measurement and Disclosure Within the Current and Future Global Policy Context (Cambridge: UNEP-WCMC, 2020).
- 8Lammerant, J. et al. Assessment of Biodiversity Measurement Approaches for Businesses and Financial Institutions, Update Report 3 on Behalf of the EU Business @ Business Platform https://ec.europa.eu/environment/biodiversity/business/assets/pdf/EU%20B@B%20Platform%20Update%20Report%203_FINAL_1March2021.pdf (2021).
- 9IPBES, « Global Assessment Report of the Intergovernmental Science-Policy Platform on Biodiversity and Ecosystem Services,» IPBES secretariat, Bonn, 2019.
- 10UN Environment Programme World Conservation Monitoring Centre (UNEP-WCMC), ” Biodiversity Measures for Business: Corporate Biodiversity Measurement and Disclosure Within the Current and Future Global Policy Context,” UNEP-WCMC, Cambridge, 2020.
- 11Kurth et. al. (2020) The Biodiversity Imperative for Business. Preserving the Foundations of Our Well-Being. NABU- Bundesverband. Berlin
- 12Boston Consulting Group. The Biodiversity Crisis Is a Business Crisis. https://www.bcg.com/publications/2021/biodiversity-loss-business-implications-responses (Boston: Boston Consulting Group, 2021).
- 13Union for Ethical BioTrade. UEBT Biodiversity Barometer 2020 https://static1.squarespace.com/static/577e0feae4fcb502316dc547/t/5faba5647c9a080d1659515b/1605084543908/UEBT+Biodiversity+Barometer+2020.pdf (2020).
- 14Conference of the Parties to the Convention on Biological Diversity. Decision XII/10. Business Engagement (Pyeongchang: UNEP, 2014).
- 15Biodiversity International. Mainstreaming Agrobiodiversity in Sustainable Food Systems: Scientific Foundations for an Agrobiodiversity Index (Rome: Biodiversity International, 2017).
- 16Schaltegger, S. & Beständig, U. Corporate Biodiversity Management Handbook (Berlin: BMU, 2010).
- 17Endangered Wildlife Trust. Biological Diversity Protocol (South Africa: National Biodiversity and Business Network, 2020).
- 18Plansup. Biodiversity Footprint Calculator http://www.plansup.nl/biodiversity-footprint-calculator/ (n.d.).
- 19Berger, J. et al. Common Ground in Biodiversity Footprint Methodologies for the Financial Sector https://ieeb.fundacion-biodiversidad.es/sites/default/files/common-ground-report-asn-bank.pdf (2018).
- 20University of Cambridge Institute for Sustainability Leadership (CISL). Measuring Business Impacts on Nature: A Framework to Support Better Stewardship of Biodiversity in Global Supply Chains (Cambridge: University of Cambridge Institute for Sustainability Leadership, 2020).
- 21UN Environment Programme World Conservation Monitoring Centre, Conservational International and Fauna & Flora International. Biodiversity Indicators for Site- based Impacts (Cambridge: UNEP-WCMC, 2020).
- 22European Business and Biodiversity Campaign (EBBC). Biodiversity Performance Tool and Monitoring System https://www.business-biodiversity.eu/en/biodiversity-performance-tool (n.d.).
- 23International Union for Conservation of Nature (IUCN). Biodiversity Management in the Cement and Ag-gregates Sector: Biodiversity Indicator and Reporting System (BIRS) (Gland: IUCN, 2014b).
- 24Kering. What is an EP&L? https://www.kering.com/en/sustainability/measuring-our-impact/our-ep-l/what-is-an-ep-l/ (n.d.).
- 25Mission Économie de la Biodiversité & CDC Biodiversité. Global Biodiversity Score: A Tool to Establish and Measure Corporate and Financial Commitments for Biodiversity – 2018 Technical Update http://www.mission-economie-biodiversite.com/wp-content/uploads/2019/04/N14-GBS-2018-UPDATE-MD_FR.pdf (2019).
- 26International Union for Conservation of Nature (IUCN). Biodiversity for Business: A Guide to Using Knowledge Products Delivered Through IUCN (Gland: IUCN, 2014a)
- 27World Business Council for Sustainable Development (WBCSD). Ecosystem Services and Biodiversity Tools to Support Business Decision-making https://www.wbcsd.org/contentwbc/download/567/6319/1 (2014).
- 28Lasting Initiative For Earth (LIFE). Management Software – LIFE Key https://institutolife.org/o-que-fazemos/software-de-gestao-life-key/?lang=en (n.d.).
- 29Product Biodiversity Footprint. Method: Overall Framework http://www.productbiodiversityfootprint.com/method/ (n.d.).
- 30International Union for Conservation of Nature (IUCN). Species Threat Abatement and Recovery (STAR) Metric https://www.iucn.org/regions/washington-dc-office/our-work/species-threat-abatement-and-recovery-star-metric (n.d.).
- 31Schneider Electric & CDC Biodiversité. Assessing Biodiversity Footprint, the Occasion to Accelerate Corporate Biodiversity Strategy Schneider Electric Performs the First Ever End-to-end Biodiversity Footprint Assessment with the Global Biodiversity Score (GBS), a Tool Developed by CDC Biodiversité https://download.schneider-electric.com/files?p_File_Name=Schneider+Electric+Biodiversity+White+Paper+-+September+2020.pdf&p_Doc_Ref=WPBiodiversity&p_enDocType=White+Paper (2020).
- 32Kering. Biodiversity Strategy: Bending the Curve on Biodiversity Loss https://keringcorporate.dam.kering.com/m/6b254da158b2d217/original/Kering-Biodiversity-Strategy.pdf (n.d.)
- 33Habitats. Measuring Biodiversity Improvements at Solar Plant in Blangslev (DK): Case Study for Better Energy’s Integration of Biodiversity Into a Newly Constructed Solar Plant Site, Using the Biological Diversity Protocol to Assess the Scale of Impact https://www.betterenergy.com/media/1701/be_blangslev_study_case_final.pdf (2020).
- 34International Union for Conservation of Nature (IUCN). Biodiversity for Business: A Guide to Using Knowledge Products Delivered Through IUCN (Gland: IUCN, 2014a).
- 35European Initiative on Business & Biodiversity. Background Discussion Note for Workshop B: Business-related Biodiversity Assessments https://www.globalnature.org/bausteine.net/f/6641/Businessrelatedbiodiversityassessments.pdf?fd=2 (2007).
- 36Darbi, M. Biodiversity Offsets Between Regulation and Voluntary Commitment: A Typology of Approaches Towards Environmental Compensation and No Net Loss of Biodiversity (Cham: Springer, 2020).
- 37Global Reporting Initiative (GRI). GRI 304: Biodiversity 2016 https://www.globalreporting.org/standards/media/1011/gri-304-biodiversity-2016.pdf (2018).
- 38Addison, P. et al. Bringing sustainability to life: A framework to guide biodiversity indicator development for business performance management. Business Strategy and The Environment, 29(8), 3303-3313 (2020).
- 39Adler, R., Mansi, M. & Pandey, R. Biodiversity and threatened species reporting by the top Fortune Global companies. Accounting, Auditing & Accountability Journal 31(3), 787-825 (2018).
- 40Scholes, R., Biggs, R., A biodiversity intactness index, nature (2005).
- 41Houdet, J., Tommetter, M. & Weber, J. Changing Business Perceptions Regarding Biodiversity: From Impact Mitigation Towards New Strategies and Practices (Ecole Polytechnique Centre National de la Recherche Scientifique, 2009).
- 42Schiappacasse, I., Nahuelhual, L., Vásquez, F. & Echeverría, C. Assessing the benefits and costs of dryland forest restoration in central Chile. Journal of Environmental Management 97, 38-45 (2012).
- 43Naidoo, R. & Ricketts, T. H. Mapping the Economic Costs and Benefits of Conservation. PLOS Biology 4(11), 2153-2164 (2006).
- 44Fisher, B. et al. Cost-effective conservation: calculating biodiversity and logging trade-offs in Southeast Asia. Conservation Letters 4, 443-450 (2011).
- 45Boiral, O. & Heras-Saizarbitorian, I. Corporate commitment to biodiversity in mining and forestry: Identifying drivers from GRI reports. Journal of Cleaner Production 162, 153-161 (2017).
- 46Overbeek, G., Harms, B. & van den Burg, S. Biodiversity and the Corporate Social Responsibility Agenda. Journal of Sustainable Development 6(9), 1-11 (2013).
- 47Marsden, K. et al. Integration biologischer Vielfalt in CSR-Prozesse in der Tourismusindustrie (Berlin: adelphi, 2014).
- 48UNEP. Biodiversity Data for Business. What is IBAT? https://www.youtube.com/watch?v=YnpngcuoUDk (n.d.).
- 49Lehmann, M. & ten Brink, P. Reforming Subsidies. In The Economics of Ecosystems and Biodiversity (TEEB) in National and International Policy Making – An output of TEEB (ed ten Brink, P.) 260-297 (London: Earthscan, 2011).
- 50Hamilton, H., Reynolds, N. & McMahon, C. The Biodiversity Handbook for Business (Dublin: BITCI, 2019).
- 51Bishop, J., Kapila, S., Hicks, F., Mitchell, P. & Vorhies, F. New Business Models for Biodiversity Conservation. Journal of Sustainable Forestry 28, 285-303 (2009).
- 52Op2b. Case Studies https://op2b.org/wp-content/uploads/2019/09/OP2B_Case_Studies.pdf (2019).
- 53Science-Based Targets for Nature. International Guidance for Business https://sciencebasedtargetsnetwork.org/wp-content/uploads/2020/09/SBTN-initial-guidance-for-business.pdf (2020).
- 54Bhattacharya, T. R. & Managi, S. Contributions of the private sector to global biodiversity protection: case study of the Fortune 500 companies. International Journal of Biodiversity Science, Ecosystem Services & Management 9(1), 65-86 (2013).
- 55Hasan, A. M., Roberts, L. & Atkins, J. Exploring factors relating to extinction disclosures: What motivates companies to report on biodiversity and species protection? Business Strategy Environment 29, 1419-1436 (2019).
- 56Boiral, O. & Heras-Saizarbitorian, I. Corporate commitment to biodiversity in mining and forestry: Identi-fying drivers from GRI reports. Journal of Cleaner Production 162, 153-161 (2017).
- 57Mehta, A. It’s Not Enough to Cut CO2 Emissions. The Natural Systems that Sustain Life are on the Critical List https://www.reutersevents.com/sustainability/its-not-enough-cut-co2-emissions-natural-systems-sustain-life-are-critical-list (2020).
- 58Pimm, S. L et al. Emerging Technologies to Conserve Biodiversity. Trends in Ecology & Evolution 30(11), 685-696 (2015).
- 59Boiral, O. & Heras-Saizarbitoria, I. Managing Biodiversity Through Stakeholder Involvement: Why, Who, and for What Initiatives? Journal of Business Ethics 140, 403-421 (2017).
- 60Conference of the Parties to the Convention on Biological Diversity (2014). Decision XII/10. Business En-gagement. Pyeongchang: UNEP. https://www.cbd.int/doc/decisions/cop-12/cop-12-dec-10-en.pdf, accessed 12th August 2021.
- 61Bebbington, J. & Unerman, J. Achieving the United Nations Sustainable Development Goals – An enabling role for accounting research. Accounting, Auditing & Accountability Journal 31(1), 2-24 (2018).
- 62Bishop, J., Kapila, S., Hicks, F., Mitchell, P. & Vorhies, F. New Business Models for Biodiversity Conser-vation. Journal of Sustainable Forestry 28, 285-303 (2009).
- 63Rainey, H. J., Pollard, E. H. B., Dutson, G., Ekstorm, J. M. M., Livingstone S. R., Temple, H. J. & Pilgrim, J. D. A review of corporate goals of No Net Loss and Net Positive Impact on biodiversity. Oryx 49(2), 232-238 (2014).