Author: Ulrik Schimkus, April, 2025
1 Introduction
Resource scarcity, rising emissions and temperatures, climate disasters and the ever-increasing effects of climate change are developments that need to be mitigated. It is therefore crucial that every sector, every policy and, ultimately, every part of society and the economy takes responsibility and takes the initiative. Sustainability development can be realized and implemented through various ways in the information and technology (IT) sector. It is important to determine which effects influence the economy and environment, whether the negative impact of production and use of technologies can be offset or even exceeded by substitution effects or optimization, which has positive influence. It is also important to investigate which technologies, and potential could lead to a greener business, economy and environment. The research question of this thesis thus refers to the investigation of the extent to which sustainability is implemented in the IT industry, which strategies and technologies are used to achieve more sustainable structures, processes and outcome. Further, which sustainable impacts can be realized through the implementation of more sustainable approaches and ideas. The aim of this work is to highlight the sustainability influence in and through the IT industry as an enabler, to identify opportunities and challenges and end with a small prospect. It is important not only to be blinded by the great opportunities and potential, but also to critically examine trends and developments that are currently taking place and those that are yet to come. After a brief conceptual introduction of what is meant by the Information and Communication Technology (ICT) and the IT industry, the content continues with the influence on the economy. In this context, various theories and figures are used to show the extent to which ICT and sustainability in ICT influence economic growth, and concepts such as the “EKC”, “Moore’s Law” or “Green IT” are presented. After the methodology explained for searching and analyzing this information, the first effects (first order, second-order, third-order effects etc.) of ICT were shown and the negative side of possible damage and consequences through the IT Industry. Following this, evidence and possibilities will be shown of how ICT can influence sustainability in various sectors such as agriculture, energy or even health. With the help of measures and concepts, it is shown which approaches can be pursued in theory and which possibilities exist (green IT, EI etc.). To be able to measure sustainability, various approaches are listed and explained in the next chapter. These include, for example, the Green IT scorecard approach or various tools and rating systems such as the EPEAT application. Barriers and drivers are then almost the last topic to be discussed. These are first explained in general terms and then subdivided into external and internal modes of operation. Finally, recommendations and tips for more optimal sustainable development are provided.
2 Definition and Relevance
2.1 Information technology
Information Technology (IT) is a part of definition under the whole concept of Information and Communication Technology5 (ICT). Information and communication technology is also understood as a collective term that covers various devices and hardware such as televisions, cell phones and computers6. Umlai (2023) fundamentally states that this definition and understanding covers any type of end device that can send, display, change, share or save information in digital form.6 Information Technology includes the IT-Hardware and IT- Services7. Due to the digital transformation IT becoming more and more common in our lives, for example by using IT at work or at home.8 “IT” and “ICT” to be scientifically clear at this point are often used simultaneously in the literature. The acquisition of data, the processing and distribution, the storage and organization of them can be an entrance to the definition of information technology. With the help of IT it is possible to process different varies of data like numbers, text, image, audio or video.9 Communication devices such as radio, television or cell phones that give users access and the ability to share and collect information are included in the definition of ICT.10 The use of ICT can be tied to prerequisites such as certain skills and qualifications on the labor market or an economy with a good infrastructure. Furthermore, it must be possible to perceive and realize the advantages and added value of these technologies. The adaptation and implementation of ICT must be understood as a learning process that develops step by step.
2.2 Economic Importance
One of the known laws during in the technological sector is called Moore’s Law, which describes a trend of rapid growth and increase in technical components.11 It states that the number and density of microprocessors doubles every two years. Kretschmer & Woessman (2011) describe the endogenous growth theory in which ICT is the driving force of economic development through the development of new paths, processes and products.12 In relation to economic growth, Stanley et al. (2018) refer to the basic assumption of neoclassical growth theory.13 In this theory, exogenous technological change is the driver and factor for growth.13 The promising opportunities and potential offered by ICT can only be realized with the appropriate qualifications and, for example, a functioning infrastructure. In addition, the impact of this opportunity must be given time, time in terms of development and knowledge acquisition during the use of these structures and processes.13 One development that has been observed in recent decades, particularly in countries such as China, India and South Asian countries, is that investment in ICT has grown rapidly.14 In 13 of the G-20 countries were found that ICT positively influenced economic growth from the year 2000 to 2014.15 The impact of ICT on countries were examined in high-income (45) and medium income (58) states and countries with low income (20).16 The research stated that the added value of ICT is greater in low-income countries compared countries with a high level of income. Economic growth is being promoted through ICT in both types of countries.16 Adeleye & Eboagu (2019) show that new employment, the spread of e-commerce and information, and better human capital development are consequences of the massive increase in ICT (in developed countries).17 Toader et al. (2018) come to a similar conclusion that ICT infrastructure also promotes growth in European countries in a period from 2000 to 2017.18 Stanley et al. (2015) goes on to say, referring to the work of Gordon (2000), there may generally be a “publication bias” in terms of impact and correlation with economic growth. This bias lies in the fundamental assumption of a positive correlation between ICT and economic growth.13,19 Originally between economic growth and income inequality the famous “Kuznets curve” were developed. It was found that inequality rises and falls as soon as a certain level of economic development is reached in a country.20 The environmental Kuznet curve (EKC) describes the relationship between environmental degradation and economic growth, which represents a similar relationship. Grossmann and Krueger (1991) provided the first fundamental impetus and helped with their empirical work and provided further insights and information regarding the U-shape in the EKC hypothesis.21 Panayotou (1993) confirms the hypothesis that at the beginning of economic growth, environmental destruction increases and later decreases again. Empirical data is used (air pollution) to explain that strategic investments in environmentally friendly technologies promote sustainable development.1 The shape of the relation can also be explained by the following three effects: the “scale effect”, the “technological effect” and the “composition effect” as seen in the following figure 1. The economies of scale describe the general growth of the economy and the increasing total consumption of resources (increase in urbanization and industrialization). The technique effect, on the other hand, describes the development towards technical progress and the fact that greener technologies are being used more with higher incomes and more environmental awareness, which can reduce environmental impacts. The composition effect explains the change in the entire economy from the resource-intensive production of products to less environmentally harmful services.1 With the help of these three effects, it can be shown and explained that a turning point is emerging and that this relationship behaves with increasing growth.
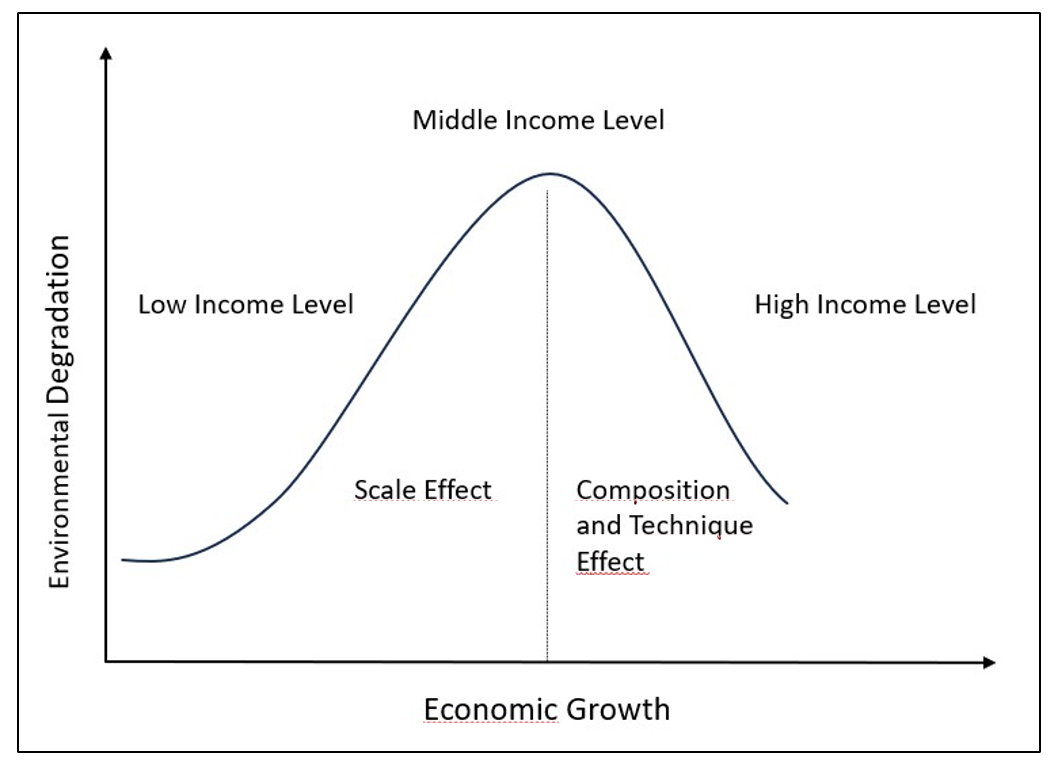
Figure 1: The environmental Kuznet Curve based on Panayotou (1993)1
Based on this assumption, even though there are also critical voices, if investments in ICT bring technological progress and thus also influence economic growth, positive effects for the environment can be derived.
3 Sustainable Impact and Measures
3.1 The spectacles of sustainability
To provide a start to the original basic movement about sustainability, reference is made here to the principles of Carlowitz (1713). This states that only as many trees may be felled as can grow back in the same time.22 In the 1960s, a kind of initial understanding and awareness of the environment arose due to electronic waste and toxic chemicals.23Norford et al. (1988) found that the energy consumption of office electronics and especially personal computers (PCs) were high, the market for office electronics was growing enormously. Therefore, strategies are needed to optimize energy efficiency and components, since obvious potential exists.24 The Basel Convention, established in 1989, is an international treaty that aims to minimize hazardous waste and ensure environmentally sound management and disposal. This agreement was not developed specifically for electronic waste, but it has been continuously expanded and concretized to include topics such as e-waste.25 This states that only as many trees may be felled as can grow back in the same time. The Brundtland Report (1987) defined “sustainable development” – which is about being able to satisfy the needs of current society and future ones. Two ethical approaches are to be understood by this, firstly “intragenerational justice” (present needs) and “intergenerational justice” (future needs).26 The general 3-dimensionla approach can also be thought of and implemented in the direction of ICT. The three-dimensional approach encompasses ecological, social and economic dimensions. Furthermore, it can be determined how ICT can support the goals in each of these dimensions from an ecological (e.g. less environmental impact), social (e.g. support for social justice) or economic point of view (e.g. decoupling & dematerialization).27 Hilty (2008) has developed a conceptual framework that provides an introduction to the effects of ICT2. Started with the “first-order effects” as “direct effects” that can be derived from the development, production, use or even the dismantling or disposal of ICT. These effects can be understood and evaluated with the help of a lifecycle assessment by evaluating the demand for energy and materials as a fundamental part of this effect.28 These direct effects include influences, such as the effects and emissions of power plants that subsequently provide energy and electricity for energy consumers such as a data center.2 These effects were classified as negative in the following graphic (Figure 2). 28
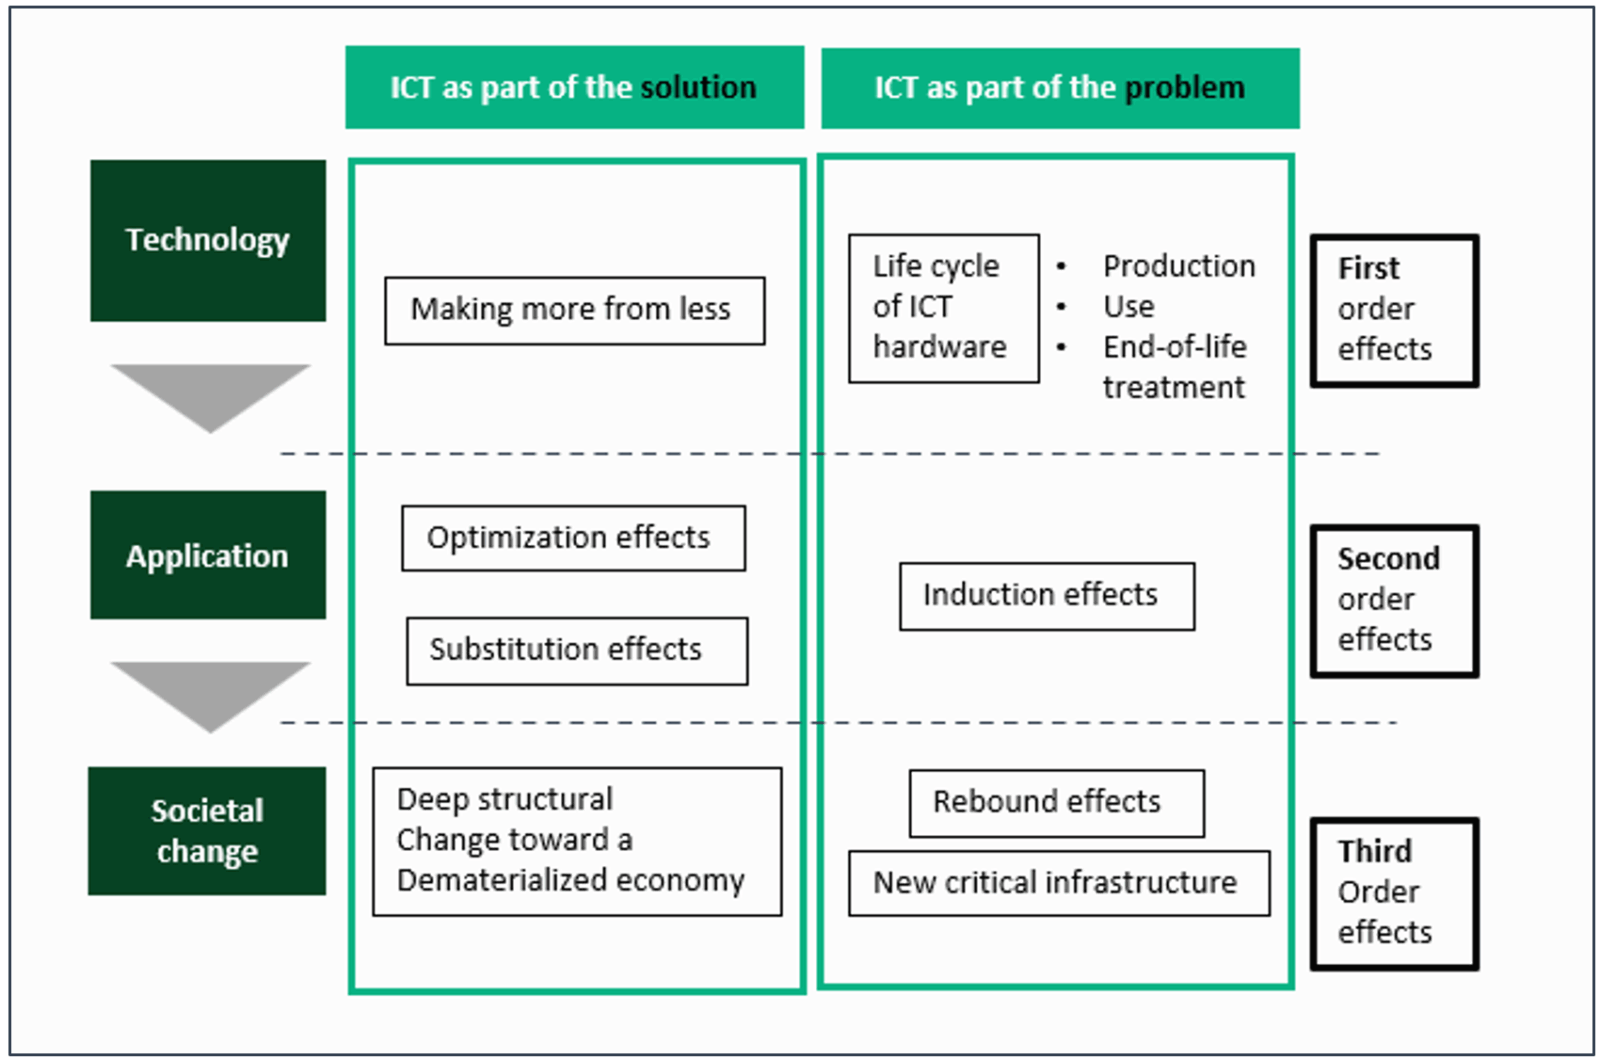
Hilty (2008) also explains “secondary effects”, also known as “indirect effects,” which can be explained in relation to the life cycle of the product and their interactions with each other. For example, optimization effects, substitution effects and induction effects. In the context of sustainability, substitutions and optimizations of products in the industry and the economy can make significant contributions to achieving dematerialization.2 Substitution can be mapped in several ways, but substitution must be assessed based on its upstream steps. A physical meeting can be replaced by a virtual one, a journey can made in a more environmentally friendly way like a train instead of a plane, more efficient or environmentally friendly fuel is used instead of conventional fuel.28 Induction effects are impacts that can result in a negative environmental scenarios like higher consumption or higher emissions induced by measures and activities before.2 The purchase of a printer leads to increased paper consumption.28 Hilty and Aebischer
(2015) also list the obsolescence effect as a second effect of ICT among the “enabling effects”28. The “obsolescence effect” can result in a shorter service life and lead to the non-use of resources or end devices, for example because devices are no longer maintained due to a lack of compatibility (no updates and support etc.).28 The “third-order effect” (“systemic effect”) of ICT on CO2 emissions and sustainability describes society’s reaction to the availability of ICT services. A structural change could be triggered by results from interactions with the environment. These aspects enable the economy to change towards less energy-intensive processes and procedures and structural dematerialization, visualize models and calculations and make them visible and understandable.2 The information from the environment are promoted and processed via services and applications from ICT and can help with environmental protection, research or even minimizing the damage caused by crises and disasters.2 Hilty and Aebischer (2015) also describe the so-called “Jeavons paradox” as can be found several times in the literature.28 The idea is that more efficient technologies do not necessarily lead to reduced consumption but also to increased use of the resources in question. There are two effects, for example in the transportation sector, that almost cancel each other out: Demand is boosted by more efficient designs in the transport sector, meaning that transportation can be realized faster and more cheaply.28Hilty and Aebischer (2015) developed a diagram above on the basis of Hilty (2008) provides a clear breakdown of positive and negative effects in the form of solutions and problems in terms of sustainability.28 2 The difference between a “rebound effectr” and an “induction effect” lies in the different level and scope of these effects, while the induction effect increases a specific resource through ICT the rebound effect increase in consumption caused by ICT on a wider scale and to a greater extent can lead to an undesirable and counterproductive development28. In terms of energy efficiency in computers, Koomey et al. (2011) found that the calculation per unit of energy used doubles every 1.57 years. The study examined a period from 1947 to 2009, and between 1978 and 2009, performance doubled in just 1.5 years.29 In addition, the total number of fixed computers has doubled every three years.30 The LES Model includes the “Life Cycle Impacts” at level one, which presents the physical effects and processes (processing, manufacturing, energy supply and recycling – all stages of an life cycle).28 Level two describes the “Enabling impacts” that is triggered by the application of ICT and is understood as a form of substitution that is subdivided into the optimization of processes (intangible replaces material), substitution by media and externalization of control. By optimization of processes the aim is to reduce the input, even if the input is work or money. Automation solutions in industry, for example, reduce input such as labor through lower energy costs and capital expenditure. The replacement of a medium by a digital medium is called “media substitution” and can, for example, represent the change from printed information sent by post to digital information sent via the Internet. Under the concept of externalization of control, the previous internal source of information can be supplemented or replaced by an external one and, for example, heating systems can be controlled externally via the Internet and thus optimized if necessary. In the final stage, the third level, the LES model focuses on structural influence and change in the broader economic sense (macroeconomic). This Structural change in this case refers to the change in economic conditions in the form of dematerialization and a networked economy. Substitutions and optimizations can lead to dematerializations, under the constant consideration of rebound effects. Institutions can influence sustainable development through their policies and regulations and can use ICT to incorporate relevant environmental data and information.28
3.2 Part of the Problem
By exceeding the natural boundaries of the environment through, for example chopping down rainforests or the extraction of resources and emitting more and more emissions dangerous scenarios like rising sea levels or droughts are expected.31 Greenhouse gas emissions are increasing and influencing the climate, causing floods, smog and acid rain.32Also face various challenges in areas such as energy, health, transportation, public administration and education in the coming years.33 These include the demographic change in the population, the increase in energy requirements and the lack of IT skills in schools.33 According to the Global E-waste Monitor 2024, direct and indirect effects can be seen that also have an impact on society, for example by damage to health or child labor in relation to manufacturing and production.34 Caused by ineffective e-waste regulations, 58 thousand kilograms of mercury and 48 million kilograms of plastic are released into the environment each year. The mass of e-waste per year has risen to more than 60 billion kg (62) in 2022 due to various drivers such as technological progress or short life cycles. 5.9 billion kg for screens and monitors and following 4.9 billion kg e-waste for smaller IT and telecommunication equipment in 2022 were generated. Up to 52 billion kg of CO2-equivalent emissions were avoided, as 900 billion kg of ore did not need to be extracted through e-waste recycling.34 The “truncation error” occurs when a certain part of the supply chain has not been considered and thus has not been included in the total supply chain. This ultimately leads to an underestimation of the footprint of ICT.35 For all these areas and more, there are solutions from the IT industry that optimize, change and deliver a positive impact such as greater efficiency or access to the respective resource.33 But nevertheless servers, computers, monitors and other hardware require more and more electricity.32 This electricity is generated using coal or oil and emits harmful emissions such as sulfur and carbon dioxide, which in turn influence the environment and climate change.32. By Talking about sustainability in the information technology and ICT industry one of the first considerations can go in the direction of the duration of use and utilization of the devices, as well as the production of the used hardware. In this case, ICT hardware is also often mentioned, has a smooth transition to IT hardware. The devices and hardware used generally have different lifespans depending on their use and location. The usage period of a standard laptop or desktop computer in an office is estimated to be around 3 to 5 years.31 According to the Natural Resources Defense Council, the average server is in use between 12 and 18 percent and still consumes 30 to 60 percent of maximum energy.36 Several reasons slow down the development of energy efficient data centers: so-called “comatose servers” (estimated 20-30 percent), servers that are not used but consume electricity, poor planning of peak loads and the procurement of equipment (purchase of efficient components) as well as a different strategic focus (competition instead of energy efficiency).36 The high need and demand for computing in developing countries, the implementation and growth of data centers and the rising use of mobile phones can be seen as one reason for increasing carbon emissions. The carbon footprint of the use of ICT, production and disposal are one of the negative effect of this industry nonetheless ICT may be a tool to flatten the carbon emission curve37. The disposal of this hardware also represents a hurdle, as the recycling processes are not cost-efficient and simple compared to non-ICT-powered machines.31 One explainable reason for this is that many different materials that are used are in a miniaturized form. As these factors make the recycling process more costly, millions of pieces of hardware are sent to developing countries to be scrapped, often illegally.31 Khuntia et al. (2018) stated a significant difference between the development for carbon emission related to energy in states in the OECD (Organization for Economic Co-operation and Develop ment) and the one in developing countries. According to estimates for the year 2030, developing countries will be responsible for almost 97% of the growth in energy-related carbon emissions.37 In comparison, the energy-related emissions of the OECD countries will remain almost at the current level. To put this data into perspective, the carbon emissions from developing countries in 2030 from energy-related activities would account for an estimated share of 63 percent of global carbon emissions.37 In 2020, the share of global Green House Gases from ICT may be between 1.8% and 2.8%.35
3.3 Part of the Solution
The main problems, such as manufacturing, production or the depletion of resources for components and products in the ICT industry, are now followed by opportunities and solutions. ICT can be understood and seen as a key player that enables and transforms other industries and sectors and can ensure positive development towards sustainability with the help of the technologies of the industry.
Erdmann and Hilty (2010) suggest that the application of ICT helps to decrease important necessary resources, materials and energy demand as well as transportation volumes38. The fact that CO2 emissions can be reduced with ICT is also proven by the research of Khan et. (2020), in which a total of 91 developed and developing countries were examined in a period from 1990 – 2017 clearly confirming the effect for each country.39 Sustainable development can be reached through the realization of efficient structures and technologies. It therefore makes sense for politicians to drive structural change, for example through the use of alternative and renewable energies.39 IT can help to evaluate or model environmental impacts using software, report on energy consumption, monitor energy consumption, collect and share knowledge and information, and generally provide tools to use this data.32 In the literature, ICT is often referred to as an enabler, hence the following report provides insights and potential in various industries and sectors. The Global e-Sustainability Initiative (GeSi) is a partnership of ICT companies committed to fostering economic, environmental, and social sustainability published the “#SMARTer2030 – ICT Solutions for 21st Century Challenges” report in 2015. The number of economic benefits could amount to 11 trillion dollars per year by 2030 and reduce global CO2 emissions by 20% by 2030 and maintain emissions at 2015 levels. Demobilization and dematerialization are approaches and concepts that possibly can make a positive contribution to the environment and thus have the potential to lower emissions.40 According to the #SMARTer2030 report of GeSi, solutions from the ICT sector may save almost 10 times (9.7) more CO2 emissions than emitting emissions in the environment. In the following, different areas and potentials will be highlighted. Eight Sectors have been identified that can be directly influenced by ICT, including agriculture (smart agriculture), the housing and construction sector (smart building), business and shops (e-business), transportation and logistics (smart mobility), health (e-health), education and learning (e-learning) and production (smart manufacturing).
3.3.1 Smart Energy
ICT can promote renewable energy and use smart grids to achieve financial success as well as emission reductions and ensure greater transparency. According to estimates in the SMARTer 2030 report, this could result in 1.8 Gt Co2e and 0.8 trillion in new revenue41. Energy savings of up to 6.3 billion MWh (20 percent less energy production) and a 5% reduction in energy loss in the distribution of energy and the avoidance of 700,000 km of network structures as well as universal access to energy are positive impacts of Smart Energy. Collecting and analyzing energy data and information using smart grids to regulate and adjust demand, i.e. to coordinate the supply of energy from alternative or sustainable energy sources can lead to a more sustainable environment.41
3.3.2 Smart Agriculture
In the food sector, ICT may reduce the waste of water and food with the help of smart agriculture (by 250 trillion liters and an abatement up to 2.0 Gt CO2e). ICT may ensure greater resource efficiency and could produce 900 kg more crop per hectare by 2030 with the help of smart agriculture. One of the major tasks of the future will be to be able to feed more people adequately, given the fact that more resources will become scarce and negative externalities such as harmful environmental influences will occur.41
3.3.2.1 Best Practice – Project in Ghana (FAO) about climate-smart agriculture
Climate-smart agriculture (CSA) is an approach that has been significantly advanced by the Food and Agriculture Organization (FAO) and has been applied in a case study in Ghana. CSA aims to improve and prepare agriculture for sustainability and resilience to climate change. In the Ghana project, climate-smart agriculture practices were applied to cocoa production. A total of 1056 livestock farmers participated, between 2017 and 2020, income increased by 16.76%, productivity increased by 12.85% through more effective application, and environmental production efficiency increased by 27.18% (more products with fewer emissions).42
3.3.3 E – Health
The report sets out various aspects for an effective healthcare system, such as improving prevention in the healthcare system, being able to make early diagnoses and also improving quality of life and thus also positively influencing the expected lifespan.41 Effects like more resource efficiency and greater awareness of one’s own health through insights gained from innovations and information in the e-health segment and opportunities to treat one’s own health more adequately should be requirements met by an intact healthcare system.41 E-health should lead to better information using smart devices, giving access to relevant information and better service, on-demand access as well as potential trends and treatments related to the individual case.41 Online diagnostics, video meetings, data storage, augmented reality are the four key technologies in this sector. Nearly 1.6 billion people could get access to important e-health services.41 Smart Building
In the housing and building sector greater sustainability can be achieved by reducing energy and water usage costs with smart building solutions are possible outcomes with the enablement through ICT. According to the estimations, up to two Gt CO2 savings, 0.4 trillion dollars in energy cost savings and potential revenues of 0.4 trillion dollars. The concept of smart buildings describes the integration of smart grids via smart meters, forecasting and evaluation of energy data, technologies for observing data, sensors on buildings and automation systems. With the help of these technologies the lighting, cooling and heating of the building can be controlled and more energy and resource efficiency can be achieved.41
3.3.3.1 Best Practice – Deloitte Smart Building Study 2021/2022
The Deloitte Smart Building Study 2021/22 examined 20 smart buildings in Germany and Switzerland and concluded that operating costs were reduced by an average of 26% compared to conventional buildings. In addition, energy consumption was on average 34% lower, and increased comfort and image were also reported.43
3.3.4 E-business
In the business and labor sector, an estimated $1.8 trillion in revenues could be generated by e-commerce business and $0.5 trillion by e-work. Up to 2.7 Gt Co2e could be abated through smart and virtual manufacturing, smart devices and products tailored to the consumer with more resource-efficient production due to more targeted use of inputs.41 This positive development and reduction in pollution from emissions is partly due to the use of efficient transportation systems and the construction of smart cities.44 E-business refers to trading on virtual platforms securely and without payment via cash, for example in the form of e-commerce through online shopping or in the financial sector through e-banking41. Another area of e-business that is relevant for companies is e-work, which includes the use of cloud-based platforms and thus ensures location independence. As a result, it is estimated that up to 165 billion liters of fuel could be saved by not having to travel, 105 billion hours of time could be saved through ecommerce processes and around 388,854 tons of paper could be saved.41
3.3.5 Smart mobility
The potentials in the mobility sector could be utilized for the energy sector through potential oil savings (25 billion barrels). Approximately 135 million fewer vehicles in the transportation sector and overall potential water savings of 300 trillion liters. There will be approximately 2 billion vehicles on the road in 2030, according to the GeSi report.41Consequently, these vehicles will require extended roads and an additional 15 billion km of road network. This means traffic control and optimization with smart sensors and intelligent structures can make parking, driving and the traffic situation more efficient. Car-sharing or car-pool platforms to connect people and vehicles using the same routes, improving routes and logistics through smart logistics. The highest abatement costs are given in the United States, China and India savin fuels (saving of 750 billion liters). In addition to energy savings, other aspects that should be considered are the use of temporal resources through more efficient and improved navigation and road traffic. Further advantages can be the reduction of noise and sound, more safety and less health risk. In the logistics and mobility sector data on current traffic levels or smart logistics and avoided travel could abate up to 3.6 Gt CO2e. To avoid wasting resources, the use of car sharing, tool lending and food sharing and similar services and apps can be used. 31
3.3.5.1 Best Practice: Smart mobility Study – Comparison from Copenhagen and Barcelona
This study by Wolniak (2023) shows how the city Barcelona has taken on a pioneering role in many ways about smart mobility measures. Specifically, it focuses on the bicycle rental system, which is inexpensive to use, investments in e-mobility, intelligent parking systems for finding available parking spaces, real-time traffic flow monitoring and the adaptation of traffic lights to reduce congestion on the roads, as well as low-emission zones and other measures.45
3.3.6 E-Learning
Open community platforms, learning games and virtual reality are some sustainable e-learning solutions that encourage learning at any age and for any preference and make learning affordable and accessible wherever participants are or whenever they want access. The travel the students must take to get to their locations to learn which lead to expenditure in fuel costs, the million tons of paper which will be saved (approx. 91 million) and the overall savings in expenditures per student as well as the offer to gain more participants via E-Learning (450 million potential participants)41. Similarly, in learning and education, extended availability, flexibility and accessibility can be made possible. In terms of numbers, an estimated 450 million people would be able to participate through e-learning.
3.3.7 Smart Manufacturing
Smart manufacturing is the smart transformation towards more efficient and flexible workflows, as well as processes and structures that are intelligently coordinated. This includes smart services and smart factories, buyer-centric production, self-organizing systems and virtual manufacturing. The contribution to sustainability here is also made clear by smart manufacturing, which generates 4.2 billion MWh and 81 billion liters.41
Dynamic demand regulation and permanent monitoring of components can lead to greater efficiency and optimized operation to avoid and minimize energy losses in the processes and intermediate stages (distribution, storage and transmission).41 Khuntia et al. (2018) stated that investments in Green IT in emerging economies can have a different background than building up consistent and sustainable structures but to promote greenwashing and make the company look like they were environmentally conscious.37 Further with the help and through Green IT investments higher profits can be partially realized by decreasing energy consumption of IT.37 Higón et al. (2017) stated that ICT has a positive influence and can reduce emissions once a certain level has been reached (116 developing, 24 developed countries examined). A U-shaped curve was observed in this study which implies at the beginning (at a low level of development), investment in ICT leads to an increase in emissions, but from a certain level these emissions begin to fall. Regarding the environmental Kuznet curve thesis, it can be confirmed in relation to developing countries, but the result for developed countries is that the relation between income (economic growth) and pollution appears to be positive and linear.46 Masanet et al. (2020) reports that the energy consumption of data centers changed only marginally (174 TWh in 2010 to 205 TWh in 2020), but the compute instance increased by 550%.47 In their work, Malmodin and Lundén (2018) also emphasizes that the global amount of data increased 1,000,000-fold in a time frame from 1995 to 2015, but that operational power consumption increased threefold. It is also shown that, contrary to some assumptions, energy consumption does not tend to increase with the increase in data traffic. More efficient and smaller devices lead to a smaller ecological footprint per user, and the coverage of the energy supply by renewable sources is high.48
3.4 Green Concepts & Measures
Green measures, science and concepts can help to achieve a certain goal in a more efficient way to achieve sustainable development. Through the close monitoring of data and the creation of understanding, the dissemination of sustainable practices and the extension of life cycles are crucial. Measures to disseminate information, create greener structures and reduce resource and energy consumption through ICT are mentioned in the following section.
3.5 Environmental Informatics
Environmental Informatics shows the combination of computer sciences and their information systems with environmental sciences through advanced simulation modeling techniques and problem-oriented experience knowledge from environmental28. Specifically, environmental informatics is understood to include, among other methods, visualization and representation, the integration of data in knowledge-based systems and artificial neural networks supplemented by user-related interfaces.49
3.6 Computational Sustainability
Computational Sustainability is the use of computer-based processes, solutions and approaches from computer science to address challenges in the field of sustainability and to create a balance between the requirements from the environment, the economy and society. Machine learning, model simulation and data analysis are some of the methods used. At the same the research in this area thrives on interdisciplinary work, which has a positive effect on the innovation process.50 In this context, computational sustainability can be used in the planning of nature conservation measures or the planning of the impact of extreme climate situations.
3.6.1 Best Practice – Computational Sustainability for placing hydroelectric dams:
When placing hydroelectric dams, a multi-objective optimization process is used to consider various criteria from sustainability and to minimize environmental impact. The aim is also to maximize economic results as much as possible. It provides a good understanding of the tradeoffs between the objectives, be it habitat preservation or energy production.51
3.7 Green IT
To successfully implement Green IT the “tactical incremental approach”, the “strategic approach” or the “deep green approach” are recent approaches for successful realization. The tactical incremental approach measures are easier to implement, less costly, and serve a quick solution with moderate results and objectives. The strategic approach focuses more on a deeper assessment of the infrastructure, developing a plan and implementing effective methods, efficient systems and guidelines. The deep green approach is considered an extension of the previous one, with the help of further implementations such as carbon offset policies or the use of greener energy sources.32 IT infrastructure consumes considerable amounts of electricity, and its manufacturing has a harmful effect on the environment. Green IT can be used as a solution to reduce energy consumption and high emissions.32 Murugesan (2008) describes Green IT as follows: “It’s the study and practice of designing, manufacturing, using, and disposing of computers, servers, and associated subsystems-such as monitors, printers, storage devices, and networking and communications systems-efficiently and effectively with minimal or no environmental influence. Green IT also strives to achieve economic viability and improved system performance and use, while abiding by our social and ethical responsibilities” (p.25-26).32 The demands, needs and requirements that consumers and other stakeholders place on companies are constantly increasing. Therefore, the implementation of Green IT can bring not only financial benefits through more efficient energy use, but also other benefits. Green IT affects the design and location of data centers, more efficient data processing, virtualization of servers, but also responsible and conscientious disposal and recycling. The use of green and renewable energies, energy management or even the environmental labeling of products from the IT industry fall within the scope of Green IT.32 “green use” refers to the reduction of energy consumption and less environmentally harmful use. The same applies to “green design” and “green manufacturing” which refer to the way components are designed regarding energy efficiency, as well as the production and manufacture of end devices and products. At the end of a life cycle, there is usually disposal, which, in the case of “green disposal”, results in measures such as refurbishing or reusing the old components.32 Reusing a device or component to achieve a longer service life of the products and “refurbishing”, which involves overhauling and reequipping devices so that they can be used again are there suitable concepts here. “Recycling” is the last station for devices or components when no other option is practicably and since many contain hazardous and toxic substances, careful recycling and disassembly into their individual parts is essential
Murugesan (2008) states that measures for greening and improving data centers and saving energy can be realized by using liquid coolants instead of air cooling or implementing highdensity servers (powered by hydrogen fuel) or new more efficient equipment. Energy consumption can also be reduced by the introduction of power management features which shut down devices or put them into an energy-efficient state. Switching off systems when not in use or changing from desktop PCs to thin clients are further effective measures.32. Furthermore, virtualization and eco-friendly designs can be used to implement additional Green IT measures. Virtualization is the hosting of multiple virtual servers by a single physical server, which can save space and energy. When designing data centers, solar and wind energy can be employed, as well as heat and light regulation, and recycled materials can be used in component manufacturing.21.
3.7.1 Best Practice: Case Study about the use of thin clients and proxy-based architecture.
In 2012, some case studies were conducted by Chibli Joumaa and Seifedine Kadry that examined the energy savings achieved with thin clients and the development of proxy-based architecture to optimize energy consumption. It was found that thin clients consume up to 85% less energy and cost about a fifth of the budget. The introduction of proxy-based architecture can save up to 95% of energy consumption and reduce average download times by about 22%.52
Khuntia et. al. (2018) suggest in their work that firms in developing countries can develop lean management practices, by operating in a more resource-friendly way and using more efficient systems and infrastructure without achieving at least the settled goal through investments and usage of Green IT. This can result in lower energy consumption of IT equipment, cheaper operational expenses, and increased profitability due to energy savings achieved through the application of Green IT.37 Up to date data and information that can be delivered through technology, for instance, can create more sustainable consumer decisions due to better-informed consumer knowledge.32 Molla (2009) further explains that the implementation of Green IT can be seen to adapt environmental sustainability into one’s own IT infrastructure. This can be through the responsibility of the products or waste avoidance in disposal or in production with the help of clean technologies.53 Shrivastava (1995) has also identified advantages in relation to the implementation of Green IT in various manners such as infrastructure, use and strategy. Competitive advantages can potentially be achieved by reducing debt, improving social and health conditions, reducing costs or improving quality in use. Strategically, public image can be enhanced and penalties can be avoided through compliance with the law.54
3.8 Guidelines, Tools and Measurements
Measuring sustainability in the IT industry is usually difficult, but the following approaches were examined in detail. Molla (2013) summarizes a few aspects with the help of other research in which measurement methodologies can and must be developed.55 As already described in this paper, ICT has not only positive but also negative influences, which means that accurate measurement should be guaranteed.
3.9 The Environmentally Sustainable IT Performance
Green IT and Green IS investments must therefore be evaluated in two ways, firstly in terms of the fundamental classification of an investment and then in terms of green performance. With the help of the The Environmentally Sustainable IT Performance (eSITP), market effects could be understood and a general foundation for understanding the added value of Green IT could be laid.55 Molla (2013) defines the eSITP as an assessment with four instruments of how successfully companies can establish a sustainable culture and adapt their processes and structures under the standards of eco-sustainability in order to create sustainable added value. The approach of Molla (2013) is based on Kaplan and Norton’s balanced scorecard (1992)56and the eco-sustainable strategies by Hart (1997)57. Dimensions like eco-learning, the eco-process, in terms of public perception the eco-branding and eco-value governance are the four areas of the eSITP. Eco-learning assesses the extent to which a company manages to build a sustainable culture, transfers this vision to its products and processes and develops capacities and competencies to contribute to this endeavor. The next dimension, eco-process, measures the extent to which a company designs its products and services in a sustainable manner, reshaping and adapting environmental criteria. Eco-brand looks at the performance of IT companies from a different perspective, namely that of customers and users. The eco-brand also aims to assess whether a company can market and recognize its own green values and consider them brand value. It is important to create understanding and raise awareness of these green concepts and approaches, which bring change to the company in many ways. Lastly, eco-value governance helps to visualize returns and values from applied and introduced concepts such as Green IT and Green IS and gives the opportunity to evaluate them through measurements, evaluates the maturity and quality of reporting and measurement in the company. This form of performance evaluation also depends on the provision of a wide range of technologies that can positively influence more sustainable development through their impact. In addition, the attitude of top management, culture or, among other things, strategic direction has an influence on this evaluation.55
3.10 Life Cycle Assessment
The first step in the Life Cycle Assessment (LCA) process is to define the objective and the framework, e.g. by distinguishing between “attributional LCA” and “consequential LCA”.58 Attributional LCA describes the inputs received by and the outputs generated from the respective product. Consequential LCA evaluates the changes in environmental flows due to decisions made in the life cycle.59Subsequently, the overall potential environmental impacts and resource consumption of the product are assessed. This begins with the procurement of raw materials, continues through, manufacturing, distribution, use and disposal, and finally to recycling, also considering the human health and environmental aspects of services and products (Figure 3).60 LCA enables a holistic assessment of products and the early identification of problems. It supports decision-makers by providing a wide range of information and, with the data obtained, can contribute to evidence-based guidelines. In addition, the data obtained can be used to initiate measures that optimize the life cycle and also help to prevent the shifting of environmental effects.58
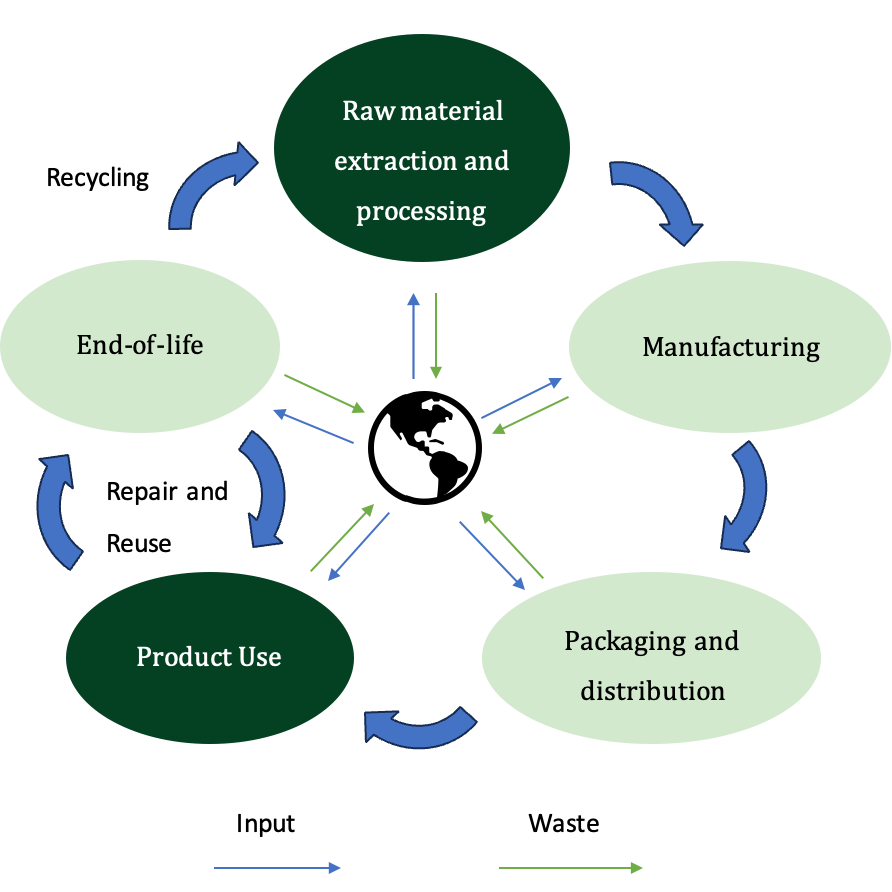
Figure 3: Life Cycle Assessment adapted from Life Cycle Approaches: The road from analysis to practice (2005)4
3.11 Electronic Product Environmental Assessment Tool
The Electronic Product Environmental Assessment Tool (EPEAT) helps consumers to evaluate and classify end devices and components and awards manufacturers and producers for environmentally friendly products. The evaluation is based on following relevant criteria and the products are evaluated in terms of packaging, the avoidance of critical materials, durability and energy savings.32 There are climate criteria to check and determine emissions, and criteria to examine responsibility with regard to the supply chain and working conditions. Other criteria relate to the reduction of hazardous substances and materials (reduction of chemicals), the use of resources such as durability or the use of recycled materials, and criteria for solar technology.
3.12 Green IT balanced Scorecard
In 1992, Kaplan and Norton presented the Balanced Scorecard (BSC). The goal was to map the strategy and objectives using measurements and to evaluate them.61 This concept was further developed over time, especially in the direction of IT62 but environmental aspects were left out, which is why Wati and Koo (2011) developed their model as a Green IT balanced scorecard.63 Wati and Koo (2011) explained the Green IT balanced scorecard as follows: “a nomological management tool to systematically align IT strategy with business strategy from an environmental sustainability perspective in order to achieve competitive advantage” (p. 2).63 The Green IT BSC model is based on two principles: firstly, the competitive advantages that arise from implementing green IT and, secondly, the environmental aspects of technology. In the process perspective, various metrics are used to examine the extent to which green IT can reduce environmental impacts, consume less energy and mitigate environmental risks, or provide for easy recycling and reuse.
The stakeholder perspective refers to the assessment of the stakeholders. The main focus lies on identifying the key stakeholders, understanding their interests and needs, determining the strategies required to meet those needs, assessing the necessary capacities and processes, and clarifying what input is expected from the stakeholders.64 The future orientation is the next subarea of the Green IT balanced scorecard, which has sustainable development as its objective. This includes improved access to knowledge about green IT from external sources, R&D of Green IT and improving attitudes towards green innovation and motivation. The measurement for the financial perspective includes determining whether Green IT can be used to generate higher revenues, reduce costs for environmentally related risks, manage investments in Green IT and add value from Green IT. In summary, the aim is to evaluate the performance of technologies including environmental awareness, and to evaluate the impact and investments of Green IT to gain advantages through decisive information.
4 Drivers and Barriers
Drivers and barriers to sustainability in the IT industry can appear in a wide variety of forms and differ in terms of the framework conditions under which they promote or hinder development. Aghelie (2017), for example, described 21 drivers and 35 barriers to sustainable development, especially in small and medium-sized enterprises (SME’s), in his work.65 These types of SMEs usually operate as independent and owner-managed companies with a manageable market share in segments such as the production of physical or chemical goods or services such as ICT services, logistics and others.66 These drivers and barriers are comparable to those that affect larger companies.67 The following drivers and barriers are categorized as external and internal drivers and barriers, external if the influence or effect comes from outside the organization, and internal if it occurs or takes place within the organization. In Figure 4 some of the barriers are presented under the assessment of different companies by Stucki (2019).3
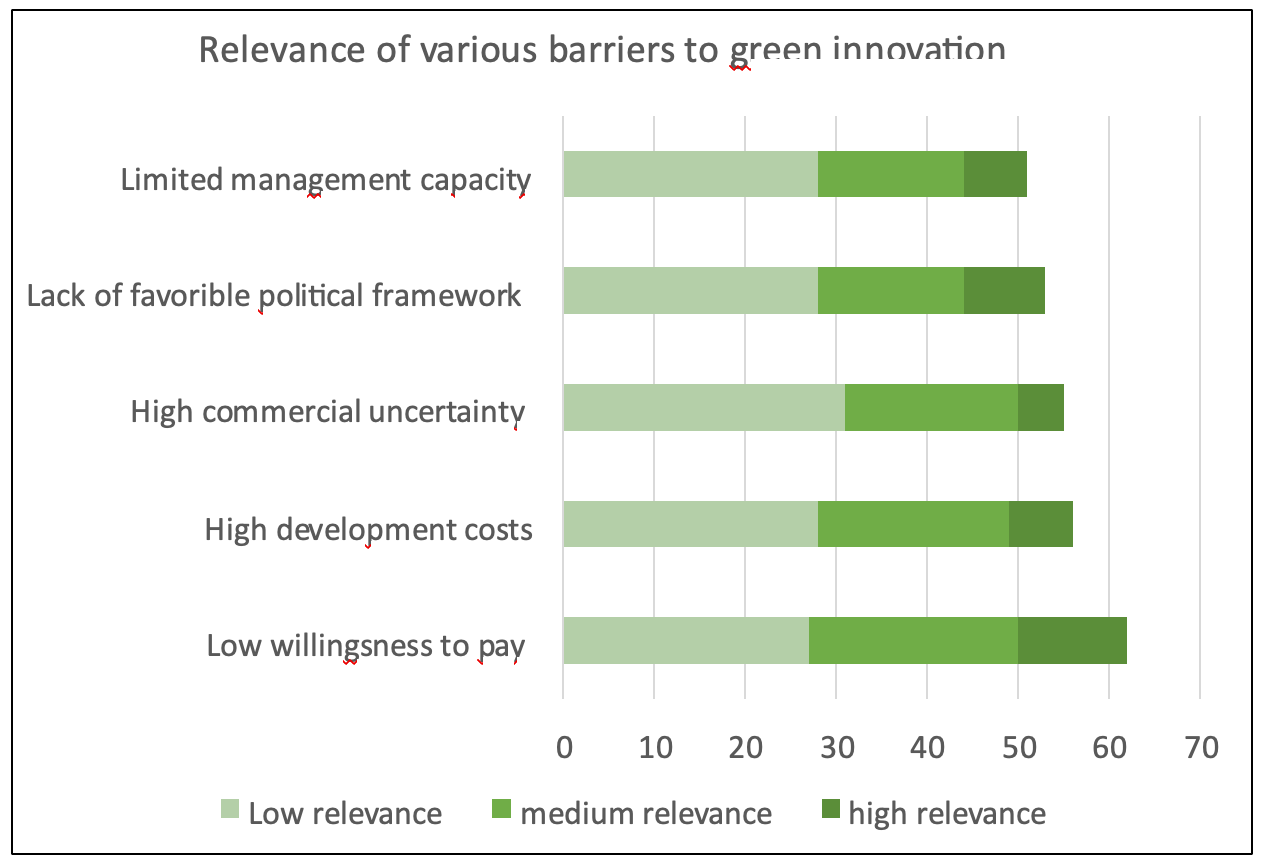
This figure shows the relevance of the top barriers for green innovation. Through the literature and the evaluation of various experts. Several positive factors (such as financial motivation) and negative factors (such as organizational structures) were identified and are discussed in the following chapters. One effect that can be found in this context of companies’ activities and the barriers they face is the so-called “revealed effect”, which reflects a positive correlation between innovation activities and innovation barriers. The awareness of obstacles for companies increases with active engagement.68 A total of 972 observations of companies from Germany, Switzerland and Austria were evaluated and as can be seen in Figure 4, the willingness to pay for this innovation, enormous costs in development and implementation, uncertainty regarding the business and political conditions were rated as the most important factors.3
4.1 Internal Barriers
On the supplier side, green implementations and the introduction of measures can come with high costs and usually new structures and changes in the organization.31 Investments in green innovation and thus technology have a number of challenges to overcome, and there is empirical evidence that these investments tend to have a negative economic impact.69 Regulations and laws that hinder firms’ potential and ambitions towards sustainable practices, difficulties in implementation inside the organization (poor communication, questioning of procedures, resource availability, lack of technical skills) can all impose challenges. Green business models/projects also tend to be more costly and have slower growth. The sustainable impact of business practices may not always be present, measures are not designed effectively, and experience is limited. The perception and attitude of the owner towards green business practices plays a key role, because if the owner’s attitude is rather negative, this inhibits a sustainable development.65 Soltmann et al. (2015) emphasize activities in the area of green innovation pose challenges for companies because they are inherently subject to greater complexity.69 The lack of knowledge and skills is expressed through the shortage of qualified personnel, as sustainability related jobs in the IT industry demand better skilled employees.70 Stucki (2019) categorized the barriers as supply-side factors, policy and demand-side factors.3
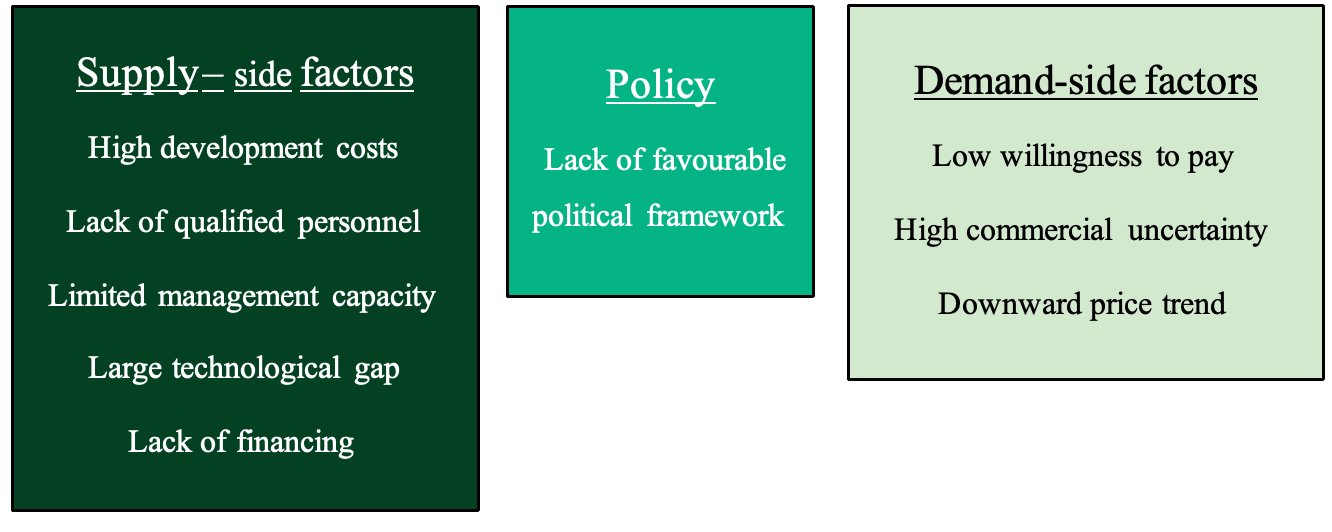
Not yet explained were the limited capacities of management, i.e. the lack of time, the lack of technical standards and the financial ability to invest. One demand-side factor is commercial uncertainty by the dependence of green products on political interactions. Another factor that slows down green innovation is the expectation of falling prices (downward price trends).3
4.2 Internal Drivers
Another perspective to look at the motivation of investments in green technology is that lower energy consumption and less expenditure to secure energy supply is related to fewer capital expenditure costs in terms of operations, for example in developing countries. To make it more feasible the change of desktops to laptops lowers the energy consumption and secures stable operation without the risk of interruption, especially in developing economic power shortages are not uncommon and can be a potential scenario37. According to Murugesan (2008) possible reasons and benefits including energy reduction, cost reduction, environmental impact and emissions, space savings, improved utilization and performance of systems, can be identified as internal drivers for green practices.32
Another internal driver is the culture and structure of the organization, the commitment of the owner and conviction to create green business models. Furthermore, the attitude of employees towards green business practices is relevant and important, and strategic orientation and perceptions at top management level are also crucial.65 Stakeholders of the respective companies can be external and internal and can possibly encourage and foster sustainability within the company. Greater market competitiveness through the creation and development of green products, unique selling points, and the adoption of green practices, encourages businesses to implement and invest in green practices and structures. The potential for more profit through growing revenues, which are fed by new customers whose affiliation with the service or product can be opened with the help of green business models.65
4.3 External Barriers
Green innovation frequently faces a potential low willingness to pay on the consumer side, which is partly driven by a low relevance and total cost for energy or environmental spending, resulting in less drive to deploy sustainable strategies and technology.31 Stucki (2019) explains that the decline in environmental externalities would be reversed and that added value for society would be created if customers were willing to pay for this improvement. Another part of the consideration is the high upfront costs until green investments have fulfilled their purpose and target, contrary to the expectations and investment horizons of many investors. The preference for short-term investments is reflected in investors’ low willingness to pay for this type of green innovation.31 Uncertain markets and their economic impact on companies lead to commercial uncertainty and the frequent changes in the political situation have an inhibiting effect on green innovations and reduce planning security for companies.3 Barriers can also be seen as the absence or lack of relevant drivers. External barriers can include the lack of information and knowledge, agreement with suppliers and their business structures and generally the lack of support from the government. Adequate legislation to facilitate and foster implementation, limited and low capital are further external barriers.65 Further obstacles may be difficult or unsuitable market conditions that make it difficult for companies to incorporate all the information into their decision-making, thus making it harder for them to seize opportunities and promote greener structures and innovation.3Investments in green innovation and thus technology have a number of challenges to overcome, and empirical evidence shows that these investments tend to have a negative economic impact.69
4.4 External Drivers
A possible external driver for green IT offerings is the approach via green taxes and regulations, i.e. regulatory measures that drive consumers more towards green IT solutions.32 External drivers can also be of a financial nature, for example if it is recognized or given that customers are willing to pay more for a certain level of sustainability in the value chain or in the service/product, which in turn leads to an adjustment of processes and structures in the industry or company. Better conditions for loans from banks or other lenders and more favorable taxation to implement or develop greener business practices also promote sustainable development.
On the other side social drivers are the strongest according to Aghelie (2017). For example, improvements in the public image of companies in relation to the environment. Additional drivers, which can be directly understood as a fundamental development, are the public’s understanding and perception of sustainable activities as well as the work of public authorities to encourage companies to be socially and environmentally responsible. Appropriate further education and training opportunities for more sustainable business structures also promote this development.65Horbach (2008) finds that the drivers for green and non-green innovation are almost the same, except for environmental policy, which can be defined as a clear driver for green innovation.71
5 Recommendations
One of the challenges will be to support developing countries to join the global ICT market. Improvements and developments in ICT following a change in economic structures towards more service-oriented offers and less energy-intensive work and processes can be the key to a more sustainable environment.33 By disseminating and collecting data at regional, local or international level, a first step has been taken towards improving conditions, recognizing and exploiting new potential. The path towards greater sustainability in processes, products and the entire company can be achieved by improving efficiency through the use of new and innovative technologies.31 The fundamental aim of improving efficiency through IT sector products can be seen as one of the primary objectives, which can be achieved through, among other things, better data collection, more flexible adaptation to the circumstances or savings in the respective resources through more precise calculations.31
The opportunities to drive the digitization forward, save paper and documents in physical form, make data and services accessible and disseminated in a barrier-free, cost- and resource-saving manner are ways to achieve sustainable structures. Hilty (2011) explains that the influences of ICT in the form of substitutions or improvements produce the greatest and most innovative solutions when resources are limited. This can be stimulated, for example, by effective climate policy and similar limitations. One point of criticism that has already been considered is the rebound effect of ICT. Structural changes through the right political decisions and regulations are crucial to counteract rebound effects. It requires strong incentives like in mobile computing through limited space and size in relation to battery technology, which results in more efficient hardware, optimized software and further innovations. Under the right incentives, limitations and political conditions, ICT can contribute to climate protection through the use of immaterial and intelligent solutions.30 Soltmann et al. (2015) advise that a predictable policy with clear rules should be created to minimize and overcome barriers.69 The structural change of the industry (lower energy consumption), an encouragement of the participation of developing countries in the global ICT market and the promotion of the development of ICT for sustainable development are therefore expedient.33
Appiah-Otoo, I. & Song (2021) recommend reducing the costs of internet and mobile phones in low-income countries to promote and encourage ICT in these countries in particular. Furthermore, it is important that political stability is maintained and preserved, that corruption is kept at the lowest possible level, and that a legal system is in place and works.16 Masanet et al. (2020) also describe that efficiency improvements are subject to limits and that political intervention and investment are needed to regulate increasing energy consumption. It cannot be guaranteed that less efficient end devices and components will be replaced.47 Trends such as AI, Big Data, Data Science, IoT and Blockchain can help to reduce emissions, but they also contribute to the industry’s emissions. The world’s information and data doubles every two years. IoT, for example, requires multiple sensors and multiple analyses for data collection and thus also leads to more emissions.35 Freitag et al. (2021) explain that ICT has become significantly more efficient, ICT accounts for a significant share of total GHG emissions and improvements in effectiveness and productivity are neccesary. Emissions in the industry could continue to rise and its difficult for the industry to regulate itself and reduce emissions. Therefore, it is essential that politicians also adopt measures that ensure more commitment and contribute to a positive development, and not just assume that ICT saves more emissions than it produces. This could be realized, for example, by discussing emissions and setting a carbon cap for extraction. It remains important to understand the potential and situation and all the effects triggered in and by this sector.
6 Conclusion
Before a final word is introduced here, it is first a matter of critically classifying this work. This topic and research cannot be seen as completed due to current results and developments and indicates that due to the depth of the individual topics, not all details and information could be recorded and examined. Additional evaluations focusing on trends, drivers and obstacles are areas that would deepen this work further. Furthermore, it should be said that the approach to working with current reports and, if necessary, gray literature can be optimized. Continuing to use more well-founded literature based on this work and keeping in mind that a certain type of report and estimates are also influenced by the respective author helps to classify the information and draw the right conclusions.
There are several opportunities to promote more sustainable development with the help of ICT. Production, use and disposal of ICT in the IT industry have a negative influence on the environment. And it will be important to describe and evaluate in detail with a holistic approach and to include all effects. The potential offered by strategies, technologies and concepts such as Green IT may provide considerable added value. In conclusion, the initial research question of what sustainability looks like in the IT industry and what possibilities, opportunities or effects can be determined with the filled topics and gained knowledge. Even if ICT has great potential in all directions and has a positive influence on the economy and emissions, this development must be accompanied with caution and there are some current and future obstacles. Rebound effects are not uncommon and trends should not be underestimated. It can therefore be said that many opportunities are open, to the extent that the conditions and willingness are in place. Another important factor will be to adapt and shape political conditions in such a way that they promote the best possible outcome rather than slowing or stopping it. Therefore, the role of politics, in addition to the potential of the IT industry, will be crucial and should give clearer regulations regarding emission limits and emission taxes.
References
- Panayotou, T. Empirical tests and policy analysis of environmental degradation at different stages of economic development. (1993). https://doi.org/doi.org/10.18574/nyu/9781479862689.003.0018
- Hilty, L. M. Information Technology and Sustainability. Essays on the Relationship between ICT and Sustainable Development,
<https://www.researchgate.net/publication/301660679_2008_Hilty_ICT_and_Sustain ability_Chapters_1_2>(2008).
- Stucki, T. What hampers green product innovation: the effect of experience. Industry and Innovation 26, 1-29 (2019). https://doi.org/10.1080/13662716.2019.1611417
- Udo de Haes, H. A. v. R., Martijn. Life Cycle Approaches: The road from analysis to practice, <http://www.uneptie.org/pc/sustain/lcinitiative> (2005).
- Daum, M. IT-Dienstleistungsbranche: Die Branche, ihre Unternehmen und Beschäftigten im Zentrum der digitalen Transformation, <https://www.inputconsulting.de/files/inpcon–DATA/download/IT–Branchenanalyse–INPUT–2016final.pdf> (2016).
- Umlai, M. ICT sector, digitization and environmental sustainability: A systematic review of the literature from 2000 to 2022. Renewable and Sustainable Energy Reviews 184 (2023). https://doi.org/10.1016/j.rser.2023.113482
- Daum, M. IT-Dienstleistungsbranche: Die Branche, ihre Unternehmen und Beschäftigten im Zentrum der digitalen Transformation. (2016).
- Stolterman, E. & Fors, A. C. Information Technology and the Good Life,<https://www.rouge.gr.jp/~fuku/toys/japan–dx/images/Stolterman.pdf> (2004).
- Rajaraman, V. Introduction to information technology,
<https://www.academia.edu/15328518/Introduction_To_Information_Technology> (2018).
- Pradhan, R. P., Mallik, G. & Bagchi, T. P. Information communication technology (ICT) infrastructure and economic growth: A causality evinced by cross-country panel data. IIMB Management Review 30, 91-103 (2018). https://doi.org/10.1016/j.iimb.2018.01.001
- Moore, G. E. Cramming more components onto integrated circuits, Reprinted from
Electronics, volume 38, number 8, April 19, 1965, pp.114 ff. IEEE Solid-State
Circuits Society Newsletter 11, 33-35 (2006). https://doi.org/10.1109/NSSC.2006.4785860
- Czernich, N., Falck, O., Kretschmer, T. & Woessmann, L. Broadband infrastructure and economic growth. The Economic Journal 121, 505-532 (2011). https://doi.org/10.1111/j.1468–0297.2011.02420.x
- Stanley, T. D., Doucouliagos, H. & Steel, P. Does ICT generate economic growth? A meta‐regression analysis. Journal of economic surveys 32, 705-726 (2018). https://doi.org/10.1111/joes.12235
- Myovella, G., Karacuka, M. & Haucap, J. Digitalization and economic growth: A comparative analysis of Sub-Saharan Africa and OECD economies.
Telecommunications Policy 44, 101856 (2020). https://doi.org/https://doi.org/10.1016/j.telpol.2019.101856
- Nguyen, T. T., Pham, T. A. T. & Tram, H. T. X. Role of information and communication technologies and innovation in driving carbon emissions and economic growth in selected G-20 countries. Journal of Environmental Management 261, 110162 (2020). https://doi.org/https://doi.org/10.1016/j.jenvman.2020.110162
- Appiah-Otoo, I. & Song, N. The impact of ICT on economic growth-Comparing rich and poor countries. Telecommunications Policy 45, 102082 (2021). https://doi.org/https://doi.org/10.1016/j.telpol.2020.102082
- Adeleye, B. N. & Chiamaka, E. Evaluation of ICT Development and Economic Growth in Africa. NETNOMICS Economic Research and Electronic Networking 20
(2019). https://doi.org/10.1007/s11066–019–09131–6
- Toader, E., Firtescu, B. N., Roman, A. & Anton, S. G. Impact of information and communication technology infrastructure on economic growth: An empirical assessment for the EU countries. Sustainability 10, 3750 (2018). https://doi.org/10.3390/su10103750
- Gordon, R. J. Does the “New Economy” Measure Up to the Great Inventions of the Past? Journal of Economic Perspectives 14, 49–74 (2000). https://doi.org/10.1257/jep.14.4.49
- Kuznets, S. in The gap between rich and poor 25-37 (Routledge, 2019).
- Grossman, G. M. & Krueger, A. B. Environmental impacts of a North American free trade agreement,
<https://www.nber.org/system/files/working_papers/w3914/w3914.pdf> (1991).
- von Carlowitz, H. C. & Irmer, K. Sylvicultura oeconomica: Anweisung zur wilden Baum-Zucht. (TU, Bergakad., 2000).
- Lynn, T., Rosati, P., Kreps, D. & Conboy, K. Digital Sustainability: Leveraging
Digital Technology to Combat Climate Change,
<https://www.researchgate.net/publication/383646549_Digital_Sustainability_Leveraging_Digital_Technology_to_Combat_Climate_Change> (2024).
- Norford, L. K., Rabl, A., Harris, J. P. & Roturier, J. The sum of megabytes equals gigawatts: Energy consumption and efficiency of office PC’s and related equipment, <https://escholarship.org/uc/item/3mh598n1>(1988).
- (UNEP), U. d. V. N. Basel Konvention: Übereinkommen über die Kontrolle der grenzüberschreitenden Verbringung gefährlicher Abfälle und ihrer Entsorgung, <https://www.basel.int/> (1989).
- Brundtland, G. H. Our Common Future: Report of the World Commission on Environment and Development. (1987).
- Hilty, L. & Hercheui, M. ICT and Sustainable Development, <https://inria.hal.science/hal–01054793/document>(2010).
- Hilty, L. & Aebischer, B. ICT for Sustainability: An Emerging Research Field, <https://www.researchgate.net/publication/263371416_ICT_for_Sustainability_An_Emerging_Research_Field> (2015).
- Koomey, J., Berard, S., Sanchez, M. & Wong, H. Implications of Historical Trends in the Electrical Efficiency of Computing. IEEE Annals of the History of Computing 33,
46-54 (2011). https://doi.org/10.1109/MAHC.2010.28
- Hilty, L., Lohmann, W. & Huang, E. Sustainability and ICT – An overview of the field. Politeia XXXVII, 3-12 (2011). https://doi.org/10.5167/uzh–55640
- Fischer, M. et al. Sustainable business: managing the challenges of the 21st century, <https://www.researchgate.net/publication/370853144_Sustainable_Business_Managing_the_Challenges_of_the_21st_Century> (2023).
- Murugesan, S. Harnessing Green IT: Principles and Practices. IT Professional 10, 24-
- (2008). https://doi.org/10.1109/MITP.2008.10
- Añón Higón, D., Gholami, R. & Shirazi, F. ICT and environmental sustainability: A global perspective. Telematics and Informatics 34, 85-95 (2017). https://doi.org/https://doi.org/10.1016/j.tele.2017.01.001
- Cornelis P. Baldé, R. K., Tales Yamamoto, Rosie McDonald, Elena D’Angelo, Shahana, Althaf, G. B., Otmar Deubzer, Elena Fernandez-Cubillo, Vanessa Forti, Vanessa Gray, Sunil, Herat, S. H., Giulia Iattoni, Deepali S. Khetriwal, Vittoria Luda di Cortemiglia, Yuliya & Lobuntsova, I. N., Noémie Pralat, Michelle Wagner (2024). THE GLOBAL E-WASTE MONITOR 2024, <https://ewastemonitor.info/the–global–ewaste–monitor–2024/?utm_source=chatgpt.com> (2024).
- Freitag, C. et al. The real climate and transformative impact of ICT: A critique of estimates, trends, and regulations. Patterns 2 (2021). https://doi.org/10.1016/j.patter.2021.100340
- NRDC. “America’s Data Centers Are Wasting Huge Amounts of Energy”,
<https://www.nrdc.org/sites/default/files/data–center–efficiency–assessment–IB.pdf> (2014).
- Khuntia, J., Saldanha, T., Mithas, S. & Sambamurthy, V. Information Technology and
Sustainability: Evidence from an Emerging Economy. Production and Operations
Management 26, 756-773 (2018). https://doi.org/10.1111/poms.12822
- Erdmann, L. & Hilty, L. M. Scenario Analysis. Journal of Industrial Ecology 14, 826-
843 (2010). https://doi.org/https://doi.org/10.1111/j.1530–9290.2010.00277.x
- Khan, F., Sana, A. & Arif, U. Information and communication technology (ICT) and environmental sustainability: a panel data analysis. Environmental Science and Pollution Research 27 (2020). https://doi.org/10.1007/s11356–020–09704–1
- Haseeb, A., Xia, E., Saud, S., Ahmad, A. & Khurshid, H. Does information and communication technologies improve environmental quality in the era of
globalization? An empirical analysis. Environmental Science and Pollution Research
- (2019). https://doi.org/10.1007/s11356–019–04296–x
- (GESI), G. e.-S. I. GeSI SMARTer2030, <https://www.gesi.org/exclusivepreview/sustainability/> (2015).
- FAO. Climate-smart agriculture case studies 2021 – Projects from around the world, <https://openknowledge.fao.org/items/13ecee03–3ac4–4b5a–9992–b217aba7831d> (2021).
- Deloite. Smart Builung Studie 2023, <https://www.deloitte.com/de/de/Industries/realestate/research/smart–building–studie.html?utm_source=chatgpt.com> (2023).
- Akande, A., Cabral, P. & Casteleyn, S. Assessing the Gap between Technology and the Environmental Sustainability of European Cities. Information Systems Frontiers
21 (2019). https://doi.org/10.1007/s10796–019–09903–3
- Wolniak, R. Smart mobility in smart city – Copenhagen and Barcelona comparision. Scientific Papers of Silesian University of Technology Organization and Management
Series 2023 (2023). https://doi.org/10.29119/1641–3466.2023.172.41
- Higón, D. A., Gholami, R. & Shirazi, F. ICT and environmental sustainability: A global perspective. Telematics and Informatics 34, 85-95 (2017). https://doi.org/10.1016/j.tele.2017.01.001
- Masanet, E., Shehabi, A., Lei, N., Smith, S. & Koomey, J. Recalibrating global data center energy-use estimates. Science 367, 984-986 (2020). https://doi.org/10.1126/science.aba3758
- Malmodin, J. & Lundén, D. The Energy and Carbon Footprint of the Global ICT and
E&M Sectors 2010–2015. Sustainability (2018). https://doi.org/10.3390/su10093027
- Avouris, N. M. & Page, B. Environmental informatics: Methodology and applications of environmental information processing,
<https://books.google.de/books?hl=de&lr=&id=qrTyCAAAQBAJ&oi=fnd&pg=PA1
&dq=environmental+informatics+avouris&ots=–O9loevbkn&sig=pV–
1NiTWaPdL0xx7MaKtXxjZN50&redir_esc=y#v=onepage&q=environmental%20informatics%20avouris&f=false> (2013).
- Gomes, C. et al. Computational sustainability: Computing for a better world and a sustainable future. Communications of the ACM 62, 56-65 (2019). https://doi.org/10.1145/3339399
- Wu, X. et al. Efficiently approximating the pareto frontier: hydropower dam placement in the Amazon basin, <https://dl.acm.org/doi/10.5555/3504035.3504139> (2018).
- Joumaa, C. & Kadry, S. Green IT: Case studies. Energy Procedia 16 (2012).
- Molla, A. Organizational Motivations for Green IT: Exploring Green IT Matrix and
Motivation Models,
<https://www.researchgate.net/publication/221229180_Organizational_Motivations_for_Green_IT_Exploring_Green_IT_Matrix_and_Motivation_Models> (2009).
- Shrivastava, P. Environmental Technologies and Competitive Advantage. Strategic
Management Journal 16, 183-200 (1995). https://doi.org/10.1002/smj.4250160923
- Molla, A. Identifying IT sustainability performance drivers: Instrument development and validation. Information Systems Frontiers 15 (2013). https://doi.org/10.1007/s10796–013–9415–z
- Kaplan, R. S. & Norton, D. P. Putting the balanced scorecard. Performance measurement, management, and appraisal sourcebook 66, 66-74 (1995).
- Hart, S. L. Beyond greening: strategies for a sustainable world. Harvard business review 75, 66-77 (1997).
- Finnveden, G. et al. Recent developments in life cycle assessment. Journal of environmental management 91, 1-21 (2009).
- Curran, M. A., Mann, M. & Norris, G. The international workshop on electricity data for life cycle inventories. Journal of cleaner production 13, 853-862 (2005). https://doi.org/10.1016/j.jclepro.2004.02.005
- ISO, I. 14040 international standard, <https://www.iso.org/standard/37456.html> (2006).
- Kaplan, R. S. The balanced scorecard as a strategic management system. Harv. Bus. Rev. 1992, 61-66 (1992).
- Van grembergen, W. The balanced scorecard and IT governance,
<https://www.researchgate.net/publication/221411772_The_balanced_scorecard_and _IT_governance> (2000).
- Wati, Y. & Koo, C. An Introduction to the Green IT balanced scorecard as a strategic IT management system, <Additional evaluations focusing on trends, drivers and obstacles are areas that would deepen this work further.> (2011).
- Neely, A. & Adams, C. Perspectives on performance: the performance prism. Centre for Business Performance, Cranfield School of Management, UK (2000). https://doi.org/10.1002/j.1936–7606.2001.tb00380.x
- Aghelie, A. Exploring drivers and barriers to sustainability green business practices within small medium sized enterprises: primary findings,. IJBEDVolume 05 Issue 1
- Mar 2017). https://doi.org/10.22164/ijbed.17.1.3
- Firms, G. C. o. I. o. S. & Bolton, J. E. Small Firms: Report of the Committee of Inquiry on Small Firms; Presented to Parliament by the Secretary of State for Trade and Industry… November 1971. (HM Stationery Office, 1971).
- Dean, T. J. & McMullen, J. S. Toward a theory of sustainable entrepreneurship: Reducing environmental degradation through entrepreneurial action. Journal of business venturing 22, 50-76 (2007). https://doi.org/10.1016/j.jbusvent.2005.09.003
- D’Este, P., Iammarino, S., Savona, M. & Von Tunzelmann, N. What hampers innovation? Revealed barriers versus deterring barriers. Research policy 41, 482-488
(2012). https://doi.org/10.1016/j.respol.2011.09.008
- Soltmann, C., Stucki, T. & Woerter, M. The Impact of Environmentally Friendly Innovations on Value Added. Environmental and Resource Economics 62, 457-479
(2015). https://doi.org/10.1007/s10640–014–9824–6
- Marzucchi, A., Consoli, D., Marin, G. & Vona, F. Do Green Jobs Differ from NonGreen Jobs in Terms of Skills and Human Capital? Research Policy 45 (2015). https://doi.org/10.1016/j.respol.2016.02.007
- Horbach, J. Determinants of environmental innovation—New evidence from German panel data sources. Research policy 37, 163-173 (2008). https://doi.org/10.1016/j.respol.2007.10.003