Authors: Rohan Manjesh and Uğur Can Murat
Edited by: –
Last updated: December 05, 2025
Executive summary
Concentrating solar power (CSP) generates electricity by using mirrors to focus direct sunlight, produce high temperatures, and run conventional turbines. Four main designs exist: parabolic trough and linear Fresnel (line-focus) and solar power towers and dish–Stirling (point-focus). CSP’s defining advantage over photovoltaic (PV) is the ease of integrating thermal energy storage (TES), which makes CSP dispatchable and valuable for evening and night supply and for balancing variable renewables.
Commercial experience is strongest for parabolic trough plants, with a long track record from the SEGS plants in California and new projects in Spain, the United States, Morocco, South Africa, China, Chile, and the United Arab Emirates. Towers reach higher temperatures and can pair efficiently with large TES systems. Linear Fresnel aims to reduce cost and complexity, while dish–Stirling offers very high conversion efficiency but remains niche and commercially limited.
Economically, CSP’s competitiveness hinges on capital costs, capacity factor, operations and maintenance (O&M), and financing. Capital costs benefit from economies of scale (typically ≥50 MW). Capacity factors have risen with broader adoption of TES and improved operating temperatures and power block flexibility. O&M costs are higher than for PV and onshore wind because CSP plants are mechanically complex (solar field, receivers, HTFs, TES, and turbines). Globally, levelized costs have fallen substantially over the past decade due to lower installed costs, larger TES, and improved performance, but continued policy support and risk‑reduction mechanisms are needed to sustain investment.
Ecologically, CSP has land and water footprints comparable to other thermal power stations. Land requirements depend on direct normal irradiance (DNI), site layout, and storage sizing; water use is dominated by cooling and mirror washing. Dry and hybrid cooling can greatly reduce water consumption at the expense of higher costs or lower efficiency, so siting and technology choice should consider local water constraints. Lifecycle greenhouse gas (GHG) emissions for CSP are low (tens of grams CO₂‑eq/kWh), concentrated in materials and construction; most steel, glass, and concrete are recyclable.
Social impacts arise across construction and supply chains. Tools like the Social Hotspot Database (SHDB) help identify risks around labor rights, worker safety, and unemployment. Project developers should integrate mitigation measures—local hiring and training, fair labor practices, and community engagement—into procurement and construction. Policymakers can accelerate deployment and innovation through auctions with dispatchability incentives, time‑of‑day bonuses, and feed‑in tariffs designed for firm capacity, complemented by RD&D plants in high‑resource regions and support for first‑of‑a‑kind designs.
1 Description and history
Concentrating Solar Power (CSP) technologies are renewable energy systems designed to generate clean electricity by focusing sunlight to produce high temperatures, which then drive conventional power generators. The worsening global warming and depleting fossil fuel reserves make the switch to renewable technologies like CSP an urgent need. CSP technologies are technically and commercially proven and can be hybridized with fossil fuels or integrated with storage systems for continuous operation.
1.1 Description of CSP technologies
A Concentrating Solar Power Plant (CSPP) typically consists of a solar field and a power block. The solar field contains arrays of concentrators (mirrors) that reflect and concentrate the sun’s heat onto a receiver to produce heat at medium (400-550 °C) or high (600-1000 °C) temperatures. This heat is then transferred to a fluid (such as thermal oil, molten salt, water, air, hydrogen, or helium) that drives conventional generators in the power block to produce electricity. Some CSPP designs can integrate storage systems to generate electricity during cloudy periods or after sunset, and they can also be hybridized with fossil fuels for 24-hour operation.
There are four main CSP technologies that have been used worldwide:
- Parabolic Trough Collector (PTC): This is a one-axis tracking technology using parabolic-shaped mirrors to focus sunlight onto a receiver tube along the focal line, producing heat at around 400-550 °C. PTC is a line focus technology.
- Linear Fresnel Collector (LFC): Another one-axis tracking technology, LFC uses flat, ground-mounted mirrors to reflect sunlight onto elevated, inverted linear fixed receivers, also a line focus technology producing heat at about 400-550 °C.
- Tower Power (TSP) / Central Receiver Technology: This two-axis tracking technology uses numerous heliostats (sun-tracking mirrors) to reflect sunlight onto a central receiver at the top of a tower, achieving high temperatures (600-1000 °C). TSP is a point focus technology.
- Stirling/Dish Technology (SDC): This also uses two-axis tracking, with a parabolic dish concentrating sunlight onto a receiver at its focal point, generating very high temperatures (above 1000 °C) to power a Stirling engine or micro-turbine directly attached to the receiver. SDC is a point focus technology.
Line focus technologies (PTC and LFC) concentrate sunlight about 100 times, while point focus technologies (TSP and SDC) concentrate it about 1000 times, leading to higher operating temperatures and potentially greater efficiency for point focus systems. However, line focus technologies are generally less expensive and technically less complex.
1.2 Historical development of CSP technologies1Baharoon, D. A., Rahman, H. A., Wan Omar, W. Z., & Fadhl, S. O. (2015). Historical development of concentrating solar power technologies to generate clean electricity effi- ciently – A review. Renewable and Sustainable Energy Reviews, 41, 996–1027. http://dx.doi.org/10.1016/j.rser.2014.09.008
1.2.1 Parabolic Trough Collector (PTC):
- In 1913, the first parabolic trough system was built in Maadi, Egypt, to generate steam for a 73 kW pump used for irrigation. Captain John Ericsson had earlier invented a solar powered hot air engine using a parabolic concentrator in 1864.
- After 1913, Sandia National Laboratories in the U.S. sponsored PTC development. Large-scale development for industrial process heat (IPH) applications began in the mid-1970s.
- In the 1980s, the International Energy Agency (IEA) constructed the SSPS/DCS project in Spain, using different types of parabolic trough collectors.
- Luz International Limited developed a parabolic trough module for IPH based on the DOE/Sandia and SSPS projects.
- The first commercial CSP plant worldwide, SEGS I (14 MWe), using PTC technology, was built by Luz in California and began operation in 1984. The capacity of the SEGS plants increased to 354 MWe by 1990. SEGS I and II are considered the first stage in proving the commercial viability of trough technology.
1.2.2 Linear Fresnel Collector (LFC):
- The principle of LFC was developed by Baum et al. in 1957.
- Giorgio Francia designed both linear and two-axis tracking Fresnel reflectors and built the first LFC prototype at Lacédémone–Marseilles solar station, which was tested in 1964 and generated steam.
- Belgian company Solarmundo built a 2500 m² prototype in 2001. Solarmundo later merged with Solar Power Group, Germany, who built a pilot LFC system named Fresdemo in Spain.
1.2.3 Tower Solar Power (TSP):
- The earliest solar tower power plant demonstrated was EURELIOS in Adrano, Sicily, Italy, in 1965, generating 1 MWe. Construction by a European consortium was completed in 1980.
- The ability to generate large-scale electricity (10 MWe) was demonstrated by the Solar One plant built in California, U.S., in 1982.
- The Solar Two plant, an upgrade of Solar One, demonstrated the use of molten salt as a heat transfer and storage medium, operating from June 1996 to 1999.
- The first water/steam receiver tower plant under a pure commercial approach, Planta Solar 10 (PS10), was built by Abengoa Solar in Sevilla, Spain, and began operation in 2007.
1.2.4 Stirling/Dish Technology (SDC):
- Developed and demonstrated in the late 1970s and early 1980s by companies like United Stirling AB and Advanco Corporation.
- Advanco’s Vanguard system in Southern California (1982-1985) achieved a net conversion efficiency of 29.4% but experienced technical problems.
- In 1984, Schlaich-Bergermann und Partner operated two 50 kWe Stirling dish engines in Saudi Arabia.
- Stirling Energy Systems (SES) developed the SunCatcher™ system, and a prototype achieved a net solar-to-grid conversion efficiency of 31.25% in 2008.
- The first demonstrated plant composed of 60 SunCatcher™ units (1.5 MWe) was built in Arizona in 2009, but it was later decommissioned.
PTC is currently the most technically and commercially successful CSP technology, with a long history of operation in commercial projects. While other technologies like LFC and TSP are also advancing and being deployed, SDC, despite its high efficiency, remains commercially unavailable due to cost. There is a current trend towards employing non-PTC technologies in future projects due to improvements in their performance.
2 Economic performance
The recent 6th IPCC Assessment Report strongly indicates that if significant and rapid reductions in greenhouse gas emissions across all sectors do not occur, the goal of capping global warming at 1.5°C is now beyond reach.2Masson-Delmotte V, et al. Climate change 2021: the physical science basis,” Contribution of working group I to the sixth assessment report of the intergovernmental panel on climate change. 2021. p. 2. To achieve this temperature goal, a global transition to more sustainable production and consumption systems is already underway, particularly within the energy sector, where solar photovoltaic (PV) and wind energy represented 12% of global electricity generation in 2022, a substantial rise from just 0.6% in 2007.3Wiatros-Motyka M. Global electricity review 2023. London, UK: Ember; 2023 Online. Available: https://ember-climate.org/app/uploads/2023/04/Globa l-Electricity-Review- 2023.pdf. Notably, over 80% of all new power-generating capacity installed in 2020 was derived from renewable energy sources.4IRENA. World adds record new renewable energy capacity in 2020. Abu Dhabi, UAE: International Renewable Energy Agency (IRENA); Apr. 2021 Online. Available: https://www.irena.org/News/pressreleases/2021/Apr/World-Adds- Record-New-Renewable- Energy-Capacity-in-2020. Accessed 5 January 2025. The sharp increase in natural gas and coal prices during the years 2021- 2022 has further diminished the appeal of fossil fuels, making solar and wind energy more attractive.5IRENA. Renewable power generation costs in 2021. Abu Dhabi: International Renewable Energy Agency; 2022 Online. Available: https://www.irena.org/ -/me- dia/Files/IRENA/Agency/Publication/2022/Jul/IRENA_Power_Generatio n_Costs_2021.pdf. However, the variability of renewable energy sources such as solar and wind presents challenges for maintaining grid stability, as unexpected weather changes can significantly affect their energy production. As a result, the increasing share of intermittent renewable energy from sources like wind and solar PV raises concerns about the electricity grid’s stability, given their unpredictable generation that fluctuates with weather changes. Although non-dispatchable renewable systems aim to replace fossil fuel consumption, a higher share of variable generation introduces challenges, including the need for additional backup capacity, increased curtailments, and greater overall system costs.6ESTELA. The value of solar thermal electricity: cost vs. Value approach. Brussels, Bel- gium: European Solar Thermal Electricity Association; 2016 Online. Available: https://www.estelasolar.org/Docs/2016_ESTELA_STE-CSP_Value_ Final.pdf. For instance, a heightened dependency on non-dispatchable renewables necessitates the construction of more conventional backup power plants, such as gas and coal, which leads to greater curtailments and consequently elevated electricity prices due to the increased expenses of the entire energy system.7Ford J. “Nuclear is less costly than you think,” Financial Times. 2024 Online. Available: https://www.ft.com/content/1859ab32-2230-11e9-8ce6-5db4543 da632. Accessed 13 March 2024.8Mount TD, Maneevitjit S, Lamadrid AJ, Zimmerman RD, Thomas RJ. The hidden system costs of wind generation in a deregulated electricity market. Energy J 2012;33(1):161–86.9Weigt H. Germany’s wind energy: the potential for fossil capacity replacement and cost saving. Appl Energy Oct. 2009;86(10):1857–63. https://doi.org/ 10.1016/j.apen- ergy.2008.11.031. Nonetheless, this problem can be mitigated by enhancing the ratio of dispatchable renewables in the energy mix. The shift toward a low-carbon economy is expected to significantly increase the demand for energy storage solutions to manage the unpredictability of renewable sources like solar PV and wind. Concentrated solar power (CSP), combined with thermal energy storage (TES), can efficiently meet both the intermittency and storage demands by providing dispatchable renewable electricity. CSP is considered one of the most promising technologies for improving renewable energy systems to enable rapid decarbonization of the electricity sector toward scenarios featuring extensive renewable energy deployment.10Rahman A, Farrok O, Haque MM. Environmental impact of renewable energy source based electrical power plants: solar, wind, hydroelectric, biomass, geothermal, tidal, ocean, and osmotic. Renew Sustain Energy Rev 2022;161: 112279.11Wang W, Fan L, Laumert B. A theoretical heat transfer analysis of different indirectly-irradiated receiver designs for high-temperature concentrating solar power applications. Re- new Energy 2021;163:1983–93.12Liu Q, Barker R, Wang C, Qian J, Neville A, Pessu F. The corrosion behaviour of stain- less steels and Ni-based alloys in nitrate salts under thermal cycling conditions in concen- trated solar power plants. Sol Energy Jan. 2022;232:169–85. https://doi.org/10.1016/j.solener.2021.12.072.13Calvet N, et al. Dispatchable solar power using molten salt directly irradiated from above. Sol Energy 2021;220:217–29.14Khamlich I, et al. Technical and economic assessment of thermal energy storage in con- centrated solar power plants within a spot electricity market. Renew Sustain Energy Rev Apr. 2021;139:110583. https://doi.org/10.1016/j. rser.2020.110583.15Hahn Menacho AJ, Rodrigues JFD, Behrens P. A triple bottom line assessment of con- centrated solar power generation in China and Europe 2020–2050. Renew Sustain Energy Rev Oct. 2022;167:112677. https://doi.org/10.1016/j. rser.2022.112677.16Kondaiah P, Pitchumani R. Novel textured surfaces for superior corrosion mitigation in molten carbonate salts for concentrating solar power. Renew Sustain Energy Rev Dec. 2022;170:112961. https://doi.org/10.1016/j. rser.2022.112961. A distinctive aspect of CSP that sets it apart from other renewable technologies is its inherent compatibility with large-scale thermal energy storage and hybrid fossil fuel systems. This interconnection enhances the technology’s resilience to natural variations in solar irradiance, thereby ensuring consistent power outputs, which are crucial for the smooth incorporation of solar electricity into the grid.17Stram BN. Key challenges to expanding renewable energy. Energy Pol 2016;96: 728– 34. Incorporating thermal energy storage into CSP facilities boosts their dispatchability without substantially increasing the levelized cost of electricity in comparison to CSP facilities without storage capabilities.18Lilliestam J, Bielicki JM, Patt AG. Comparing carbon capture and storage (CCS) with concentrating solar power (CSP): Potentials, costs, risks, and barriers. Energy Pol Aug. 2012;47:447–55. https://doi.org/10.1016/j.enpol.2012.05.020.19Mehos M, Turchi C, Jorgenson J, Denholm P, Ho C, Armijo K. On the path to SunShot- advancing concentrating solar power technology, performance, and dispatchability. EERE Publication and Product Library; 2016. This enhancement strengthens CSP’s potential as a vital method for generating dispatchable renewable electricity. The ability to provide on-demand power makes CSP particularly suitable for large-scale electricity generation, which is especially beneficial for balancing the variability of other renewable sources such as wind and solar PV. Numerous strategic forecasts highlight CSP’s essential role in crafting net-zero energy systems. In support of this, the ‘Net Zero by 2050’ report from the IEA, featuring strategies for climate change mitigation, emphasizes the urgency of achieving CO2 elimination to confine global warming below 2◦C by the end of the century. Hence, alongside the transition to renewable energy sources, it is vital to consider the heat requirements for removing CO2 from the atmosphere. CSP’s unique solar thermal characteristics enable it to effectively realize high capture and regeneration thermochemistry, allowing it to play a significant role in reducing atmospheric CO2. The International Energy Agency (IEA) predicts substantial growth in CSP, estimating capacities of 73 GW, 281 GW, and 426 GW by the years 2030, 2040, and 2050, respectively.20Agency IE. Net Zero by 2050: a roadmap for the global energy sector. Paris, France: IEA; 2021. Moreover, the International Renewable Energy Agency (IRENA) expects CSP capacity to increase to a range of 52–83 GW by 2030.21Irena AD. REmap 2030: a renewable energy roadmap. 2014. The economic viability of concentrating solar power (CSP) plants is a crucial factor for their acceptance and large-scale deployment. Key economic elements influencing the competitiveness of CSP include initial capital costs, capacity factors, maintenance and operational expenses (O&M), and the levelized cost of electricity (LCoE).22Khan, M.I., Gutiérrez-Alvarez, R., Asfand, F., Bicer, Y., Sgouridis, S., Al-Ghamdi, S.G., Jouhara, H., Asif, M., Kurniawan, T.A., Abid, M., Pesyridis, A. and Farooq, M. (2024) ‘The economics of concentrating solar power (CSP): Assessing cost competitiveness and deploy- ment potential’, Renewable and Sustainable Energy Reviews, 200, p.114551. Available at: https://doi.org/10.1016/j.rser.2024.114551.

2.1 The capital costs
CSP plant capital costs include the initial investment required for site development, technology components like power blocks, mirrors and receivers, and the balance of plant, as well as enineering, procurement, and construction activities. Capacity-based capital costs are the total installation costs for each unit of power capacity, expressed in dollars per kilowatt ($/kW). Component prices, plant size, location, and storage time are some of the variables that impact CSP capital costs. As opposed to solar PV, CSP is heavily impacted by economies of scale and works best for large-scale generation (usually ≥50 MW) to reduce energy production costs. However, this requires relatively high capital investments and financial risks, in part because the technology is more complex and not everyone can handle it. The adoption of CSP was limited in its early stages of commercialization because it was frequently not cost-effective to incorporate thermal energy storage. However, nearly all proposed and operational CSP plants have multiple hours of thermal storage since around 2015, enabling dispatchable electricity generation at night and in the evening. Nowadays, adding thermal storage is thought to be a financially feasible way to increase capacity factors, improve utilization and project economics, and provide more scheduling flexibility for generation. The typical thermal storage capacity for commissioned CSP facilities surged dramatically from 3.5 hours in 2010 to 11 hours by 2020.23IRENA. Renewable power generation costs in 2022. Abu Dhabi, UAE: International Re- newable Energy Agency (IRENA); 2023 [Online]. Available: https ://www.irena.org/Publica- tions/2023/Aug/Renewable-Power-Generation-Costs -in-2022.5IRENA. Renewable power generation costs in 2021. Abu Dhabi: International Renewable Energy Agency; 2022 Online. Available: https://www.irena.org/ -/me- dia/Files/IRENA/Agency/Publication/2022/Jul/IRENA_Power_Generatio n_Costs_2021.pdf.24IRENA. Renewable power generation costs in 2020. Abu Dhabi, UAE: International Re- newable Energy Agency; 2021 [Online]. Available: https://www. irena.org/publica- tions/2021/Jun/Renewable-Power-Costs-in-2020. Recent projects in China have an average storage capacity of around 9 hours. Given these developments, it is expected that nearly all forthcoming CSP projects worldwide will feature considerable thermal energy storage.25Lilliestam, J., Barradi, T., Caldés, N., Gomez, M., Hanger, S., Kern, J., Komendantova, N. Mehos, M., Hong, W., Wang, Z., Patt, A. (2018): Policies to keep and expand the option of concentrating solar power for dispatchable electricity, in: Energy Policy 116, pp. 193-197 http://dx.doi.org/10.1016/j.enpol.2018.02.014.
2.2 The capacity factor
When evaluating the economic feasibility of CSP facilities, capacity factors are an essential factor. The capacity factor of a CSP facility reflects the ratio of its average annual output to the theoretical maximum annual output, provided that it maintains a full-scale rating capacity during the year. Greater capacity means better plant use and better financial sustainability. Because operating for more hours, fixed capital expenditures are spread over larger amounts of electricity generated, resulting in lower linear electricity costs (LCoEs). Power factors are influenced by the characteristics of solar resources, including the existence of normal direct radiation (DNI), daily and seasonal patterns, energy block reliability, and thermal energy storage (TES). By enabling electricity generation beyond sunset, TES strengthens the capacity factors of the CSP plant. In general, higher capacity factors have a positive effect on the economics of the CSP by increasing energy production without additional capital costs. As capacity factors improve due to technological advances, LCoE values are significantly decreasing.22Khan, M.I., Gutiérrez-Alvarez, R., Asfand, F., Bicer, Y., Sgouridis, S., Al-Ghamdi, S.G., Jouhara, H., Asif, M., Kurniawan, T.A., Abid, M., Pesyridis, A. and Farooq, M. (2024) ‘The economics of concentrating solar power (CSP): Assessing cost competitiveness and deploy- ment potential’, Renewable and Sustainable Energy Reviews, 200, p.114551. Available at: https://doi.org/10.1016/j.rser.2024.114551.
The global average capacity factors for Concentrated Solar Power (CSP) increased from 30% in 2011 to 50% in 2021, representing a 66% rise over the ten-year span. This improvement can be primarily linked to the enhanced use of thermal energy storage (TES), which allows for energy production to be adjusted to periods of heightened electricity demand or value. Over the last decade, the decrease in costs associated with thermal energy storage and advancements in operating temperatures have significantly contributed to making CSP more economically viable. Looking ahead, the average capacity factor for new CSP systems is projected to reach 60% by 2030, fueled by continuous enhancements in TES, power block flexibility, and solar field performance. Ongoing efforts to improve thermal capacity factors through better optical efficiency, cutting-edge receiver coatings, improved heat transfer fluids, and effective management of the solar field will also be vital for achieving these ambitious targets in a cost-effective way.22Khan, M.I., Gutiérrez-Alvarez, R., Asfand, F., Bicer, Y., Sgouridis, S., Al-Ghamdi, S.G., Jouhara, H., Asif, M., Kurniawan, T.A., Abid, M., Pesyridis, A. and Farooq, M. (2024) ‘The economics of concentrating solar power (CSP): Assessing cost competitiveness and deploy- ment potential’, Renewable and Sustainable Energy Reviews, 200, p.114551. Available at: https://doi.org/10.1016/j.rser.2024.114551.
2.3 Operations and maintenance costs (O&M)
The expenses associated with operation and maintenance (O&M) are crucial for assessing the overall financial feasibility of CSP plants. In comparison to other renewable energy technologies such as solar photovoltaics (PV) and onshore wind, CSP O&M costs are significantly higher, both in absolute terms and as a percentage of operating costs. The elevated O&M expenses can be attributed to the increased mechanical and operational complexity found in CSP systems, which consist of extensive arrays of mirrors, heat transfer systems, thermal storage, and conventional turbine generators. However, with the maturation of the industry, O&M expenses have decreased due to enhanced designs and increased economies of scale. The total O&M expenditures for a CSP facility include all the ongoing costs necessary to run and maintain the plant throughout its operational lifespan. These expenditures cover routine maintenance for solar field mirrors, receivers, heat transfer fluid systems, thermal energy storage, the power block, and other aspects of the plant. There are additional costs linked to staffing for plant operations, insurance, spare parts inventory, and the periodic refurbishment or replacement of components. Generally, O&M costs comprise both fixed and variable elements that correlate with the net generating capacity and the annual electricity output of the facility. Key factors that affect O&M costs for specific CSP projects include the type of solar field technology (for example, PTC, SPT, or LFR), the quality of solar resources and the annual Direct Normal Irradiance (DNI) at the site, the hours of thermal energy storage capacity, the type of power block (whether steam turbine or combined cycle), plant capacity and design intricacy, local labor costs for operational and maintenance staff, and the development level of the regional CSP supply chain and O&M expertise.22Khan, M.I., Gutiérrez-Alvarez, R., Asfand, F., Bicer, Y., Sgouridis, S., Al-Ghamdi, S.G., Jouhara, H., Asif, M., Kurniawan, T.A., Abid, M., Pesyridis, A. and Farooq, M. (2024) ‘The economics of concentrating solar power (CSP): Assessing cost competitiveness and deploy- ment potential’, Renewable and Sustainable Energy Reviews, 200, p.114551. Available at: https://doi.org/10.1016/j.rser.2024.114551.
In Europe, the yearly costs for operation and maintenance (O&M) typically range between 25 and 35 dollars per kilowatt. These O&M costs greatly impact the overall levelized cost of electricity (LCoE) for a concentrated solar power (CSP) project, often accounting for approximately 18-20% of the total expenses. This proportion is 2-4 times higher than the O&M share observed in solar photovoltaic (PV) or onshore wind energy initiatives. Recognizing the importance of this cost element is crucial when assessing competitiveness. Reducing O&M expenses is essential for lowering the LCoE of CSP. A decrease of 20% in O&M costs could elevate the internal rate of return on CSP projects from 11.4% to 13.4%, contingent on the specific technology used, such as parabolic trough collectors (PTC), solar power towers (SPT), or linear Fresnel reflectors (LFR).22Khan, M.I., Gutiérrez-Alvarez, R., Asfand, F., Bicer, Y., Sgouridis, S., Al-Ghamdi, S.G., Jouhara, H., Asif, M., Kurniawan, T.A., Abid, M., Pesyridis, A. and Farooq, M. (2024) ‘The economics of concentrating solar power (CSP): Assessing cost competitiveness and deploy- ment potential’, Renewable and Sustainable Energy Reviews, 200, p.114551. Available at: https://doi.org/10.1016/j.rser.2024.114551.
2.4 The levelized cost of electricity (LCoE)
The levelized cost of electricity (LCoE) has become an important financial metric for evaluating and comparing different electricity generation technologies. LCoE represents the cost per kilowatt-hour linked to the development and functioning of a power facility over its entire operational life. This metric facilitates an easy comparison of technologies that have varying cost structures, operational lifetimes, energy outputs, and production patterns. It reflects the returns needed for an investor to reach the breakeven point. Reduced LCoE values signify enhanced economic competitiveness. The LCoE of CSP facilities is influenced by various critical factors.22Khan, M.I., Gutiérrez-Alvarez, R., Asfand, F., Bicer, Y., Sgouridis, S., Al-Ghamdi, S.G., Jouhara, H., Asif, M., Kurniawan, T.A., Abid, M., Pesyridis, A. and Farooq, M. (2024) ‘The economics of concentrating solar power (CSP): Assessing cost competitiveness and deploy- ment potential’, Renewable and Sustainable Energy Reviews, 200, p.114551. Available at: https://doi.org/10.1016/j.rser.2024.114551.
- The initial capital costs encompass site preparation, procurement of components, installation of the system, connection to the grid, and financing expenses.
- The plant’s efficiency in converting sunlight into electricity and its capacity factor.
- The direct normal irradiance (DNI) present at the project location.
- Ongoing expenses for operations and maintenance, in addition to insurance costs throughout the plant’s service life.
- Financial considerations such as capital costs, project timeline, and available incentives.
These elements collectively influence the competitiveness of CSP-generated electricity compared to other energy generation technologies. Reducing capital costs, improving plant performance, choosing sites with optimal sunlight exposure, and securing favorable financing are crucial for minimizing the LCoE of CSP initiatives.
Globally, the average levelized cost of electricity (LCoE) for newly constructed concentrating solar power (CSP) plants experienced a notable reduction of 67% between 2010 and 2020, falling from $0.31/kWh to $0.098/kWh. This drop can be linked to lower capital expenditures, improved capacity factors, and decreased operational and maintenance (O&M) costs. Contributing factors to this trend include continuous declines in capital costs, improved capacity factors, reductions in operational and maintenance expenses, and lower financing costs. Nevertheless, the progress of CSP in achieving these ambitious LCoE targets will necessitate appropriate policies and incentives to support continuous development.22Khan, M.I., Gutiérrez-Alvarez, R., Asfand, F., Bicer, Y., Sgouridis, S., Al-Ghamdi, S.G., Jouhara, H., Asif, M., Kurniawan, T.A., Abid, M., Pesyridis, A. and Farooq, M. (2024) ‘The economics of concentrating solar power (CSP): Assessing cost competitiveness and deploy- ment potential’, Renewable and Sustainable Energy Reviews, 200, p.114551. Available at: https://doi.org/10.1016/j.rser.2024.114551.
The levelized costs of CSP have decreased, likely due to higher irradiance levels at newer plant sites, reduced total installed expenses, larger thermal storage systems, and enhanced capacity factors.
3 Ecological performance
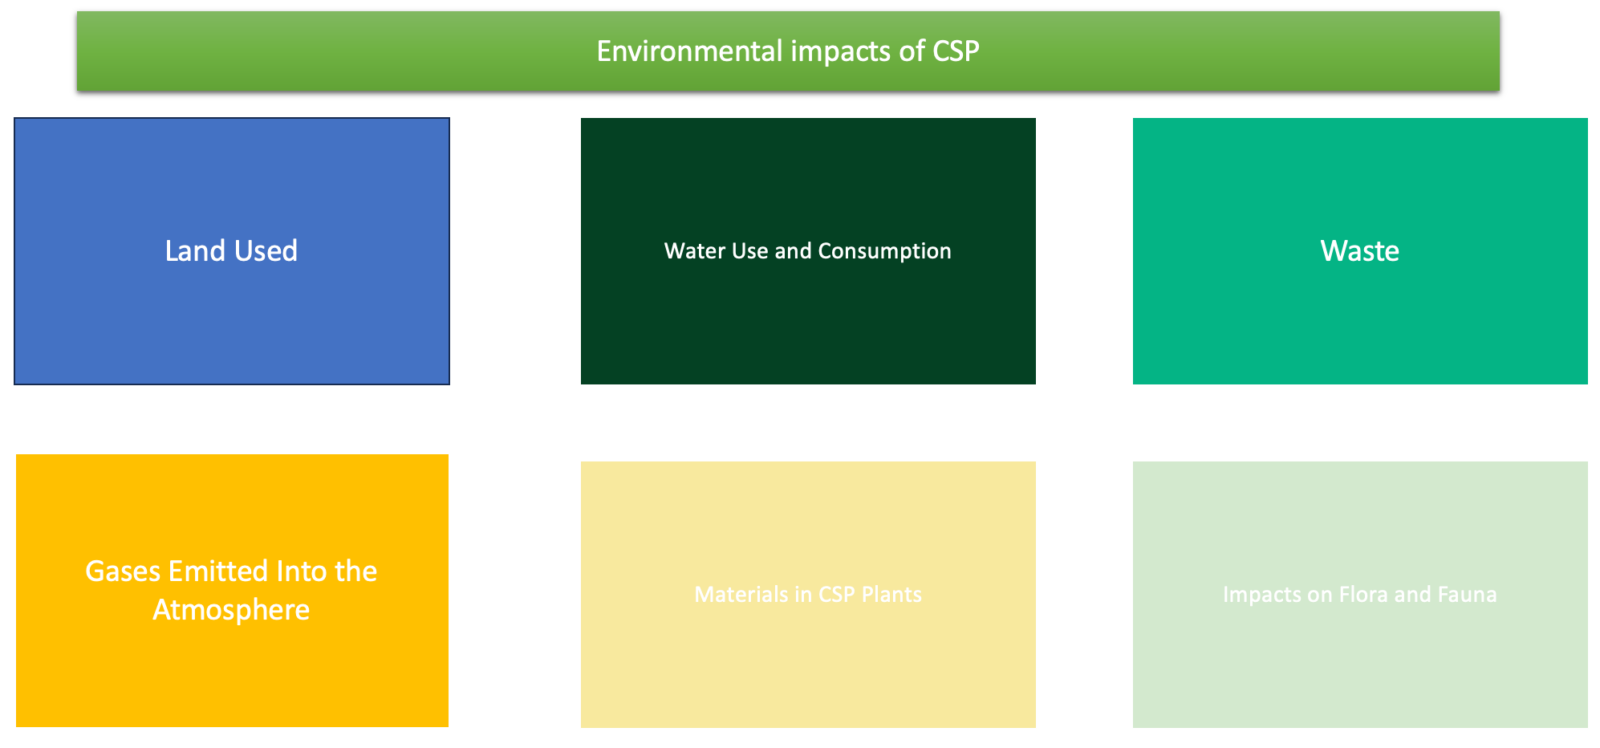
3.1 Land used
The amount of insolation has a significant impact on how solar systems are used on land. The same system may need up to three times as much land for high latitudes as for sites nearer the equator because the amount of land used at a given site decreases with increasing insolation. Around the world, CSP plants need a sizable area of land that is largely level.26Bošnjaković, M., & Tadijanović, V. (2019). Environment Impact of a Concentrated So- lar Power Plant. Technical Journal, 13(1), 68-74. https://doi.org/10.31803/tg- 20180911085644
Land-use impacts are assessed using at least three broad criteria: (1) the affected area, (2) the impact’s duration, and (3) the impact’s quality. The “damage function,” also known as the quality of the impact, assesses the initial and final states of the affected land in terms of a number of variables, such as soil and ecosystem quality. Two land-use metrics are taken into account. The first is the total area, which includes all of the land that the site boundary encloses. Usually fenced or otherwise protected, the area’s perimeter is described in blueprint drawings. The land directly occupied by solar arrays, access roads, substations, service buildings, and other infrastructure is known as the “direct impact area,” and it is the second metric. The direct-impact area is contained within the total-area boundaries and is smaller than the total area. Land use is quantified on a basis of capacity (area/MWel) and generation (area/GWh/yr). Because power plants are frequently rated according to their capacity, capacity-based results are helpful for estimating land area and costs for new projects. Evaluation of land-use impacts that vary by solar resource differences, tracking configurations, and technology and storage options is made possible by the generation basis, which also offers a more consistent comparison between technologies with different capacity factors.27Ong, S., Campbell, C., Denholm, P., Margolis, R., & Heath, G. (2013). Land-Use Re- quirements for Solar Power Plants in the United States, Technical Report NREL/TP-6A20- 56290
Land usage is generally lower than for coal, biomass, and hydropower, but higher than for nuclear, wind, and geothermal power plants. Growing global energy demand will eventually force the use of secondary and tertiary recovery technologies in oil and gas extraction as well as lower-quality, open-pit coal mining (e.g. shale gas and tight oil). Accordingly, nonrenewable energy sources will eventually have a larger land footprint, whereas renewable energy sources should eventually have a smaller one.26Bošnjaković, M., & Tadijanović, V. (2019). Environment Impact of a Concentrated So- lar Power Plant. Technical Journal, 13(1), 68-74. https://doi.org/10.31803/tg- 20180911085644
3.2 Water use and consumption
In order to generate electricity, solar thermal plants require a sizable amount of water, just like other power plants. The majority of the water (85 to 95 percent) is meant for cooling, while the remaining portion is used to create steam in the thermodynamic cycle.26Bošnjaković, M., & Tadijanović, V. (2019). Environment Impact of a Concentrated So- lar Power Plant. Technical Journal, 13(1), 68-74. https://doi.org/10.31803/tg- 20180911085644
According to estimates, a solar power plant with (oncethrough) wet cooling can use up to 3.8 m3/MWh of electricity, which is more than coal (3.123 m3/MWh) and nuclear power plants (3.055 m3/MWh) with the same cooling system. This is also true for gas turbine combined cycles, which have the lowest water withdrawal of any thermal power plant (0.57 to 1.10 m3/MWh) when using a wet cooling tower.4IRENA. World adds record new renewable energy capacity in 2020. Abu Dhabi, UAE: International Renewable Energy Agency (IRENA); Apr. 2021 Online. Available: https://www.irena.org/News/pressreleases/2021/Apr/World-Adds- Record-New-Renewable- Energy-Capacity-in-2020. Accessed 5 January 2025.5IRENA. Renewable power generation costs in 2021. Abu Dhabi: International Renewable Energy Agency; 2022 Online. Available: https://www.irena.org/ -/me- dia/Files/IRENA/Agency/Publication/2022/Jul/IRENA_Power_Generatio n_Costs_2021.pdf.
This indicates that solar thermal power plants with a dry cooling system can cut the life-cycle water consumption of a parabolic through the plant with TES by 80%. But there are also important trade-offs when it comes to water conservation. Compared to wet cooling plants, capital costs are about 10% higher and power consumption can be up to 1% higher. According to certain studies, switching from wet to dry cooling in a 100 MW parabolic trough a CSP plant can reduce water consumption from 3 to 60 m3/MWh to 0 to 25 m3/MWh. However, using dry cooling rather than wet cooling raises investment costs and reduces plant efficiency, increasing the leveled electricity cost by 3 to 7 percent. Additionally, this results in an 8% increase in Cumulative Energy Demand (CED) and LC GHG emissions. Furthermore, dry-cooling technology performs worse in environments with temperatures higher than 38 °C. Lastly, there are CSP designs with minimal freshwater needs, like gas turbine towers and parabolic dishes with Stirling engines.26Bošnjaković, M., & Tadijanović, V. (2019). Environment Impact of a Concentrated So- lar Power Plant. Technical Journal, 13(1), 68-74. https://doi.org/10.31803/tg- 20180911085644
This information indicates that wet cooling uses more water than dry cooling. Even though dry cooling has drawbacks of its own, many facilities will be switching to dry cooling today, which will significantly reduce water consumption.
3.3 Waste
3.3.1 Solid and non-hazardous waste
The CSP plant will undergo maintenance throughout its lifecycle, and waste related to electricity production will be disposed of. Oily rags, empty containers, rusted and broken metal and machine parts, electrical waste, and other solid wastes, including the usual waste generated by employees, are all examples of power plant waste.26Bošnjaković, M., & Tadijanović, V. (2019). Environment Impact of a Concentrated So- lar Power Plant. Technical Journal, 13(1), 68-74. https://doi.org/10.31803/tg- 20180911085644
3.3.2 Hazardous waste
A power plant’s operations may generate various types of hazardous waste. Cleaning rags, used or expired chemicals from the water treatment system, paints, solvents, waste HTF, and oil and oil filters are some examples of this waste.26Bošnjaković, M., & Tadijanović, V. (2019). Environment Impact of a Concentrated So- lar Power Plant. Technical Journal, 13(1), 68-74. https://doi.org/10.31803/tg- 20180911085644
3.4 Gases emitted into the atmosphere
Depending on the technology, CSP plants have different environmental effects. GHG emissions and other pollutants are generally decreased without posing new environmental hazards. The annual production of 0.25 to 0.4 t of CO2 can be avoided with just one square meter of CSP concentrator surface. Considering that CSP systems have a lifespan of roughly 25 to 30 years, their energy payback period can be as short as five months. The majority of CSP solar field materials are recyclable and can be used again in new plants. For trough, tower, Stirling, and Fresnel systems, most estimates range from 14 to 32 g CO2 eq/kWh, and the literature that is currently available shows little variation in technology. Although there is not as much research on CSP systems as there is on some PV designs, lifecycle GHG emissions for these technologies seem to be fairly consistent at this point, though it is advised to supplement with more lifecycle assessments.28Arvizu, D., Balaya, P., Cabeza, L. F., Hollands, K. G. T., Jäger-Waldau, A., Kondo, M., Konseibo, C., Meleshko, V., Stein, W., Tamaura, Y., Xu, H., & Zilles, R. (2011). Direct Solar Energy. In IPCC Special Report on Renewable Energy Sources and Climate Change Mitigation (O. Edenhofer, R. Pichs-Madruga, Y. Sokona, K. Seyboth, P. Matschoss, S. Kadner, T. Zwickel, P. Eickemeier, G. Hansen, S. Schlömer, & C. von Stechow, Eds.). Cambridge Uni- versity Press.
Phase extraction and component manufacturing account for 12–97% of total CO2 production, construction accounts for 0.02%, plant phase production accounts for 86–5%, and dismantling and disposal accounts for 0.51%. The majority of greenhouse gas emissions linked to the manufacturing of solar field components come from the production of mirrors and galvanized steel.
3.5 Materials in CSP plants
Compared to traditional fossil fuel power plants, CSP plants use a lot more working materials within their system. The most frequently used materials are concrete, steel, and glass, all of which have a comparatively high recycling rate—usually greater than 95 percent. The majority of materials that cannot be recycled are inert and can be safely land-filled or used to build roads. Nonetheless, the CSP system contains a number of hazardous substances, most frequently synthetic organic compounds like biphenyls and biphenyl ether, which are employed in the heat transfer system. These substances must be handled as hazardous waste because they have the potential to start a fire and may leak into the ground, where they may find their way to other areas of the environment. Plants can absorb toxic substances from the soil, and animals can also absorb these substances by consuming the plants. Replacing toxic materials with water or molten salts is one method they use to try to solve the problem.26Bošnjaković, M., & Tadijanović, V. (2019). Environment Impact of a Concentrated So- lar Power Plant. Technical Journal, 13(1), 68-74. https://doi.org/10.31803/tg- 20180911085644
By substituting water and molten salt for the environmentally hazardous materials originally used in CSP, environmental harm was avoided.
3.6 Impacts on flora and fauna
CSP plants may have an effect on the local environment through building projects, access road construction, and ecosystem disruption. The construction of roads, parking lots, and facilities destroys the local wildlife. The extent of the damage depends on the affected area and the type of land use before the plant was built. Habitat fragmentation brought on by plant construction may deny species the optimal integrity of the ecosystem for their survival. By using environmental resources (water), the power plant exhausts the resources needed for the local flora and fauna. Bird mortality was impacted by CSP plants. In particular, for species that forage aerially, collision with site infrastructure, particularly heliostats, was the most frequent cause of death (81 percent), followed by burning when heliostats were pointed toward standby points (19 percent). They also found that the large, man-made evaporation pools in the area caused the number of species to increase fivefold. Effects on bird mortality may increase nonlinearly as USSE capacity grows.26Bošnjaković, M., & Tadijanović, V. (2019). Environment Impact of a Concentrated So- lar Power Plant. Technical Journal, 13(1), 68-74. https://doi.org/10.31803/tg- 2018091108564429Hernandez, R. R., Easter, S. B., Murphy-Mariscal, M. L., Maestre, F. T., Tavassoli, M., Allen, E. B., Barrows, C. W., Belnap, J., Ochoa-Hueso, R., Ravi, S., & Allen, M. F. (2014). Environmental impacts of utility-scale solar energy. Renewable and Sustainable Energy Re- views, 29, 766-779. https://doi.org/10.1016/j.rser.2013.08.041
Power plant construction may obstruct migratory routes to native plant and animal populations, decreasing the likelihood that these species will survive. Similarly, the number of invasive species in that region might rise. when moving tools and supplies for species that are not native to this ecosystem or that are alien species. Foreign species that are invasive frequently have the capacity to spread quickly, endangering native species in the process. Wind flow profile is impacted by collector arrays in CSP plants. Within the collector field, the kinetic energy of turbulence increases while the mean wind speed is sharply decreased. Since speed is crucial for the spread of the desert, lowering wind speed has many advantages. In other words, the collector field helps to prevent soil erosion. The soil temperature beneath the collector is also impacted by the collector field in CSP plants. The soil temperature outside the collector field may be several degrees Celsius higher in the winter and several degrees Celsius lower in the spring and summer, depending on where the plant is located.26Bošnjaković, M., & Tadijanović, V. (2019). Environment Impact of a Concentrated So- lar Power Plant. Technical Journal, 13(1), 68-74. https://doi.org/10.31803/tg- 20180911085644
4 Social impact
The deployment of Concentrated Solar Power (CSP) technologies can have notable social impacts, which can be assessed by analyzing the social risks associated with the economic sectors that experience increased activity due to these projects. A common approach involves employing tools such as the Social Hotspot Database (SHDB) to identify and evaluate potential social issues within these stimulated economic areas.
The methodology for assessing these social impacts typically includes the following steps:
- Identification of Key Economic Sectors: The first step involves determining which economic sectors are most likely to experience increased demand for goods and services, leading to job creation as a direct or indirect consequence of the CSP project.
- Application of the Social Hotspot Database (SHDB): The SHDB is then used to examine various social themes within these identified sectors. These themes are classified according to their perceived risk level, ranging from “very high” to “low”.
- Calculation of the Social Hotspot Index (SHI): The SHDB allows for the calculation of a Social Hotspot Index (SHI). This index provides a quantitative measure for comparing the level of social risk across different economic sectors and potentially across different countries. A higher SHI value signifies a greater prevalence of social risks within a particular sector. The SHI considers five impact categories.
- Broad Scope of Social Impacts: A key advantage of using the SHDB is its capacity to consider a wide array of social impacts, extending beyond traditional socioeconomic indicators like employment to encompass aspects such as labor rights and human rights.
Analysis of CSP projects, as demonstrated in the assessment conducted in Northern Chile, often reveals that sectors experiencing significant job creation may concurrently exhibit notable social risks. For instance, the construction sector was identified as having a higher Social Hotspot Index (SHI) compared to other stimulated sectors. This elevated risk can be linked to categories such as Labour Rights and Human Rights. Within the Labour Rights category, specific social themes like unemployment can be classified as a “very high risk”. Other relevant labor-related risks can include issues pertaining to forced labor, freedom of association, labor laws, and the treatment of migrant workers.30Rodríguez-Serrano, I., Caldés, N., De la Rúa, C., Lechón, Y., & Garrido, A. (2016). So- cioeconomic, environmental and social impacts of a concentrated solar power energy project in Northern Chile. Renewable Energy and Environmental Sustainability, 1, 5. https://doi.org/10.1051/rees/2016005
Furthermore, the analysis often indicates that unemployment risk can be a significant concern in other sectors that are projected to experience increased employment as a result of CSP projects. While these projects generate new job opportunities, the sectors involved might already be characterized by underlying vulnerabilities related to unemployment, potentially receiving a “high” risk value.
Despite the identification of these social risks, the development of CSP projects can also be viewed as a mechanism for potentially reducing unemployment risks within the stimulated sectors by creating new employment opportunities. The social risk assessment conducted suggests that the project would support the reduction of unemployment risks within the most affected sectors. Therefore, while social impact assessments highlight existing vulnerabilities, they also imply that these projects can contribute positively to employment figures.
In conclusion, the assessment of social impacts associated with CSP projects underscores that while these developments can lead to job creation and economic growth, it is crucial to consider the underlying social risks within the expanding sectors, particularly those related to labor and human rights, with unemployment frequently emerging as a key concern. The application f comprehensive tools like the SHDB facilitates a more holistic understanding of the potential social consequences, encompassing a range of factors beyond mere job creation figures.
5 Political and legal aspects
5.1 Policy tools for the advancement and implementation of CSP
To further lower the expenses associated with CSP and enable its large-scale deployment in the future, especially when renewable energy dispatchability is required, policy must actively encourage both the development and innovation of this technology today. Unlike previous support initiatives, which were primarily found in developed nations, policies promoting CSP are necessary in desert regions such as the US and Australia, but especially in developing countries with expanding electricity markets, including China, India, and nations in Latin America, the MENA region, and southern Africa. In this regard, the trend is promising: CSP support initiatives and research, development, and demonstration (RD&D) policies have extended beyond Europe and the US, and now transitional nations are leading the expansion. For CSP to continue advancing and growing, this spread of CSP support to additional countries must persist.25Lilliestam, J., Barradi, T., Caldés, N., Gomez, M., Hanger, S., Kern, J., Komendantova, N. Mehos, M., Hong, W., Wang, Z., Patt, A. (2018): Policies to keep and expand the option of concentrating solar power for dispatchable electricity, in: Energy Policy 116, pp. 193-197 http://dx.doi.org/10.1016/j.enpol.2018.02.014.
5.2 Policies for deployment
Since dispatchability is essential for Concentrated Solar Power (CSP), and industry continuity and diversification are crucial for cost reductions, three key points are critical for supporting deployment: it should incentivize dispatchability, incorporate firm and predictable cost pressures, and enable a gradual and reliable pace of expansion. Regarding the dispatchability incentive, the level of dispatchability varies based on the system where CSP is required: alternatives include time-of-day pricing (as seen in South Africa) in cases of distinct peak demand; in situations with a flatter demand curve, a baseload or availability criterion, like that in Chile (ensuring constant capacity availability from 7:00 a.m. to midnight), may be more fitting. Concerning the types of instruments, we identify at least two viable options that can meet all three criteria.25Lilliestam, J., Barradi, T., Caldés, N., Gomez, M., Hanger, S., Kern, J., Komendantova, N. Mehos, M., Hong, W., Wang, Z., Patt, A. (2018): Policies to keep and expand the option of concentrating solar power for dispatchable electricity, in: Energy Policy 116, pp. 193-197 http://dx.doi.org/10.1016/j.enpol.2018.02.014. The initial option involves auction schemes, which currently serve as the primary tool for promoting CSP deployment. Such policies are therefore viable, and elements that consider all three aspects mentioned earlier have been incorporated into at least one auction scheme previously, though no nation has included all three components to date.25Lilliestam, J., Barradi, T., Caldés, N., Gomez, M., Hanger, S., Kern, J., Komendantova, N. Mehos, M., Hong, W., Wang, Z., Patt, A. (2018): Policies to keep and expand the option of concentrating solar power for dispatchable electricity, in: Energy Policy 116, pp. 193-197 http://dx.doi.org/10.1016/j.enpol.2018.02.014.
An alternative option that could more effectively meet all three criteria is the implementation of feed-in tariffs. These tariffs provide for automatic grid connection and tariff access for all acilities that meet specific established standards, thereby ensuring a consistent and reliable flow of projects. Implementing degressive, time-of-day incentivized feed-in tariffs without a capacity limitation (or with a cap sufficiently high to accommodate multiple projects each year) could serve as an effective tool for advancing CSP deployment, ensuring not only increased expertise in construction and operation but also the retention of this expertise within financially viable companies. Such a framework would likewise be practical to execute, and various elements have been incorporated into feed-in tariffs globally.25Lilliestam, J., Barradi, T., Caldés, N., Gomez, M., Hanger, S., Kern, J., Komendantova, N. Mehos, M., Hong, W., Wang, Z., Patt, A. (2018): Policies to keep and expand the option of concentrating solar power for dispatchable electricity, in: Energy Policy 116, pp. 193-197 http://dx.doi.org/10.1016/j.enpol.2018.02.014.
5.3 R&D policies
Simply deploying technology may not be enough to stimulate innovation in Concentrated Solar Power (CSP) since there is a high technology risk associated with new methods, and private funding for research, development, and demonstration (RD&D) in the electricity sector is infamously low. Additionally, developers often have legitimate reasons to adopt a conservative approach to plant design. There are two specific types of policy instruments that could effectively address this issue. Firstly, RD&D facilities can play a crucial role in testing and developing innovative CSP system designs by facilitating the examination of new configurations, components, materials, or systems on a larger scale, beyond laboratory settings. These plants can also serve as demonstration sites to validate new concepts, such as utilizing an organic Rankine cycle in low irradiation areas or utilizing CSP waste heat for alternative applications like cooling or water desalination, and can foster further development through experiential learning. Most of the limited existing RD&D CSP plants are situated in Europe or the United States, with none located in areas where CSP potential is greatest, even though operating conditions may vary significantly. For instance, RD&D plants in the sandy deserts of the Gulf region or in high-altitude locations in Chile or China could be crucial for developing and testing new components and designs suited to these specific conditions. Strengthening existing international research collaborations and establishing new ones will also promote the dissemination of innovative CSP solutions.25Lilliestam, J., Barradi, T., Caldés, N., Gomez, M., Hanger, S., Kern, J., Komendantova, N. Mehos, M., Hong, W., Wang, Z., Patt, A. (2018): Policies to keep and expand the option of concentrating solar power for dispatchable electricity, in: Energy Policy 116, pp. 193-197 http://dx.doi.org/10.1016/j.enpol.2018.02.014. Secondly, deployment support can also be directed toward fostering innovation, both by crafting the support criteria and by introducing additional dedicated instruments.
5.4 Findings and policy considerations
It is proposed that a variety of policy tools should be implemented simultaneously in arid regions where CSP could make a significant impact in the near future.25Lilliestam, J., Barradi, T., Caldés, N., Gomez, M., Hanger, S., Kern, J., Komendantova, N. Mehos, M., Hong, W., Wang, Z., Patt, A. (2018): Policies to keep and expand the option of concentrating solar power for dispatchable electricity, in: Energy Policy 116, pp. 193-197 http://dx.doi.org/10.1016/j.enpol.2018.02.014. These instruments serve as deployment strategies intended to leverage the primary benefit of CSP – its ability to be dispatched – while also managing overall cost pressures to encourage cost reductions and the development of more efficient plant designs, ensuring that industry profits are sufficient to sustain business operations. Such strategies, which may take the form of auctions or feed-in tariffs, need to incentivize dispatchability, provide consistent and defined cost pressures, and support a gradual and reliable growth rate. Options like time-of-day bonuses, a long-term strategy for reducing support, and either a significant or no capacity cap in the support frameworks are established and viable methods to meet these criteria within national auction or feed-in tariff systems.25Lilliestam, J., Barradi, T., Caldés, N., Gomez, M., Hanger, S., Kern, J., Komendantova, N. Mehos, M., Hong, W., Wang, Z., Patt, A. (2018): Policies to keep and expand the option of concentrating solar power for dispatchable electricity, in: Energy Policy 116, pp. 193-197 http://dx.doi.org/10.1016/j.enpol.2018.02.014.
Conversely, simply deploying technologies may not be enough to foster innovation and lower costs in the long run; to achieve this, specific research, development, and demonstration (RD&D) policies may be required in the regions where deployment is encouraged. These policies could encompass demonstration facilities tailored to the particular environments where growth is anticipated in the near to medium future. Additionally, they should offer provisions, included in deployment assistance, that help mitigate or distribute the heightened risks associated with implementing new and innovative components and designs, thereby encouraging cautious developers to pursue and experiment with groundbreaking technical advancements.25Lilliestam, J., Barradi, T., Caldés, N., Gomez, M., Hanger, S., Kern, J., Komendantova, N. Mehos, M., Hong, W., Wang, Z., Patt, A. (2018): Policies to keep and expand the option of concentrating solar power for dispatchable electricity, in: Energy Policy 116, pp. 193-197 http://dx.doi.org/10.1016/j.enpol.2018.02.014.
Enacting these two policy frameworks simultaneously could offer the CSP sector a harmonious blend of appealing profits and competitive dynamics, establishing a foundation to grow CSP while also decreasing expenses, preparing it for widespread implementation when necessary.25Lilliestam, J., Barradi, T., Caldés, N., Gomez, M., Hanger, S., Kern, J., Komendantova, N. Mehos, M., Hong, W., Wang, Z., Patt, A. (2018): Policies to keep and expand the option of concentrating solar power for dispatchable electricity, in: Energy Policy 116, pp. 193-197 http://dx.doi.org/10.1016/j.enpol.2018.02.014.
References
- 1Baharoon, D. A., Rahman, H. A., Wan Omar, W. Z., & Fadhl, S. O. (2015). Historical development of concentrating solar power technologies to generate clean electricity effi- ciently – A review. Renewable and Sustainable Energy Reviews, 41, 996–1027. http://dx.doi.org/10.1016/j.rser.2014.09.008
- 2Masson-Delmotte V, et al. Climate change 2021: the physical science basis,” Contribution of working group I to the sixth assessment report of the intergovernmental panel on climate change. 2021. p. 2.
- 3Wiatros-Motyka M. Global electricity review 2023. London, UK: Ember; 2023 Online. Available: https://ember-climate.org/app/uploads/2023/04/Globa l-Electricity-Review- 2023.pdf.
- 4IRENA. World adds record new renewable energy capacity in 2020. Abu Dhabi, UAE: International Renewable Energy Agency (IRENA); Apr. 2021 Online. Available: https://www.irena.org/News/pressreleases/2021/Apr/World-Adds- Record-New-Renewable- Energy-Capacity-in-2020. Accessed 5 January 2025.
- 5IRENA. Renewable power generation costs in 2021. Abu Dhabi: International Renewable Energy Agency; 2022 Online. Available: https://www.irena.org/ -/me- dia/Files/IRENA/Agency/Publication/2022/Jul/IRENA_Power_Generatio n_Costs_2021.pdf.
- 6ESTELA. The value of solar thermal electricity: cost vs. Value approach. Brussels, Bel- gium: European Solar Thermal Electricity Association; 2016 Online. Available: https://www.estelasolar.org/Docs/2016_ESTELA_STE-CSP_Value_ Final.pdf.
- 7Ford J. “Nuclear is less costly than you think,” Financial Times. 2024 Online. Available: https://www.ft.com/content/1859ab32-2230-11e9-8ce6-5db4543 da632. Accessed 13 March 2024.
- 8Mount TD, Maneevitjit S, Lamadrid AJ, Zimmerman RD, Thomas RJ. The hidden system costs of wind generation in a deregulated electricity market. Energy J 2012;33(1):161–86.
- 9Weigt H. Germany’s wind energy: the potential for fossil capacity replacement and cost saving. Appl Energy Oct. 2009;86(10):1857–63. https://doi.org/ 10.1016/j.apen- ergy.2008.11.031.
- 10Rahman A, Farrok O, Haque MM. Environmental impact of renewable energy source based electrical power plants: solar, wind, hydroelectric, biomass, geothermal, tidal, ocean, and osmotic. Renew Sustain Energy Rev 2022;161: 112279.
- 11Wang W, Fan L, Laumert B. A theoretical heat transfer analysis of different indirectly-irradiated receiver designs for high-temperature concentrating solar power applications. Re- new Energy 2021;163:1983–93.
- 12Liu Q, Barker R, Wang C, Qian J, Neville A, Pessu F. The corrosion behaviour of stain- less steels and Ni-based alloys in nitrate salts under thermal cycling conditions in concen- trated solar power plants. Sol Energy Jan. 2022;232:169–85. https://doi.org/10.1016/j.solener.2021.12.072.
- 13Calvet N, et al. Dispatchable solar power using molten salt directly irradiated from above. Sol Energy 2021;220:217–29.
- 14Khamlich I, et al. Technical and economic assessment of thermal energy storage in con- centrated solar power plants within a spot electricity market. Renew Sustain Energy Rev Apr. 2021;139:110583. https://doi.org/10.1016/j. rser.2020.110583.
- 15Hahn Menacho AJ, Rodrigues JFD, Behrens P. A triple bottom line assessment of con- centrated solar power generation in China and Europe 2020–2050. Renew Sustain Energy Rev Oct. 2022;167:112677. https://doi.org/10.1016/j. rser.2022.112677.
- 16Kondaiah P, Pitchumani R. Novel textured surfaces for superior corrosion mitigation in molten carbonate salts for concentrating solar power. Renew Sustain Energy Rev Dec. 2022;170:112961. https://doi.org/10.1016/j. rser.2022.112961.
- 17Stram BN. Key challenges to expanding renewable energy. Energy Pol 2016;96: 728– 34.
- 18Lilliestam J, Bielicki JM, Patt AG. Comparing carbon capture and storage (CCS) with concentrating solar power (CSP): Potentials, costs, risks, and barriers. Energy Pol Aug. 2012;47:447–55. https://doi.org/10.1016/j.enpol.2012.05.020.
- 19Mehos M, Turchi C, Jorgenson J, Denholm P, Ho C, Armijo K. On the path to SunShot- advancing concentrating solar power technology, performance, and dispatchability. EERE Publication and Product Library; 2016.
- 20Agency IE. Net Zero by 2050: a roadmap for the global energy sector. Paris, France: IEA; 2021.
- 21Irena AD. REmap 2030: a renewable energy roadmap. 2014.
- 22Khan, M.I., Gutiérrez-Alvarez, R., Asfand, F., Bicer, Y., Sgouridis, S., Al-Ghamdi, S.G., Jouhara, H., Asif, M., Kurniawan, T.A., Abid, M., Pesyridis, A. and Farooq, M. (2024) ‘The economics of concentrating solar power (CSP): Assessing cost competitiveness and deploy- ment potential’, Renewable and Sustainable Energy Reviews, 200, p.114551. Available at: https://doi.org/10.1016/j.rser.2024.114551.
- 23IRENA. Renewable power generation costs in 2022. Abu Dhabi, UAE: International Re- newable Energy Agency (IRENA); 2023 [Online]. Available: https ://www.irena.org/Publica- tions/2023/Aug/Renewable-Power-Generation-Costs -in-2022.
- 24IRENA. Renewable power generation costs in 2020. Abu Dhabi, UAE: International Re- newable Energy Agency; 2021 [Online]. Available: https://www. irena.org/publica- tions/2021/Jun/Renewable-Power-Costs-in-2020.
- 25Lilliestam, J., Barradi, T., Caldés, N., Gomez, M., Hanger, S., Kern, J., Komendantova, N. Mehos, M., Hong, W., Wang, Z., Patt, A. (2018): Policies to keep and expand the option of concentrating solar power for dispatchable electricity, in: Energy Policy 116, pp. 193-197 http://dx.doi.org/10.1016/j.enpol.2018.02.014.
- 26Bošnjaković, M., & Tadijanović, V. (2019). Environment Impact of a Concentrated So- lar Power Plant. Technical Journal, 13(1), 68-74. https://doi.org/10.31803/tg- 20180911085644
- 27Ong, S., Campbell, C., Denholm, P., Margolis, R., & Heath, G. (2013). Land-Use Re- quirements for Solar Power Plants in the United States, Technical Report NREL/TP-6A20- 56290
- 28Arvizu, D., Balaya, P., Cabeza, L. F., Hollands, K. G. T., Jäger-Waldau, A., Kondo, M., Konseibo, C., Meleshko, V., Stein, W., Tamaura, Y., Xu, H., & Zilles, R. (2011). Direct Solar Energy. In IPCC Special Report on Renewable Energy Sources and Climate Change Mitigation (O. Edenhofer, R. Pichs-Madruga, Y. Sokona, K. Seyboth, P. Matschoss, S. Kadner, T. Zwickel, P. Eickemeier, G. Hansen, S. Schlömer, & C. von Stechow, Eds.). Cambridge Uni- versity Press.
- 29Hernandez, R. R., Easter, S. B., Murphy-Mariscal, M. L., Maestre, F. T., Tavassoli, M., Allen, E. B., Barrows, C. W., Belnap, J., Ochoa-Hueso, R., Ravi, S., & Allen, M. F. (2014). Environmental impacts of utility-scale solar energy. Renewable and Sustainable Energy Re- views, 29, 766-779. https://doi.org/10.1016/j.rser.2013.08.041
- 30Rodríguez-Serrano, I., Caldés, N., De la Rúa, C., Lechón, Y., & Garrido, A. (2016). So- cioeconomic, environmental and social impacts of a concentrated solar power energy project in Northern Chile. Renewable Energy and Environmental Sustainability, 1, 5. https://doi.org/10.1051/rees/2016005