Authors: Ramakrishnan Thrissur Subramanian, Tran Quoc Ngu
Edited by: Srikeshav Arunachalam Dharmalingam, Jai Vijaykumar Sulakhe
Last updated: May 18, 2026
Executive summary
Offshore wind has expanded from the first commercial project in 1991 to a large and fast-growing global industry, supported by larger turbines, improved foundations, and more capable installation and maintenance logistics. Fixed-bottom projects still dominate in shallow to mid-depth waters, while floating wind opens deeper-water sites but remains higher cost and earlier in commercialization.
Successful projects depend on coordinated grid architecture and transmission planning. Developers typically collect power through array cables to an offshore substation and then export it to shore, increasingly using HVDC for long distances. Selecting onshore landing points and planning onshore reinforcements help avoid congestion, curtailment, and stability issues, while meshed offshore grids can improve flexibility and enable cross-border power flows.
Costs remain higher than onshore wind because offshore projects require complex marine construction, specialized vessels, ports, and subsea cables. Key financial drivers include capital expenditure, operations and maintenance, capacity factor, and the cost of capital. Bankable revenue frameworks—such as contracts for difference, long-term power purchase agreements, and well-designed auctions—can reduce risk and lower financing costs.
Organizations developing offshore wind should also manage non-technical risks and sustainability impacts. Supply-chain capacity, workforce development, and strong health and safety systems are essential for delivery and reliable operations. Environmental performance is generally strong in terms of lifecycle emissions, but projects must address marine ecology impacts, decommissioning, and circular-economy considerations—especially blade recycling and material recovery. Robust permitting, stakeholder engagement, and cybersecurity for increasingly digital operations help maintain project timelines, public acceptance, and resilient performance.
1 Description and history
The world’s first commercial offshore wind turbine was installed at Vindeby, Denmark, in 1991 with a total capacity of 5 MW, supplying electricity for 2200 households.1Grid Integration of Offshore Wind Power: Standards, Control, Power Quality and Transmission. For floating wind, the first full-scale MW-class turbine (Hywind Demo, 2.3 MW) was installed off Karmøy, Norway, in 2009. The global cumulative capacity increased from ~8 GW in 2014 to ~75 GW by end of 2023. 10.8 GW of offshore wind capacity was added in 2023, 24% higher than the previous year, making 2023 the second highest year in terms of offshore wind installations.2Global Wind Energy, C., Rebecca, W. & Feng, Z. Global Offshore Wind Report 2024. 156 (Brussels, Belgium, 2024).
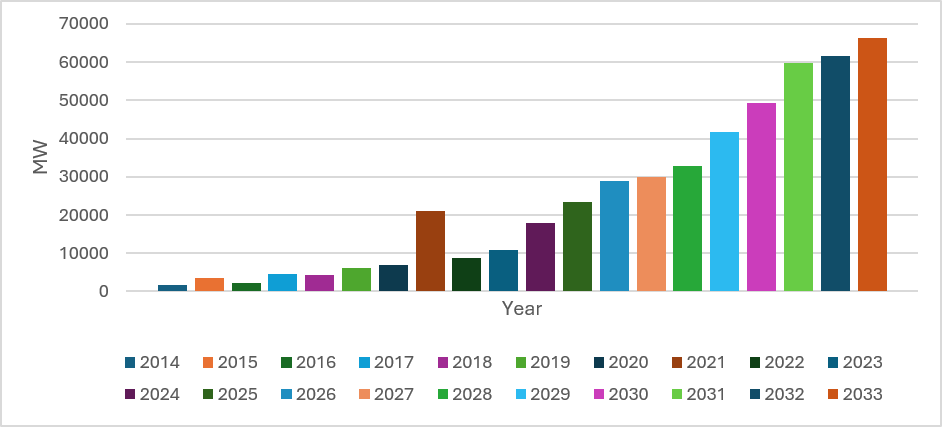
Figure 1: Global offshore wind capacity added per year (2014–2024) with a line showing the 2033 deployment outlook. Based on data from Global Offshore Wind Energy Report 2024.2Global Wind Energy, C., Rebecca, W. & Feng, Z. Global Offshore Wind Report 2024. 156 (Brussels, Belgium, 2024).
There are mainly two technical routes for type of offshore wind turbine generators: a) permanent magnet direct drive and b) permanent magnet semi-direct drive synchronous generator sets. The permanent magnet direct drive synchronous wind turbine system has the highest annual power generation, and the permanent magnet semi-direct drive synchronous wind turbine system has the lowest cost per kilowatt-hour.3Su, X. et al. Offshore Wind Power: Progress of the Edge Tool, Which Can Promote Sustainable Energy Development. Sustainability 16, 7810 (2024). https://doi.org:10.3390/su16177810 The foundational structures of offshore wind turbines are more complex compared to onshore turbines mainly due to the harsh offshore environment where the turbines are subjected to greater wind loads, current loads and wave loads.4Wu, X. et al. Foundations of offshore wind turbines: A review. Renewable and Sustainable Energy Reviews 104, 379-393 (2019). https://doi.org:10.1016/j.rser.2019.01.012 Majority of the offshore wind farms are located on the continental shelf in water depths of about 20-60m and distances frequently exceed 20-30km off the coast for fixed bottom foundations, with notable examples such as Seagreen (58.6m) and long distances to shore (e.g., Hornsea 1 at 115km approx.). Offshore wind turbines must have strong support structures connected to the seabed by foundations and must be located above the crest level of the highest waves.5Angus, M., Eric, U., Ulf, M., Christine, G. & Virginia, S.-O. B. Global trends in renewable energy investment 2013. (Frankfurt School-UNEP Centre/BNEF (2013)). Estimates show that the cost of offshore wind unit is double, or triple compared to an onshore wind unit depending on the site location.6Esteban, M. D., Diez, J. J., López, J. S. & Negro, V. Why offshore wind energy? Renewable Energy 36, 444-450 (2011). https://doi.org:10.1016/j.renene.2010.07.009,7Wu, J., Wang, Z.-X. & Wang, G.-Q. The key technologies and development of offshore wind farm in China. Renewable and Sustainable Energy Reviews 34, 453-462 (2014). https://doi.org:10.1016/j.rser.2014.03.023
Existing offshore wind turbines mostly consist of wind turbines installed with fixed foundations – gravity base, monopile, tripod and jacket in water depths less than 50m. The wind resource is substantial for water depths greater than 50 m and bottom-fixed offshore turbines are no longer attractive economically in these conditions.8O’Kelly, B. C. & Arshad, M. in Offshore Wind Farms 589-610 (Elsevier, 2016). Following an initial concept proposed by William E Heronemus at University of Massachusetts in early 1970s, industrially funded research on floating wind turbines started in mid 1990s. Benefiting from advances in floating oil and gas platforms such as tension leg platforms (TLP’s), semi-submersibles and spars, floating offshore wind turbines with mooring systems and anchor foundations have been proposed and tested. In 2008, the first test floating wind turbine (TLP platform type) with a rated capacity of 80 kW was installed by Blue H Technologies off the Italian coast. Hywind with a capacity of 2.3 MW and a spar foundation installed by Statoil in the North Sea near Norway was the world’s first MW-scale floating wind turbine. Principle Power Inc developed WindFloat with a semi-submersible foundation and 2 MW Vestas turbine.It was the second MW-scale floating wind turbine and was installed offshore of Agucadoura, Portugal in water depth of 45 m.9Laura, C.-S. & Vicente, D.-C. Floating offshore wind farms. (Springer International Publishing, 2016).
Asia and Europe had operational offshore wind capacity of 41 GW and 34 GW by the end of 2023 respectively.10Global Wind Energy Council (via Anadolu Agency). (2024, January 20). Global offshore wind capacity rises 24% in 2023, second highest growth in offshore wind history. Anadolu Agency. https://www.aa.com.tr/en/energy/electricity/global-offshore-wind-capacity-rises-24-in-2023-second-highest-growth-in-offshore-wind-history/42117 Outside Europe and Asia, North America had 42 MW of offshore wind in operation. Apart from wind turbines, offshore wind projects require critical balance of plant items such as large foundations to support the turbine and transfer the load from sea surface to the soil at depth, specialized vessels for wind turbine component transportation and installation, subsea cables to connect the turbines and transfer power, and ports specifically for assembly and storage.2Global Wind Energy, C., Rebecca, W. & Feng, Z. Global Offshore Wind Report 2024. 156 (Brussels, Belgium, 2024).
By the end of 2022, fixed-bottom foundations consisting of steel and concrete foundations dominate the offshore wind market with monopiles and jackets making up 70% and 17% of the total installations. Annually 3,880 units of fixed bottom foundations can be produced by 30 manufacturers globally. GWEC market intelligence predicts that more than 2,200 units are planned to be added globally by 2026 and there is enough capacity available to meet the demand growth from 1,679 units in 2023 to 3,430 units in 2030. Floating foundations are not expected to reach commercialization until the end of this decade with annual demand surpassing 200 units per year. Demand for cables is expected to grow by an average of 18% year-on-year from 2023 to 2030. Key trends driving the cable demand are shift from 33 kV to 66 kV for larger turbines, transition from AC to DC cables to reduce electrical losses in long distances and high-voltage direct current (HVDC) technology for power interconnection in cross border energy sharing. In 2022, only about 0.5% of global energy cable production facilities were capable of producing submarine cables.2Global Wind Energy, C., Rebecca, W. & Feng, Z. Global Offshore Wind Report 2024. 156 (Brussels, Belgium, 2024).
Vessels used for installation of offshore wind turbine and foundations (Wind Turbine Installation Vessels – WTIV) fall into two categories: heavy lift vessels (mostly for foundations) and jack-up vessels (mainly for wind turbines – including self-propelled vessels and barges without propulsion). The two major factors impacting the availability of the vessels are: Turbine MW size continue to grow beyond 12 MW – (approx. weight of nacelle is 500-800 tonnes, tower is over 2,000 tonnes and foundation weighs over 1000 tonnes) and hub height (ranges from 109 m to over 150 m). Ports provide support for component manufacturing, storage, wind site surveying, construction, operation and decommissioning. Ports are named according to the function they serve a) marine survey port, b) manufacturing port, c) marshalling (staging) port and d) operation and maintenance port. Before loading them on to WTIV’s, a dedicated laydown area, specialized equipment and quayside are required to lift and store the big components.2Global Wind Energy, C., Rebecca, W. & Feng, Z. Global Offshore Wind Report 2024. 156 (Brussels, Belgium, 2024).
Advancements in offshore wind technology include size and turbine design, innovations in foundations, strategies for grid integrations, subsea cable technology, floating wind turbines all of which were discussed above. Other important advancements are remote monitoring and maintenance to monitor turbine performance, detect faults, optimize maintenance schedules through predictive algorithms, reduce downtimes and operational costs. Integration of digitalization and data analytics optimizes wind farm operations, improve energy forecasting and enhances overall project efficiency and performance. Using advanced modeling and simulation tools, optimization of wind farm layout facilitates to maximize energy yield, reduce wake effects and mitigate environmental impacts.11Dr. Rohit Kumar, G. Advancements in Offshore Wind Energy Technology: Challenges and Opportunities for Sustainable Power Generation. Indian Journal of Renewable Energy 1, 1-6 (2024).
Offshore wind turbines have grown substantially in size and power rating over the past decade, with average offshore turbine ratings increasing to the high single digits in recent years (≈8–10 MW), and leading models now announced in the 15–18+ MW-class. To allow the supply chain and R&D investments to be paid off and allow the benefits of standardization, industrialization and industry learning to lower costs some of the original equipment manufacturers (OEM) have expressed hesitation to continue increasing the turbine size.12Angel, M. et al. Offshore Wind Market Report: 2024 Edition. (National Renewable Energy Laboratory). In 2023, Chinese OEM Goldwind installed 16 MW offshore wind turbine (GWH252-16MW) with 123 m long blades and rotor diameter of 252 m and swept area of 50,000 sq.m. Mingyang commissioned (MySE 16-260) overtaking Goldwind with a rotor diameter of 260 m and swept area of 53,902 sq.m. Mingyang also unveiled MySE.13The World Bank – Energy Sector Management Assistance, P. Offshore Wind Technical Potential Analysis Maps. X-20MW with rotor diameter ranging between 260-292 m and equipped with anti-typhoon technology capable of withstanding category 17 typhoons (56.1 to 61.2 m/s). Mingyang also unveiled plans to develop MySE 22MW with rotor diameter over 310 m and suitable for both fixed-bottom and floating applications. General Electric (GE) unveiled plans to develop next generation its Halide-X variant that has a capacity between 17-18 MW. Vestas’s new wind turbine V236-15MW has a rotor diameter of 236 m and swept area greater than 43,000 sq.m.14Adrijana, B. (2024).
GWEC estimates that more than 410 GW of new offshore wind capacity is expected to be added over the decade (2024-2033). There is still an implementation gap between the rate of annual installations and declared targets.2Global Wind Energy, C., Rebecca, W. & Feng, Z. Global Offshore Wind Report 2024. 156 (Brussels, Belgium, 2024). Some of the major challenges include: a) Technical challenges like complex seabed conditions, harsh marine environment and logistical complexities of construction and maintenance b) Impact on marine ecosystems, coastal communities and wildlife habitats c) Regulatory frameworks leading to legal and administrative bottlenecks causing project approval delays and uncertainties for developers d) Careful consideration and management is required to handle socio-economic implications including local community engagement, job creation and equitable distribution of benefits e) Technical challenges related to grid stability, reliability and capacity constraints.11Dr. Rohit Kumar, G. Advancements in Offshore Wind Energy Technology: Challenges and Opportunities for Sustainable Power Generation. Indian Journal of Renewable Energy 1, 1-6 (2024). 2023 was challenging for offshore wind industry with increased capital costs, interest rates and high inflation. The cost of capital increases due to accounting all the risks related to grid, land, legal, procurement, off-taker, forex rates and political. By addressing these key challenges related to political/legal, social, technological, economic and ecological performance, the implementation gap can be reduced and will facilitate in achieving the offshore wind energy capacity targets set by governments.2Global Wind Energy, C., Rebecca, W. & Feng, Z. Global Offshore Wind Report 2024. 156 (Brussels, Belgium, 2024).
2 Offshore grid architecture and transmission planning
Offshore wind is expected to be a major player in the global efforts toward decarbonization, leading to exceptional changes in modern power systems.15Business Norway. (2025). How offshore wind turbines are connected to the grid. https://businessnorway.com/articles/how-offshore-wind-turbines-are-connected-to-the-grid Generally, when it comes to offshore wind projects, the wind turbines are interconnected with each other through an array of cables. The electricity generated by individual wind turbines are first transmitted to a central offshore substation. The substation converts the AC current generated to DC before transmitting to reduce losses. The direct current then usually flows ashore at 320 kV via a high-voltage line. This line is also called the High-voltage direct current transmission (HVDC).16Bundesverband Windenergie Offshore. (n.d.). Structure and function of an offshore wind farm. https://bwo-offshorewind.de/en/category/themen/grundlagen/aufbau-und-funktion-eines-owp/ From there, subsea export cables transport the power onshore, where it is distributed through the local grid connection system.15Business Norway. (2025). How offshore wind turbines are connected to the grid. https://businessnorway.com/articles/how-offshore-wind-turbines-are-connected-to-the-grid Usually, High Voltage Direct Current export system is deployed to transmit current very efficiently over extensive underwater routes. However, innovations in power connection technologies, such as the development of floating and underwater substations, have addressed some of these issues.15Business Norway. (2025). How offshore wind turbines are connected to the grid. https://businessnorway.com/articles/how-offshore-wind-turbines-are-connected-to-the-grid HVDC technologies use several configurations. These include voltage source converter HVDC (VSC-HVDC), DR-HVDC, and hybrid HVDC.
VSC-HVDC
DR-HVDC
| VSC-HVDC | DR-HVDC | Hybrid HVDC | |
| Advantages | 1 Modular design. 2 High-quality AC voltage generation. 3 Low power loss. 4 Independent control of active and reactive power. 5 Capability of establishing an AC network. | 1 Smaller offshore platform size and weight. 2 Higher conversion efficiency. 3 Faster installation. 4 Lower investment cost.. | 1 Reduced passive filter requirement. 2 Better harmonic suppression. 3 Operation similar to conventional VSC systems. 4 Reduced control complexity for turbines. 5 Lower power losses. 6 Reduced cost and platform size. 7 Increased system redundancy and reliability. |
Table 1: Advantages of different transmission systems1Grid Integration of Offshore Wind Power: Standards, Control, Power Quality and Transmission.
3 Onshore landing points
The selection of onshore landing points is very crucial as poor planning causes environmental conflicts and grid congestion. Once the electricity reaches land, the grid must handle it. Reinforcements like new transmission lines, higher voltage substations, smart grid upgrades will help. Without these the wind farms may be forced to undergo curtailment. Optimization-based planning frameworks have been proposed to jointly evaluate offshore transmission topology and onshore network reinforcements to minimize curtailment and overall system costs.17Optimization of offshore grid planning considering onshore network expansions – Liu et al. – https://doi.org/10.1016/j.renene.2021.08.117 Grid impact studies also show that inappropriate landing point selection can increase voltage instability and overload risks in high-renewable regions.18Grid Connection Studies for Large-Scale Offshore Wind Farms Considering High Penetration of Regional Renewables – Choi et al. – DOI:10.3390/su14021015
The development of meshed offshore HVDC grids has been widely recognized as a key enabler for large-scale offshore wind integration, particularly in regions such as the North Sea. Studies demonstrate that interconnected, multi-terminal offshore grids enhance transmission flexibility, reduce congestion, and lower overall system costs compared to conventional point-to-point connections.19Offshore Wind Integration in the North Sea: The Benefits of an Offshore Grid and Floating Wind – Glaum, Neumann & Brown, 2023 – DOI:10.48550/arXiv.2305.01996 By providing multiple power flow paths and enabling cross-border exchanges, meshed configurations reduce curtailment risk and improve asset utilization.20Curis, J.-B., Descloux, J., Grisey, N., Wagner, A., Göksu, Ö., Saborío-Romano, O., Brantl, C., Kaiser, M., Quester, M., Ruffing, P., Dupont, B., Henneaux, P., Karoui, K., Nesterov, D., Irazabal, I. A., MacIver, C., & Bell, K. (2016). Deliverable 1.3: Synthesis of available studies on offshore meshed HVDC grids. PROMOTion – Progress on Meshed HVDC Offshore Transmission Networks. https://orbit.dtu.dk/en/publications/deliverable-13-synthesis-of-available-studies-on-offshore-meshed-/ Advanced control strategies in VSC-HVDC systems also enable offshore wind farms to provide essential system services such as voltage regulation and reactive power support, thereby enhancing overall grid stability.21A Centralized Voltage Controller for Offshore Wind Plants: NY State Grid Case Study – Zhu et al. – DOI:10.1109/ISGT-LA56058.2023.10328266. Together, these developments highlight the strategic importance of coordinated offshore grid planning for reliable and cost-efficient large-scale wind deployment.
4 Economic performance
Economic performance of onshore wind power plants or other renewable technologies can be measured in different ways and each metric will bring their own insights. To facilitate the comparison of costs by country or region for the same technologies, identification of key drivers is essential.22International Renewable Energy, A. Renewable Power Generation Costs in 2023. 211 (Abu Dhabi, 2024). The major key assumptions are as follows:22International Renewable Energy, A. Renewable Power Generation Costs in 2023. 211 (Abu Dhabi, 2024).,23Lazard & Roland, B. Lazard’s Levelized Cost of Energy Analysis – June 2024. 48 (Lazard, 2024).
• Net facility output (in MW)
• Total capital cost – equipment cost (factory gate, free onboard FOB and delivery at site), project installation cost including fixed financing costs (in $/kW or $/MW)
• Operation & maintenance (O&M) costs – fixed (in $/kW-year) and variable ($/MWh)
• Capacity factor of the project
• Construction timeline (in months) and facility life (in years)
• Levelized Cost of Energy (LCOE – in $/MWh)
LCOE is broadly defined as function of the total lifecycle costs relative to the amount of energy produced:22International Renewable Energy, A. Renewable Power Generation Costs in 2023. 211 (Abu Dhabi, 2024).
LCOE = average lifetime levelized cost of electricity generation, lt = Investment expenditures in the year ‘t’, Mt = O&M expenditures in the year ‘t’, Ft = Fuel expenditures in the year ‘t’, Et = Electricity generation in the year ‘t’, r = discount rate and n = life of the system.
Weighted average cost of capital (WACC) is used as the effective discount rate and it implies a weighting of the costs of different financing resources.24Bosch, J., Staffell, I. & Hawkes, A. D. Global levelised cost of electricity from offshore wind. Energy 189, 116357 (2019). https://doi.org:10.1016/j.energy.2019.116357 The WACC ranges between 5% to 10% with OECD (Organization for Economic Co-operation and Development) countries and China having WACC between 5% and 7.5% due to relatively low and stable regulatory and economic policies which reduces the perceived risk of renewable energy projects.22International Renewable Energy, A. Renewable Power Generation Costs in 2023. 211 (Abu Dhabi, 2024).

Table 2: Lifecycle costs of an offshore wind farm24Bosch, J., Staffell, I. & Hawkes, A. D. Global levelised cost of electricity from offshore wind. Energy 189, 116357 (2019). https://doi.org:10.1016/j.energy.2019.116357
The LCOE estimate for fixed-bottom offshore wind is $95/MWh, and the floating substructure reference project estimate is $145/MWh. These two reference projects give a single-variable sensitivity range of $52–$184/MWh. This range is primarily caused by the large variation in CapEx ($1,800–$7,711/kW) and project design life.25Stehly, T., Duffy, P., & Mulas Hernando, D. (2023). 2022 cost of wind energy review. National Renewable Energy Laboratory. https://www.nrel.gov/docs/fy24osti/88335.pdf
| Category | Component | Value ($/MWh) Fixed Bottom Offshore Wind | Value ($/MWh) Floating Offshore Wind |
|---|---|---|---|
| Turbine | Turbine | 25.7 | 32.9 |
| Plant Commissioning | 2.5 | 1.1 | |
| Balance of System | Development | 1.5 | 1.9 |
| Engineering Management | 0 | 0 | |
| Substructure & Foundation | 9.2 | 33.1 | |
| Electrical Infrastructure | 15.5 | 22.4 | |
| Assembly & Installation | 3.5 | 5.4 | |
| Lease Price | 0.7 | 3.2 | |
| Financial CapEx | Insurance During Construction | 0.7 | 1.1 |
| Decommissioning Bond | 1.7 | 2.9 | |
| Construction Financing | 2.9 | 4.9 | |
| Contingency | 6.2 | 10.5 | |
| OpEx | Operation | 4 | 9 |
| Maintenance | 21.1 | 16.9 |
Table 3: LCOE breakdown for fixed bottom and floating wind plants
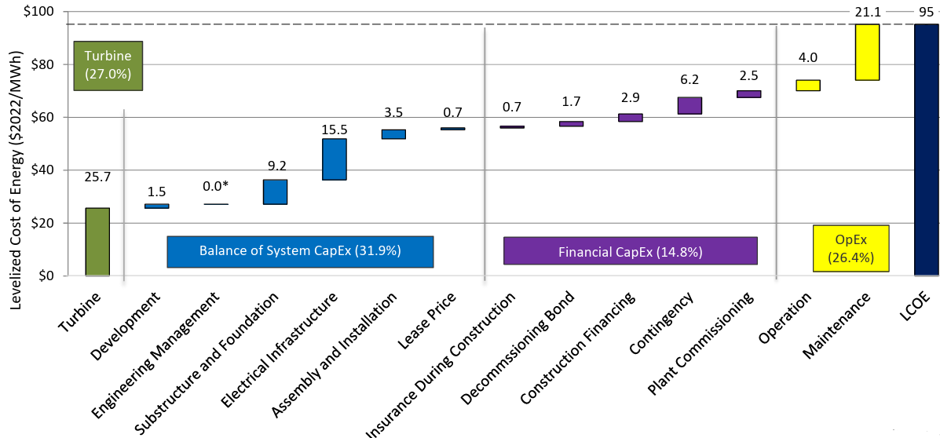
Figure 2: Levelized cost breakdown for reference fixed-bottom offshore wind plant. Based on data from NREL’s report – 2022 Cost of Wind Energy Review25Stehly, T., Duffy, P., & Mulas Hernando, D. (2023). 2022 cost of wind energy review. National Renewable Energy Laboratory. https://www.nrel.gov/docs/fy24osti/88335.pdf
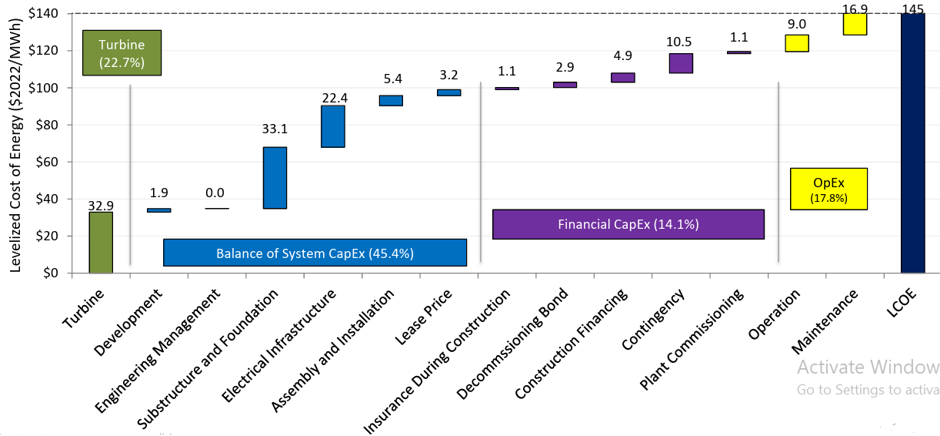
Figure 3: Levelized cost breakdown for reference floating offshore wind plant. Based on data from NREL’s report – 2022 Cost of Wind Energy Review25Stehly, T., Duffy, P., & Mulas Hernando, D. (2023). 2022 cost of wind energy review. National Renewable Energy Laboratory. https://www.nrel.gov/docs/fy24osti/88335.pdf
Direct Costs* – Preventive, Corrective and Proactive Maintenance, Indirect Costs** – Port, Vessels, Labor etc. DECOM – Decommissioning costs are also financed up front as part of the CAPEX- capital expenditure but appears at the end of life in the overall timeline.24Bosch, J., Staffell, I. & Hawkes, A. D. Global levelised cost of electricity from offshore wind. Energy 189, 116357 (2019). https://doi.org:10.1016/j.energy.2019.116357
Energy Transition Investment Trends 2024 report released by Bloomberg New Energy Finance (BNEF) noted that $1.77 trillion was invested in energy transition with major portion being invested in renewables and grids (almost $1 trillion). BNEF states that an investment of about $12 trillion would be required in the power systems till 2030 (average of $2 trillion per year) to meet the Conference of the Parties 28 – COP28 – Global Renewables and Energy Efficiency Pledge of tripling renewable energy from 2022 levels by 2030 and meet Paris accord’s 1.5°C target and net zero commitments of many countries and companies.26Bloomberg New Energy, F. Energy Transition Investment Trends 2025. (2025). To achieve the above targets, the International Renewable Energy Agency (IRENA) has recommended at least 2 TW of wind power by 2030 and 8 TW by 2050.27International Renewable Energy, A. Tracking COP28 Outcomes: Tripling renewable power capacity by 2030. 20 (Abu Dhabi, 2024).
Projections according to IRENA’s World Energy Transitions Outlook estimate that global offshore wind installations must reach 380 GW by 2030 and 2,000 GW by 2050 to deliver one third of required global power sector emission reductions for a net zero world by 2050. The world bank through its Energy Sector Management Assistance Program (ESMAP) has estimated a technically extractable offshore wind potential of 71,000 GW globally. 70% of this potential is distributed across 115 countries which are outside the traditional markets of Europe and China, indicating significant investment opportunities for offshore wind energy in new and emerging markets.27International Renewable Energy, A. Tracking COP28 Outcomes: Tripling renewable power capacity by 2030. 20 (Abu Dhabi, 2024).,13The World Bank – Energy Sector Management Assistance, P. Offshore Wind Technical Potential Analysis Maps.
Global Wind Energy Council (GWEC) in their Global Offshore Wind Report 2024 offer a framework to accelerate the growth of offshore wind, across seven key vectors:2Global Wind Energy, C., Rebecca, W. & Feng, Z. Global Offshore Wind Report 2024. 156 (Brussels, Belgium, 2024).
• Accelerating the financing of offshore wind in mature and emerging markets, across global north and south.
• Growing demand for offshore wind – industrial off-takers and development of green products to accelerate growth.
• Building the global offshore wind supply chain for a 1.5°C world.
• Accelerating permitting for offshore wind.
• Collaborating with communities and driving social consensus.
• Realizing a trained and diverse workforce.
• Building modern and efficient grids to underpin the energy transition.
In 2023, despite the macroeconomic challenges faced by the sector in some key markets, the wind industry installed 10.8 GW of new offshore wind capacity, taking the global total to 75.2 GW.28Global Wind Energy Council. (2024). Strong 2023 offshore wind growth as industry sets course for record-breaking decade. https://www.gwec.net/news/strong-2023-offshore-wind-growth/ Out of the 10.8 GW, China added 6.3 GW and Europe added 3.8 GW accounting nearly 94% of the total installed capacity globally. 2023 was also a turbulent year for offshore wind with major challenges such as inflation, increased capital costs and supply chain constraints due to which GWEC market intelligence downgraded its global offshore wind outlook by 10% for capacity additions in 2024-2028 compared to the 2023 projections.2Global Wind Energy, C., Rebecca, W. & Feng, Z. Global Offshore Wind Report 2024. 156 (Brussels, Belgium, 2024).
The following table provides a comparison of LCOE of Offshore Wind with other renewable energy technologies:22International Renewable Energy, A. Renewable Power Generation Costs in 2023. 211 (Abu Dhabi, 2024).

Table 4: LCOE comparison between renewable sources
Based on Lazard’s LCOE analysis report 2024, the LCOE of conventional power plants are as follows:23Lazard & Roland, B. Lazard’s Levelized Cost of Energy Analysis – June 2024. 48 (Lazard, 2024).
• Gas Peaking – 0.110 $/ kWh to 0.228 $/ kWh
• US Nuclear – 0.142 $/ kWh to 0.222 $/ kWh
• Coal – 0.069 $/ kWh to 0.168 $/ kWh
• Gas Combined Cycle – 0.045 $/ kWh to 0.108 $/ kWh
The Global Weighted Average Capacity Factors in 2023 for renewable technologies are as follows:22International Renewable Energy, A. Renewable Power Generation Costs in 2023. 211 (Abu Dhabi, 2024). Solar PV – 16% (up from 14% in 2010), Concentrated Solar Power (CSP) – 55% (up from 30% in 2010), Onshore Wind – 36% (up from 27% in 2010), Offshore Wind – 41% (up from 38% in 2010), Hydropower – 53% (up from 44% in 2010), Bioenergy – 72% (no change from 2010) and Geothermal – 82% (down from 87% in 2010). Technological advancements in floating offshore wind have enabled the sector to expand beyond the shallow depth waters, but the costs remain significantly higher than fixed bottom installations. Overall project development costs remain relatively high due to complex infrastructure requirements. The operational efficiency is also improved by specialized installation and maintenance vessels.22International Renewable Energy, A. Renewable Power Generation Costs in 2023. 211 (Abu Dhabi, 2024). Offshore winds are 20% stronger than onshore and provides higher capacity factor of 41%. The projects can be installed on very large scale and avoids competition for land with agriculture, urban development, conservation areas etc. Despite the 63% cost reduction in LCOE from 2010 to 2023, the construction costs are approx.3Su, X. et al. Offshore Wind Power: Progress of the Edge Tool, Which Can Promote Sustainable Energy Development. Sustainability 16, 7810 (2024). https://doi.org:10.3390/su16177810 times of onshore wind and O&M costs are 1.5 times.3Su, X. et al. Offshore Wind Power: Progress of the Edge Tool, Which Can Promote Sustainable Energy Development. Sustainability 16, 7810 (2024). https://doi.org:10.3390/su16177810 Despite these major challenges, offshore wind remains an attractive and long-term investment opportunity for developers and investment firms. By solving the bottlenecks related to supply chain, advocating for transparent auctions and seabed lease designs, stable regulatory frameworks, efficient permitting procedures, grid constraints etc. offshore wind can play a vital role in decarbonization.2Global Wind Energy, C., Rebecca, W. & Feng, Z. Global Offshore Wind Report 2024. 156 (Brussels, Belgium, 2024).
| Year | Onshore Wind LCOE | Offshore Wind LCOE |
|---|---|---|
| 2010 | ~0.111 $/kWh (111 $/MWh) | ~0.203 $/kWh (203 $/MWh) |
| 2015 | ~0.060 $/kWh (60 $/MWh) | ~0.162 $/kWh (162 $/MWh) |
| 2020 | ~0.039 $/kWh (39 $/MWh) | ~0.084 $/kWh (84 $/MWh) |
| 2022 | ~0.033 $/kWh (33 $/MWh) | ~0.081 $/kWh (81 $/MWh) |
| 2024 | ~0.034 $/kWh (34 $/MWh) | ~0.079–0.080 $/kWh (79–80 $/MWh) |
Table 5: Cost comparison: Offshore vs Onshore wind LCOE trends29International Renewable Energy Agency. (2023). Renewable power generation costs in 2022. https://www.irena.org/-/media/Files/IRENA/Agency/Publication/2023/Aug/IRENA_Renewable_power_generation_costs_in_2022.pdf,30Global Energy Prize Foundation. (2024, October 5). Wind power costs continue to decline. https://globalenergyprize.org/en/2024/10/05/wind-power-costs-continue-to-decline/
5 Project finance and offtake mechanisms
Project finance for offshore wind projects is fundamentally shaped by revenue stabilization mechanisms that enhance bankability and reduce the cost of capital. Research shows that Contracts for Difference (CfDs) significantly reduce wholesale electricity price volatility exposure by guaranteeing a fixed price for generated power, thereby lowering revenue risk and improving debt capacity.15Business Norway. (2025). How offshore wind turbines are connected to the grid. https://businessnorway.com/articles/how-offshore-wind-turbines-are-connected-to-the-grid For example, research in Energy Policy indicates that projects supported by CFDs can reduce the Weighted average cost of capital (WACC) by 1-3 percentage points, leading to a 10-20% reduction in the Levelized Cost of Energy (LCOE) compared with merchant projects exposed to market process. CfDs significantly lower market risk and improve debt financing conditions.16Bundesverband Windenergie Offshore. (n.d.). Structure and function of an offshore wind farm. https://bwo-offshorewind.de/en/category/themen/grundlagen/aufbau-und-funktion-eines-owp/ Similarly, long-term Power Purchase Agreements (PPAs) and certificate-based mechanisms such as Offshore Renewable Energy Certificates (ORECs) provide predictable revenue streams by securing fixed or floor prices for electricity and environmental attributes, thereby strengthening lender confidence and facilitating financial close. Studies in Energy Policy further demonstrate that well-structured renewable energy auctions directly influence financing costs by allocating risk efficiently between governments and developers. Fiscal incentives also play an important role; for instance, the Investment Tax Credit (ITC) in the U.S. can cover up to 30% of project capital expenditure, while additional domestic-content bonuses further reduce effective project costs and LCOE. However, partial merchant exposure can increase revenue volatility unless balanced through contractual risk-sharing arrangements among developers, OEMs, utilities, and financiers. Emerging literature and policy analyses from IRENA emphasize that auction designs incorporating non-price criteria, such as timely delivery commitments, supply-chain resilience, and environmental performance, can mitigate underbidding risks and reduce the likelihood of project renegotiation or cancellation. Overall, stable policy frameworks and balanced risk allocation mechanisms are central to ensuring long-term financial viability and sustained offshore wind deployment.
6 Supply chain and industrial policy
Scaling offshore wind demands synchronized investment in port infrastructure, specialized installation vessels, and manufacturing facilities for key components such as foundations, towers, blades, and subsea cables.31https://www.irena.org/publications/2020/Apr/Global-Renewables-Outlook-2020 This helps to mitigate inflation and supply chain bottlenecks. Also, the rapid expansion of offshore wind energy requires the parallel development of a robust and coordinated supply chain supported by effective industrial policy. The transportation and installation phase are one of the most logistically demanding and cost-intensive in the offshore wind supply chain. Transportation logistics involve moving large wind turbine components from manufacturing sites to installation ports, and then to designated offshore locations. In most offshore wind projects, components are not directly transported from the manufacturing facility to the offshore site. Instead, they are first delivered to an installation port, where they undergo pre-assembly and temporary storage, before being loaded onto specialized vessels for transportation to the offshore wind farm site. Ports and onshore bases serve as strategic hubs within the supply chain, supporting all wind farm operations. Strategic planning at the sea-basin level, along with transparent auction pipelines and clear pre-qualification criteria, provides long-term market visibility and investment certainty for manufacturers and supply-chain actors.32IEA 2019 Offshore Wind Outlook Furthermore, the standardization of turbine components, installation procedures, and logistics operations can significantly reduce capital costs and project delivery risks while improving overall efficiency across the offshore wind value chain.33GWEC 2023 Global Offshore Wind Report In addition, workforce development initiatives and local-content policies can strengthen regional industrial capacity, enhance supply-chain resilience against inflationary pressures and bottlenecks, and ensure that offshore wind development delivers sustained economic and employment benefits at the national and regional levels.34OECD 2021 Supply Chain Resilience in Renewable Energy.
7 Health, safety, and emergency preparedness
Offshore wind construction and operations present distinct health, safety, and environmental challenges due to the complex marine environment, including personnel transfers between vessels and turbines, working at heights, confined spaces, and exposure to severe weather conditions. Effective HSE frameworks are therefore essential to manage operational risks and ensure worker safety throughout the project lifecycle. Studies have shown that structured safety management systems, standardized procedures, and strong safety cultures play a critical role in minimizing occupational hazards in offshore wind activities.35Development of a Combined Operational and Strategic Decision Support Model for Offshore Wind – https://doi.org/10.1016/j.egypro.2013.07.169 Competency-based training programs, certification requirements, and clear operational guidelines further enhance workforce preparedness and reduce the likelihood of accidents during installation and maintenance operations.36Ahsan, D., Pedersen, S., Nielsen, M. R., & Ovesen, J. (2019). Why does the offshore wind industry need standardized HSE management systems? An evidence from Denmark. Renewable Energy, 136, 691–700. https://doi.org/10.1016/j.renene.2019.01.034 Modern offshore projects implement procedures like Safe Systems of Work (SSoW), Permit-to-work procedures and risk assessment protocols. These systems identify hazards and ensure that risk activities are performed under controlled and well supervised atmospheres.
In addition, robust emergency preparedness strategies—including coordinated Search and Rescue (SAR) planning, incident response protocols, and communication systems—are necessary to respond effectively to offshore emergencies and protect personnel working in remote environments. For example, in Ireland, offshore projects develop emergency response plans that integrate Coast guard and maritime authorities, Helicopter and vessel evacuation systems, On-site rescue teams and medical support, and Communication systems for offshore emergencies. These coordinated systems are essential because offshore wind farms are located far from shore and subject to severe weather conditions.37Wind Energy Ireland. (2023). Offshore safety guidelines gap analysis report (Revision 03 – June 2023). https://www.windenergyireland.com/images/files/offshore-safety-report-june-2023-final-updated-design.pdf
Data-driven HSE management approaches are also important, where incident analysis, safety performance indicators, and near-miss reporting systems contribute to continuous improvement in safety practices and overall risk reduction in offshore wind operations.
8 Climate resilience and extreme conditions
Climate resilience has become a critical consideration in offshore wind development as turbines and support structures are increasingly exposed to extreme environmental conditions such as hurricanes, typhoons, icing, and changing wave climates. The damage to offshore wind turbines due to typhoons is mainly attributed to three characteristics of a typhoon – extreme wind speed, wind direction and turbulence intensity. Furthermore, the devastating impacts of typhoons on offshore wind turbines are due not only to wind power, but also to the superimposed coupling effect of large waves caused by typhoons. Modern design standards therefore incorporate extreme load cases and site-specific metocean analyses, which evaluate parameters such as wind speed, wave height, currents, and sea-level conditions to ensure structural reliability over the project lifetime.38Bailey, B. H., & Freedman, J. M. (2024). Developments in metocean information in support of US offshore wind energy and the ocean sciences. Oceanography, 37(3), 30–41. https://doi.org/10.5670/oceanog.2024.503 In typhoon-prone regions, studies show that extreme wind and wave loads generated by tropical cyclones can significantly influence turbine structural response and foundation design, requiring specialized typhoon-resistant turbine structures, adaptive control strategies, and reinforced foundations or mooring systems.39Huang, B., Hu, K., Yin, G., Chen, R., & Du, J. (2022). Typhoon resistance analysis of offshore wind turbines: A review. Atmosphere, 13(3), 451. https://doi.org/10.3390/atmos13030451 Numerical simulations of typhoon-induced wind–wave interactions further demonstrate that extreme storm events can generate large wave heights and coupled wind-wave loads, which must be considered in offshore platform and turbine design to prevent structural failure.40Liu, Y., Wei, W., & Wang, C. (2023). Investigation of typhoon-induced wind waves for deep-sea wind power platform design. Journal of Marine Science and Engineering, 13(5), 838. https://doi.org/10.3390/jmse13050838 In cold-climate offshore regions, atmospheric icing also affects turbine aerodynamics and structural loads, necessitating de-icing systems and design guidelines such as those described in international standards for wind turbines operating under icing conditions.41Etemaddar, M., Hansen, M. O. L., & Moan, T. (2014). Response analysis of a spar-type floating offshore wind turbine under atmospheric icing conditions. Journal of Ocean and Wind Energy, 1(4), 193–201. https://orbit.dtu.dk/en/publications/response-analysis-of-a-spar-type-floating-offshore-wind-turbine-u/. Beyond structural design, resilience planning includes operational strategies such as spare-parts logistics, weather-window planning for maintenance, and rapid restoration protocols, ensuring that offshore wind farms can recover quickly after extreme weather events and maintain reliable power generation.
9 Ecological performance
Offshore wind energy has huge prospects to prevent greenhouse gas (GHG) emissions as well as other airborne pollutants through substituting for fossil fuel-driven electricity generation. As compared to fossil fuels, wind energy emits zero direct GHG, requires no fuel mining/drilling, utilizes minimal amounts of water, making it among the cleanest form of energy production.42Maureen Hand (USA), O. H. G., David Infi eld (United Kingdom), Peter H. Jensen (Denmark), Vladimir Nikolaev (Russia), Mark O’Malley (Ireland), Graham Sinden (United Kingdom/Australia), Arthouros Zervos (Greece). Wind Energy. (2010).,43J.K. Kaldellis*, D. A. Life cycle energy and carbon footprint of offshore wind energy Comparison with onshore counterpart. (2017). Offshore wind produces only 8–35 grams of CO₂ or its equivalent (CO₂eq) per kilowatt-hour (kWh) of electricity generated (gCO₂eq/kWh), far below coal (740–910 g CO₂ eq/kWh), natural gas (410–650 g CO₂ eq/kWh), and even rooftop solar (26–60 g CO₂ eq/kWh).44IPCC, I. P. O. C. C. RENEWABLE ENERGY SOURCES AND CLIMATE CHANGE MITIGATION SUMMARY FOR POLICYMAKERS AND TECHNICAL SUMMARY. (2012).,45Thomas Bruckner (Germany), L. F. U., Edgar Hertwich (Austria / Norway), Alan McKinnon (UK / Germany), Daniel Perczyk (Argentina), Joyashree Roy (India), Roberto Schaeffer (Brazil), Steffen Schlömer (Germany), Ralph Sims (New Zealand), Pete Smith (UK), Ryan Wiser (USA). Technology-specific Cost and Performance Parameters. (2014). The low-carbon footprint of offshore wind highlights its absolute significance in power sector decarbonization and climate target achievement. Global Wind Energy Council GWEC indicate that 494 GW of offshore wind can be installed globally by 2030 as part of the path to limiting global warming to 1.5°C.46COUNCIL, G. W. E. GLOBAL WIND REPORT 2024. (2024).
While Offshore Wind Energy OWE development is an effective way to reduce energy-related greenhouse gas (GHG) emissions, it will incur environmental impacts related to the manufacturing, installation, operation and maintenance (O&M), and decommissioning and end-of-life (EoL) recycling of wind turbines, foundations, and transmission equipment. These impacts remain largely uncertain with the turbine size, the distance from shore both increasing, as well as with recent changes in component technology development.47Chen Li, J. M. M., Arnold Tukker, and Bernhard Steubing. Environmental Impacts of Global Offshore Wind Energy Development until 2040. (2022). But most of these emissions only need to happen once for each wind turbine, which will be in service for at least 25 years. In this time, they will be producing electricity without emitting any more carbon dioxide, except for those from the vessels used for service and maintenance. These account for about 10% of total emissions from offshore wind.48Orsted. What is the carbon footprint of offshore wind? It has been found that 78.4% of life cycle emissions are due to component manufacture and installation, 20.4% are the result of operation and maintenance, and only 1.2% are associated with decommissioning.49HaskoningDHV, R. Carbon Footprint Assessment. (2020). Most of these emissions are a result of the high quantity of materials such as steel and concrete used, especially in monopile and jacket foundations. Steel, which constitutes 71–79% of turbine mass, has a high embodied carbon footprint, and concrete used in foundations is also a major contributor to global CO₂ emissions from cement production.50Berndt*, M. L. Influence of concrete mix design on CO₂ emissions for large wind turbine foundations. (2015).,51Alexandra Bonou ⇑, A. L., Stig I. Olsen. Life cycle assessment of onshore and offshore wind energy-from theory to application. (2016).,52Liang Tsai, J. C. K., Brett S. Simon, Rachel M. Chalat, and Gregory A. Keoleian. Life Cycle Assessment of Offshore Wind Farm Siting. (2016). Remaining materials like fiberglass, carbon fiber, and resins, which are used in turbine blades, represent specialized environmental challenges due to their complex composite structures that are difficult and costly to recycle.53Spyroudi, A. Carbon footprint of offshore wind farm components. (2021).
Although approximately 85–90% of a wind turbine’s material is theoretically recyclable, actual recycling rates—particularly of blades—are low because of economic, technical, and regulatory challenges.51Alexandra Bonou ⇑, A. L., Stig I. Olsen. Life cycle assessment of onshore and offshore wind energy-from theory to application. (2016).,53Spyroudi, A. Carbon footprint of offshore wind farm components. (2021). Blades, typically glass fiber-reinforced plastics (GFRP), are among the most challenging components to recycle and require energy-intensive processes that produce hazardous dust. Yet, recycling turbine components can reduce lifecycle emissions significantly, with studies showing that recycling can save at least 35% of carbon emissions per kWh compared to manufacturing components from raw materials.53Spyroudi, A. Carbon footprint of offshore wind farm components. (2021). Yet, due to a lack of good recycling infrastructure and circular economy policy, much of this material is currently ending up in landfill.
Offshore wind carbon footprint has been reduced over the years due to technology innovation and the deployment of larger, more efficient turbines. Offshore wind farms being built today put up turbines of 10–15 MW, reducing emissions per unit of energy produced.46COUNCIL, G. W. E. GLOBAL WIND REPORT 2024. (2024).,54Shifeng Wang a, c., Sicong Wang b, *, Jinxiang Liu a. Life-cycle green-house gas emissions of onshore and offshore wind turbines. (2019). Moreover, innovations in materials—i.e., lighter carbon fiber and improved alloys—and more efficient transport and installation processes have contributed to lowering lifecycle emissions.52Liang Tsai, J. C. K., Brett S. Simon, Rachel M. Chalat, and Gregory A. Keoleian. Life Cycle Assessment of Offshore Wind Farm Siting. (2016).,53Spyroudi, A. Carbon footprint of offshore wind farm components. (2021). Early circular economy and recyclability design strategies are increasingly integrated into new offshore wind developments, yet there are significant gaps in regulatory policies and industry practices to embrace circular approaches in full.43J.K. Kaldellis*, D. A. Life cycle energy and carbon footprint of offshore wind energy Comparison with onshore counterpart. (2017).,51Alexandra Bonou ⇑, A. L., Stig I. Olsen. Life cycle assessment of onshore and offshore wind energy-from theory to application. (2016).,53Spyroudi, A. Carbon footprint of offshore wind farm components. (2021).
Nevertheless, there remain some challenges. Blade represents the most pressing challenge as these are usually made from GFRP which is a complex material and difficult to treat due to high costs, energy use and safety risks. The huge volume of steel for foundation – around 3.5 million tonnes globally, which can only grow as there is more deployment offshore. Also, wind turbines nowadays are made up mostly of steel and concrete, which both contain a high embodied carbon that needs to be reduced through innovation in material and process.50Berndt*, M. L. Influence of concrete mix design on CO₂ emissions for large wind turbine foundations. (2015).,51Alexandra Bonou ⇑, A. L., Stig I. Olsen. Life cycle assessment of onshore and offshore wind energy-from theory to application. (2016).,52Liang Tsai, J. C. K., Brett S. Simon, Rachel M. Chalat, and Gregory A. Keoleian. Life Cycle Assessment of Offshore Wind Farm Siting. (2016). Transport and installation, particularly for offshore wind farms at great distances from the shoreline, also add to the lifecycle emissions since heavy-duty equipment and vessels are necessary.49HaskoningDHV, R. Carbon Footprint Assessment. (2020).,55R Camilla Thomson, G. P. H. Life Cycle Costs and Carbon Emissions of Offshore Wind Power. (2015).
Offshore wind energy is quickly emerging as a crucial solution to climate change through the utilization of renewable power and the reduction of greenhouse gas emissions. Although it offers vast environmental benefits, its ecological effects on marine ecosystems, biodiversity, and fisheries are also the targets of detailed research and controversy. The understanding of these interactions is crucial in order to ensure the sustainable development of offshore wind farms (OWFs).46COUNCIL, G. W. E. GLOBAL WIND REPORT 2024. (2024).,56Stephen C.L. Watson a, b., *, Paul J. Somerfield a, Ana¨elle J. Lemasson c, Antony M. Knights c, Andrew Edwards-Jones a,b, Joana Nunes a, Christine Pascoe a, Caroline Louise McNeill a, Michaela Schratzberger d, Murray S.A. Thompson d, Elena Couce d, Claire L. Szostek a,b, Heather Baxter a,b, Nicola J. Beaumont The global impact of offshore wind farms on ecosystem services. (2024).
The impact of OWFs on birds, particularly seabirds, remains a problem. Initial wind farms caused collision risks to birds due to poorly planned site selection. Modern wind farms are designed to reduce such risks. However, migratory seabirds and bats may still be subjected to habitat disturbance and migratory route alteration. Wind farm noise pollution and vibrations also impact marine mammals differently, potentially interfering with their communication and navigation abilities. However, the impacts are relatively less significant in character compared to other human endeavors like fossil fuel extraction.46COUNCIL, G. W. E. GLOBAL WIND REPORT 2024. (2024).,57Chen Li, J. W. P. C., Laura Scherer, José M. Mogollón, Ulrike Braeckman, Jan Vanaverbeke, Arnold Tukker, and Bernhard Steubing. Offshore Wind Energy and Marine Biodiversity in the NorthSea: Life Cycle Impact Assessment for Benthic Communities. (2023).,58Elizabeth T. Methratta, A. H., Brian R. Hooker, Andrew Lipsky and Jonathan A. Hare. Offshore Wind Development in the Northeast US Shelf Large Marine Ecosystem. (2020).,59Chia-Hsiang Chen 1 and Nan-Jay Su 2, 4. Global Trends and Characteristics of Offshore Wind Farm Research over the Past Three Decades: A Bibliometric Analysis. (2022).,60Fatemeh Rezaei a, Pasquale Contestabile a,b, Diego Vicinanza a,b,c, Arianna Azzellino Towards understanding environmental and cumulative impacts of floating wind farms Lessons learned from the fixed bottom offshore wind farm. (2023).
Bases of offshore wind turbines act like artificial reefs to enhance marine biodiversity by providing surface areas for organisms such as amphipods, anemones, and mussels to benthically colonize. Reef effect attracts upper trophic level species including fish, crustaceans, and even mammals, as structures offer food sources, shelter, and breeding. Such enrichment in biodiversity can induce cascading influence on ecosystem functions. But these man-made reefs also may provide harborage for non-native species, which would eliminate native habitats and ecosystems61Andrew B. Gill, S. D., Andrew Lipsky, Ninon Mavraki, Elizabeth Methratta and Robin Brabant. SETTING THE CONTEXT FOR OFFSHORE WIND DEVELOPMENT EFFECTS ON FISH AND FISHERIES. (2020).,62Van Hoey, G., Bastardie, F., Birchenough, S., De Backer, A., Gill, A., de Koning, S., Hodgson, S., Mangi Chai, S., Steenbergen, J., Termeer, E., van den Burg, S., Hintzen, N.,. Overview of the effects of offshore wind farms on fisheries and aquaculture (2021).,63Steven Degraer, D. A. C., Joop W.P. Coolen, Zoë L. Hutchison, Francis Kerckhof, Bob Rumes and Jan Vanaverbeke. OFFSHORE WIND FARM ARTIFICIAL REEFS AFFECT ECOSYSTEM STRUCTURE AND FUNCTIONING. (2020).
OWFs bring about complex relationships with fisheries. While the exclusion effect of fisheries in wind farm areas prevents some practices like bottom trawling, it might enhance marine diversity by serving as ‘de facto’ no-take areas. This can lead to increased fish stock densities and larger sizes of commercially significant species such as lobsters and cod. Displaced fishing effort, however, could impose additional pressures on other ecosystems, and alterations to sensory environments (e.g., noise and electromagnetic fields) may impact fish behavior, migration, and breeding. Passive fishing methods, such as pot fishing, can utilize increased crustacean densities in OWFs.61Andrew B. Gill, S. D., Andrew Lipsky, Ninon Mavraki, Elizabeth Methratta and Robin Brabant. SETTING THE CONTEXT FOR OFFSHORE WIND DEVELOPMENT EFFECTS ON FISH AND FISHERIES. (2020).,62Van Hoey, G., Bastardie, F., Birchenough, S., De Backer, A., Gill, A., de Koning, S., Hodgson, S., Mangi Chai, S., Steenbergen, J., Termeer, E., van den Burg, S., Hintzen, N.,. Overview of the effects of offshore wind farms on fisheries and aquaculture (2021).,64Karl M. Werner a, 1, Holger Haslob a, Anna F. Reichel a, Antje Gimpel a,b, Vanessa Stelzenmüller a. Offshore wind farm foundations as artificial reefs: The devil is in the detail. (2024).,65Lijing Wang 1 , Bangguo Wang 1 , 2 , Wenxi Cen 1 , 2 ,Rui Xu 3 , 4 ,Yuwei Huang 5 , Xin Zhang 1 , 2 , Yinghui Han 1 , 2 , ∗, Yuanxun Zhang 1 , 2 , 6. Ecological impacts of the expansion of offshore wind farms on trophic level species of marine food chain. (2024).
Installation and operation of OWFs generate underwater noise and Electromagnetic Fields EMF, which affect marine life. Impulsive piling sounds during installation may disturb fish, seabirds, and marine mammals, while continuous operating noise potentially disrupts communication and predator-prey interactions. Submarine cables that generate negative EMFs may disrupt the orientation and mobility of EMF-sensitive organisms like elasmobranchs. Even though these effects are documented, their long-term ecological implications are unknown.66T. Aran Mooney, M. H. A. a. J. S. ACOUSTIC IMPACTS OF OFFSHORE WIND ENERGY ON FISHERY RESOURCES. (2020).,67Zoë L. Hutchison, D. H. S. a. A. B. G. The Interaction Between Resource Species and Electromagnetic Fields Associated with Electricity Production by Offshore Wind Farms. (2020).,68Aurore Raouxa, b., ∗, Samuele Tecchioa, Jean-Philippe Pezyb, Géraldine Lassallec, Steven Degraerd, Dan Wilhelmssone, Marie Cacherag, Bruno Ernandef, Camille Le Guena, Matilda Haraldssona, Karine Grangeréa, Franc¸ ois Le Loc’hg, Jean-Claude Dauvinb, Nathalie Niquila. Climate change effects on the ecophysiology and ecological functioning of an offshore wind farm artificial hard substrate community. (2022).
The presence of turbine foundations and support facilities alters local hydrodynamics, influencing water flow, sediment transport, and vertical mixing. These changes have direct effects on benthic habitats and larval dispersal, which consequently have potential impacts on primary and secondary production. These changes may benefit certain species but can also impact dominant ecological balances, depending on the local condition and character of the ecosystem.69Joshua van Berkel, H. B., Asbjørn Christensen, Lars O. Mortensen, Ole Svenstrup Petersen and Frank Thomsen. The Effects of Offshore Wind Farms on Hydrodynamics and Implications for Fishes. (2020).,70Hall R a, Topham E b,a, Jo˜ao E Environmental Impact Assessment for the decommissioning of offshore wind farms (2015).
The environmental effects of OWFs vary throughout the whole lifecycle from installation to dismantling. With installation, seabed disruption and sediment transport are able to reversibly alter biodiversity and ecosystem functioning. Operationally, however, phases increase biodiversity through artificial reef effects, providing surfaces for settlement and food subsidies. Dismantling brings additional challenges in the form of removal of resident artificial habitats where structures are dismantled. Partial decommissioning, such as failing to strip scour protection layers, is becoming more prevalent in order to minimize ecological disturbance.66T. Aran Mooney, M. H. A. a. J. S. ACOUSTIC IMPACTS OF OFFSHORE WIND ENERGY ON FISHERY RESOURCES. (2020).,70Hall R a, Topham E b,a, Jo˜ao E Environmental Impact Assessment for the decommissioning of offshore wind farms (2015).,71Ashley M Fowler1*, A.-M. J., Jon C Svendsen3, Peter I Macreadie4, Daniel OB Jones5, Arjen R Boon6, David J Booth1, Robin Brabant7, Emily Callahan8, Jeremy T Claisse9, Thomas G Dahlgren10,11, Steven Degraer7, Quenton R Dokken12, Andrew B Gill13, David G Johns14, Robert J Leewis15, Han J Lindeboom16,17, Olof Linden18, Roel May19, Albertinka J Murk20, Geir Ottersen21,22, Donna M Schroeder23, Sunil M Shastri24, Jonas Teilmann25, Victoria Todd26,27, Gert Van Hoey28, Jan Vanaverbeke7, and Joop WP Coolen. Environmental benefits of leaving offshore infrastructure in the ocean. (2018).,72Vanessa Spielmann a, Jennifer Dannheim b,c, Thomas Brey a,b,c, Joop W.P. Coolen d,e. Decommissioning of offshore wind farms and its impact on benthic ecology. (2023).
OWFs influence various trophic levels within the marine ecosystem. Introduction of hard substrates adds support to benthic fauna and primary producers, leading to higher biodiversity with an associated increased attractiveness to apex predators like seabirds, fish, and marine mammals. The enrichment at the trophic level indicates the need for environmental management policy that balances renewable energy development and conservation. OWFs also impact carbon sequestration and nutrient cycling services of the ecosystem and therefore influence big-picture ecological processes.63Steven Degraer, D. A. C., Joop W.P. Coolen, Zoë L. Hutchison, Francis Kerckhof, Bob Rumes and Jan Vanaverbeke. OFFSHORE WIND FARM ARTIFICIAL REEFS AFFECT ECOSYSTEM STRUCTURE AND FUNCTIONING. (2020).,65Lijing Wang 1 , Bangguo Wang 1 , 2 , Wenxi Cen 1 , 2 ,Rui Xu 3 , 4 ,Yuwei Huang 5 , Xin Zhang 1 , 2 , Yinghui Han 1 , 2 , ∗, Yuanxun Zhang 1 , 2 , 6. Ecological impacts of the expansion of offshore wind farms on trophic level species of marine food chain. (2024).,73Aurore Raouxa, b., ∗, Samuele Tecchioa, Jean-Philippe Pezyb, Géraldine Lassallec, Steven Degraerd, Dan Wilhelmssone, Marie Cacherag, Bruno Ernandef, Camille Le Guena, Matilda Haraldssona, Karine Grangeréa, Franc¸ ois Le Loc’hg, Jean-Claude Dauvinb, Nathalie Niquila. Benthic and fish aggregation inside an offshore wind farm: Which effects on the trophic web functioning? (2017).,74WindEurope. Offshore wind and biodiversity.
The fast-paced development of offshore wind energy necessitates intense scientific exploration of their combined environmental impacts. Elaborate methodologies such as ecosystem modeling and long-term monitoring are needed to understand trophic interactions, migration, and species adaptation. Policymakers and developers must incorporate adaptive management practices so that OWFs will serve both renewable energy needs and marine conservation. Collaborative approaches, like multi-purpose marine spaces and coexistence with aquaculture, can achieve the highest possible ecological and economic benefit of offshore wind energy.74WindEurope. Offshore wind and biodiversity.,75Roberto Danovaro a, b., *, Silvia Bianchelli a,b, Paola Brambilla c, Gaia Brussa d, Cinzia Corinaldesi b,e, Adriana Del Borghi f, Antonio Dell’Anno a,b, Simonetta Fraschetti b,g, Silvestro Greco h, Mario Grosso d, Ettore Nepote a,b, Lucia Rigamonti d, Ferdinando Boero. Making eco-sustainable floating offshore wind farms: Siting, mitigations, and compensations. (2024).,76Tobias Bo¨ rger *, T. L. H., Melanie C. Austen. Valuation of ecological and amenity impacts of an offshore windfarm as a factor in marine planning. (2015).
10 Social impact
Offshore wind power is a key component of the transition to renewable energy with important environmental and economic benefits. However, the use of the technology also raises essential social questions. On public acceptance, right up to equity and quality of life, the social impact of the technology must be effectively managed in order to benefit its long-term success.
Surveys have time and again shown that wind power enjoys widespread public support, mainly due to its ability to reduce greenhouse gas emissions and combat climate change. Converting such acceptance into local acceptance can be a challenge, nonetheless. Public opposition usually arises due to concerns related to visual impacts, noise, and disruption of traditional land uses or marine ecosystems. For example, the visual prominence of wind turbines over seascape and landscape, and their unavoidable visibility, have been a source of debate for a long time. People also worry about noise pollution and shadow flicker, but regulatory tools, such as setbacks, can help avoid these impacts.44IPCC, I. P. O. C. C. RENEWABLE ENERGY SOURCES AND CLIMATE CHANGE MITIGATION SUMMARY FOR POLICYMAKERS AND TECHNICAL SUMMARY. (2012).,77Ian D. Bishopa, David R. Millerb. Visual assessment of off-shore wind turbines the influence of distance, contrast, movement and social variables. (2016).,78John Glasson, B. D., Tokunbo Olorundami and Kellie Welch. Guidance on assessing the socio-economic impacts of offshore wind farms. (2020).,79Alice Freiberg1, C. S. J. H. A. S. The influence of wind turbine visibility on the health of local residents. (2018).
Surprisingly, attitudes towards offshore wind developments may change. For instance, public opinion polls of developments like the U.S. Block Island Offshore Wind Project showed that while people were initially worried, attitudes soon became milder or even positive, once the development was complete and the residents understood the true impacts. Such a change in attitude is quite often influenced by participatory action and procedural justice, as, if the planners feel involved and heard, there is a tendency for the projects to be embraced by the residents.80Innovation, E. Why People Oppose Or Support Offshore Wind: Distilling The Key Factors That Drive Social Acceptance Of Ocean Renewable Energy. (2022).,81Ollson2, L. D. K. a. C. A. Health effects and wind turbines A review of the literature. (2011).
Offshore wind farms have numerous positive impacts on host regions, one of the most significant ones being significant job opportunities in various lifecycle phases. Installation, construction, and operation of offshore wind farms require professional laborers, promoting the development of employees along coastal areas. For example, it is predicted that the world’s offshore wind workforce will grow by 50% from 2024 to 2028, creating tens of thousands of new jobs. These positions cut across various industries, ranging from technology development, operations, and maintenance. Offshore wind capacity expansion in Europe alone could add over €200 billion to the economy by 2030.46COUNCIL, G. W. E. GLOBAL WIND REPORT 2024. (2024).,82WorldBank. THE STRATEGIC value of community benefits in offshore wind development. (2024).,83Global Wind Energy, C. Global-Wind-Workforce-Outlook-2024. (2024).
Community benefit schemes are another way in which wind energy benefits society. They typically cover the provision of money for local infrastructure, skills development schemes, and community ownership schemes that offer a financial return to communities. These kinds of projects are vital in easing social disparities, particularly in underprivileged or peripheral areas. Offshore wind also serves to slow down health risks introduced by pollution caused by fossil fuels, thus fewer respiratory problems and other diseases among nearby populations.81Ollson2, L. D. K. a. C. A. Health effects and wind turbines A review of the literature. (2011).,82WorldBank. THE STRATEGIC value of community benefits in offshore wind development. (2024).,84Fact, W. E. T. The Social Research on Wind Energy Offshore.
Despite its benefits, offshore wind development can be plagued with issues. Visual impacts are still the most severe issue for residents near coastal lines. Large turbines disrupt normal landscapes and seascapes and lead to aesthetic discontent. While visual irritation typically decreases with greater distance from turbines, nearness can lead to issues such as shadow flicker and felt intrusions upon natural beauty. Noise from the construction and operation of turbines, including low-frequency noise, has been linked with disturbance of sleep and general annoyance. Although there are no known direct health effects, these factors can affect the quality of life of the residents.77Ian D. Bishopa, David R. Millerb. Visual assessment of off-shore wind turbines the influence of distance, contrast, movement and social variables. (2016).,79Alice Freiberg1, C. S. J. H. A. S. The influence of wind turbine visibility on the health of local residents. (2018).,81Ollson2, L. D. K. a. C. A. Health effects and wind turbines A review of the literature. (2011).
Offshore wind farms also affect economic activities, particularly fishing. Fisheries are likely to suffer from spatial competition because wind farms occupy traditional fishing grounds, leading to reduced access and potential economic loss for fishing communities. Even when artificial reefs created by turbines enable higher aggregation of fish, much of the fishing community grumble that this compensates for none of the historic livelihood loss. Additionally, efforts to resettle fishermen into alternative vocations, e.g., maintenance labor or environmental monitoring for wind farms, have encountered opposition on grounds of skill mismatching.62Van Hoey, G., Bastardie, F., Birchenough, S., De Backer, A., Gill, A., de Koning, S., Hodgson, S., Mangi Chai, S., Steenbergen, J., Termeer, E., van den Burg, S., Hintzen, N.,. Overview of the effects of offshore wind farms on fisheries and aquaculture (2021).,85WindEurope. Briefing on Offshore wind and fisheries. (2024).
Distributional equity is another problem of concern. The communities that are most affected by offshore wind farms are not necessarily the communities that gain the most benefits. Some coastal communities, for example, may feel increased housing pressure and infrastructure burden at construction phases, while economic gains are often harvested at corporate or national levels. This discrepancy highlights the need for fair compensation mechanisms and pre-consultation, participatory approaches with affected communities to answer questions of environmental justice.78John Glasson, B. D., Tokunbo Olorundami and Kellie Welch. Guidance on assessing the socio-economic impacts of offshore wind farms. (2020).,82WorldBank. THE STRATEGIC value of community benefits in offshore wind development. (2024).
To offset such social impacts, robust strategies of benefit-sharing and community consultation are required. Engaging the local stakeholders at an early and sustained level can potentially foster trust and a “social license to operate.” Practices like Local Community Liaison Officers being appointed, conducting participatory workshops, and designing benefit programs tailored to local needs are becoming prevalent among developers. They encompass Denmark’s co-ownership models, where communities acquire interests in wind farms, and Community Benefit Agreements (CBAs) funding community infrastructure and social initiatives.80Innovation, E. Why People Oppose Or Support Offshore Wind: Distilling The Key Factors That Drive Social Acceptance Of Ocean Renewable Energy. (2022).,82WorldBank. THE STRATEGIC value of community benefits in offshore wind development. (2024).
Moreover, the integration of socioeconomic considerations into planning processes through methods like Strategic Environmental Assessments (SEAs) and Maritime Spatial Planning (MSP) can help anticipate and prevent conflicts. Governments and developers must collaborate to reconcile the interests of different stakeholders, including fishermen, locals, and renewable energy advocates.78John Glasson, B. D., Tokunbo Olorundami and Kellie Welch. Guidance on assessing the socio-economic impacts of offshore wind farms. (2020).,85WindEurope. Briefing on Offshore wind and fisheries. (2024).
Offshore wind power social impacts are two-way, having positive opportunities along with challenges. Offshore wind farms contribute towards economic growth, job creation, and public well-being while creating aesthetic problems, fairness issues, and effects on public welfare. Offshore wind power, through tackling these issues from the very beginning by adopting transparent planning, fair compensation, and community engagement, can expand on as part of sustainable growth.44IPCC, I. P. O. C. C. RENEWABLE ENERGY SOURCES AND CLIMATE CHANGE MITIGATION SUMMARY FOR POLICYMAKERS AND TECHNICAL SUMMARY. (2012).,46COUNCIL, G. W. E. GLOBAL WIND REPORT 2024. (2024).,81Ollson2, L. D. K. a. C. A. Health effects and wind turbines A review of the literature. (2011).,82WorldBank. THE STRATEGIC value of community benefits in offshore wind development. (2024).,84Fact, W. E. T. The Social Research on Wind Energy Offshore.
11 Workforce development and skills
Workforce development is a key enabler for the large-scale deployment of offshore wind energy, as the sector generates high-quality employment opportunities across engineering, manufacturing, maritime operations, installation, maintenance, and environmental monitoring activities. Studies indicate that the expansion of offshore wind projects can create substantial regional employment and economic benefits throughout the project lifecycle, including planning, construction, and operations.86Offshore Wind Facts. Jobs and Workforce Development in Offshore Wind. To meet the growing demand for skilled labor, collaborative training pathways involving industry partners, vocational schools, universities, and labor organizations are increasingly being established to prepare technicians and engineers for offshore wind operations.87Clark, C., McDowell, B., Pons, B., & Stefek, J. (2023). Offshore wind workforce development best practices. National Renewable Energy Laboratory (NREL). https://www.nrel.gov/docs/fy23osti/87405.pdf Standardized training and certification programs—particularly those developed by the Global Wind Organisation (GWO)—provide internationally recognized competencies in areas such as sea survival, working at heights, fire awareness, and manual handling, ensuring workforce safety and operational readiness in offshore environments.88Global Wind Organisation (GWO). Global Safety Training Standards for the Wind Industry. Workforce outlook studies further project that tens of thousands of additional workers will require GWO-certified training to support the rapid global expansion of offshore wind capacity in the coming years.89Global Wind Energy Council (GWEC) & Global Wind Organisation (GWO). Powering the Future: Global Offshore Wind Workforce Outlook 2020–2024. In addition to technical skill development, policies that promote diversity, local workforce participation, and inclusive hiring practices contribute to a just energy transition by strengthening public acceptance and ensuring that the economic benefits of offshore wind development are broadly distributed within local communities.86Offshore Wind Facts. Jobs and Workforce Development in Offshore Wind.
12 Political and legal aspects
Offshore wind is key to meeting global climate goals and fundamental step to enable the successful deployment globally is the permitting process. Currently there are three models: centralized – governments take control of the process and decreases risk for developers, decentralized – two stage model that gives developers greater flexibility but also higher risk, hybrid – combination of other two and is easier to adapt to particular country contexts based on the respective political, fiscal and cultural backdrop. The deployment models are inclusive of the permitting process like conducting of marine spatial planning (MSP), environmental and social impact assessment (ESIA), stakeholder management and gaining requisite approvals during the project development cycle.90Dhavle, J. & Nguyen, T. Enabling frameworks for offshore wind scale up: innovations in permitting. (International Renewable Energy Agency, 2023).
The key recommendations based on the policy brief by IRENA and GWEC under the Collaborative Framework for Ocean Energy Technologies and Offshore Renewables are:90Dhavle, J. & Nguyen, T. Enabling frameworks for offshore wind scale up: innovations in permitting. (International Renewable Energy Agency, 2023).
• One stop shop – Establish capable institutions for efficient permitting
• Stakeholder Consultations – Engage local communities throughout the project
• Mandated Lead Times – Set limits to reduce bureaucracy and disputes
• Digital Training Courses – Train staff to use digital tools for permitting
• Digital and Searchable Databases – Develop database for streamlined processes
• Alignment of Land and Ocean Use – Clear guidelines for offshore infrastructure
• Emergency Clearing Mechanisms – Fast track legal systems for dispute resolution
• Energy Infrastructure Permits – Standardize regulations for deployment
The 1982 UN Convention on the Law of the Sea (UNCLOS) provides the primary international legal framework for offshore renewable project development, jurisdiction in different maritime zones and addressing sovereignty. Subject only to the right of innocent passage for other states’ ships, coastal states have exclusive sovereignty to install offshore renewables (0-12) nautical miles. Exclusive Economic Zones (EEZ) up to 200 nautical miles, coastal states have sovereign rights to produce energy from winds, currents and water but balance these with overflight, submarine cables/pipelines, freedoms of navigation for other states. Similar sovereign rights apply to continental shelf with limits respecting high seas freedoms, high seas are currently not feasible for offshore installations due to technical and economic constraints. Coastal states are also mandated by the UNCLOS to protect and preserve the marine environment including mitigation of offshore installations like underwater noise, biodiversity risks and habitat loss.91United Nations Convention on the Law of the Sea. (1982).
To accelerate the deployment of offshore renewables, there is a need for stable, streamlined and binding regulatory frameworks that will strongly address the lengthy and complex authorization procedures. Many states have shifted from first come, first served to competitive auctions for site allocations. This ensures efficiency and also increases the investors’ confidence. Some countries have one stop shop systems using centralized authorities to streamline licensing and reduce administrative burden and delays. In order to avoid overlap and delays there is a need for coordination between dedicated legislation and agencies and clearly defined timeframes.92Salvador, S. & Ribeiro, M. C. Socio‐economic, legal, and political context of offshore renewable energies. WIREs Energy & Environment 12, e462 (2023). https://doi.org:10.1002/wene.462 An example of the permitting process in established offshore wind market is as follows:93Vasconcelos, R. M. D., Silva, L. L. C., González, M. O. A., Santiso, A. M. & De Melo, D. C. Environmental licensing for offshore wind farms: Guidelines and policy implications for new markets. Energy Policy 171, 113248 (2022). https://doi.org:10.1016/j.enpol.2022.113248
• Tendering: Maritime Spatial Planning (MSP) for Site Development Plan (SDP) T Site investigation of the areas defined in the SDP Areas are auctioned in a competitive procedure The bidder who has been awarded a contract can erect wind turbines on the investigated site.
• Open-door procedure: Developer submits an application for Planning Permission O Competent authorities and public interest bodies consultation Developer revises its proposal The application documents are open to public inspection Applicants have an opportunity to present their projects Developer prepares Environmental Impact Assessment (EIA) and Risk Analysis Standard Investigation Concept Grant of planning permission based on submitted documents.
For new and emerging markets, guidelines and good practices in environmental licensing for development of offshore projects are as follows:93Vasconcelos, R. M. D., Silva, L. L. C., González, M. O. A., Santiso, A. M. & De Melo, D. C. Environmental licensing for offshore wind farms: Guidelines and policy implications for new markets. Energy Policy 171, 113248 (2022). https://doi.org:10.1016/j.enpol.2022.113248
• Establishment of a national offshore wind energy production target
• Mapping of marine offshore wind zones
• Adoption of “one-stop-shop” procedure
• Maritime land concession regimes: Open-doors and Tenders
• Standard procedure guide in environmental licensing for offshore wind farms
• Development of Environmental Studies
• Public, authorities and stakeholders’ consultation
• Supply Chain Development Statement
Key points on subsidies, incentives and other related mechanisms globally are summarized as follows:94Dr. Christian, K. & Dr. Anna Leah Tabios, H. Offshore Wind Worldwide: Regulatory Framework in Selected Countries. 163 (Hogan Lovells, Hamburg, 2023).
• System of green certificates and guarantees of origin issued for produced renewable energy and can be sold at minimum guaranteed price to the network operator or on the market at a higher price.
• To support grid connections, a cable subsidy has been provided for existing domain concessions. To ensure grid connection certainty, new installations will connect to Modular Offshore Grid (MOG-II) with compensation mechanisms.
• Offering long term contracts (up to 30 years) for offshore wind projects, ensuring stable revenue through feed-in tariffs, thus boosting investor confidence by making it a predictable business environment.
• Tax incentives like exemption from federal taxes, tax on imported equipment and components for turbines, higher investment and production tax credit with potential for more benefits when using more domestic content and installation of the project in energy community locations.
• To avail some of the benefits, the projects must also meet the labor standards, support local economies and job creation.
• Governments clearly indicating a long-term capacity target for offshore wind power which will demonstrate a strong political commitment and will attract investments. Regulatory uncertainties can be reduced by providing a strong legal framework for grid connectivity and leasing.
International bodies like IRENA90Dhavle, J. & Nguyen, T. Enabling frameworks for offshore wind scale up: innovations in permitting. (International Renewable Energy Agency, 2023)., IEA Wind Technology Collaboration Programme (TCP)95International Energy, A., Holttinen, H. & Jørgensen, B. H. IEA Wind TCP Annual Report 2023. (2024). and Paris Agreement adopted in 2015 under United Nations Framework Convention on Climate Change (UNFCCC)96Paris Agreement – United Nations Framework Convention on Climate Change (UNFCCC). (2015). drive global offshore wind policies by setting targets and encouraging legal frameworks for climate goals. North Seas Energy Cooperation (NSEC) 260 GW offshore wind target by 2050 promotes cross-border collaborations, reduce political barriers, enhanced grid integration and permitting harmonization.97The North Seas Energy Cooperation (NSEC). (2016). These 2050 ambitions are explicitly complemented by interim targets of at least 76 GW by 2030 and 193 GW by 2040, reflecting staged goals for expanding offshore wind capacity across the region.98World Energy Council. (2022, September 16). North Seas Energy Cooperation commits to 260 GW offshore wind by 2050. World-Energy. Retrieved from https://www.world-energy.org/article/26716.html? A diplomatic and multi-stakeholder initiative founded by GWEC, IRENA and Government of Denmark at COP 27 called Membership of the Global Wind Alliance (GOWA) has been joined by 20 governments and have pledge to collaborate towards installing 380 GW of offshore wind by 2030 and 2000 GW by 2050.2Global Wind Energy, C., Rebecca, W. & Feng, Z. Global Offshore Wind Report 2024. 156 (Brussels, Belgium, 2024).
International communities and global industry have welcomed the offshore wind targets set by the governments in COP 26 and COP 27 and to push it to the forefront of many countries’ renewable development. To unlock the offshore wind potential and reach the set targets, the development of cohesive, efficient and accelerated permitting protocols and alleviate the main factors hampering the permitting like complexity of administration and bureaucratic processes, lack of central authorities, lack of holistic planning to capture complex stakeholder interactions, streamlined digital resources and clear shared understanding of permitting rules between promoters and permitting entities.90Dhavle, J. & Nguyen, T. Enabling frameworks for offshore wind scale up: innovations in permitting. (International Renewable Energy Agency, 2023). Technological innovations are a critical factor for global energy transition and will enable in reduction of cost of energy and large-scale offshore wind deployment. Reports published by GWEC and BCG suggest that by 2026/27 all the regions except China will face severe supply chain bottlenecks in offshore wind components and a global collaboration between industry and government is more important than ever.2Global Wind Energy, C., Rebecca, W. & Feng, Z. Global Offshore Wind Report 2024. 156 (Brussels, Belgium, 2024).
13 Digitalization, data, and cybersecurity
Modern offshore wind farms rely heavily on digital infrastructure such as Supervisory Control and Data Acquisition (SCADA) systems, advanced analytics platforms, and remote monitoring technologies.99International Energy Agency. Offshore Wind Outlook 2019. Paris: IEA, 2019.,100National Renewable Energy Laboratory. Digitalization and the Future of Wind Energy Operations. NREL Report, 2021. These systems enable continuous data collection from turbines, substations, meteorological sensors, and subsea infrastructure.101International Electrotechnical Commission. IEC 62443 – Industrial Communication Networks and Systems Security. IEC Standards, 2022.,102National Institute of Standards and Technology. Guide to Industrial Control Systems (ICS) Security. NIST Special Publication 800-82, 2015. The integration of digital technologies allows operators to monitor equipment performance in real time, optimize maintenance schedules, and improve overall asset management throughout the project lifecycle.
One of the most important digital innovations in offshore wind operations is the use of digital twins. A digital twin is a virtual representation of a physical asset or system that continuously receives operational data from sensors and monitoring systems.101International Electrotechnical Commission. IEC 62443 – Industrial Communication Networks and Systems Security. IEC Standards, 2022.,102National Institute of Standards and Technology. Guide to Industrial Control Systems (ICS) Security. NIST Special Publication 800-82, 2015. By simulating real-world operating conditions, digital twins enable operators to analyse turbine performance, detect anomalies, and predict component failures before they occur. This predictive capability significantly improves reliability and reduces unexpected downtime. In offshore wind farms where maintenance activities are expensive due to vessel mobilization and weather constraints, predictive maintenance strategies based on digital twin models and machine learning algorithms can substantially reduce operation and maintenance (O&M) costs while extending the service life of critical components such as gearboxes, generators, and power electronics.
Advanced data analytics also plays a key role in condition-based maintenance (CBM).103Tautz-Weinert, J., & Watson, S. J. (2017). Using SCADA data for wind turbine condition monitoring – A review. Renewable and Sustainable Energy Reviews, 75, 371–391. https://doi.org/10.1016/j.rser.2016.11.050 Traditional maintenance strategies often rely on fixed schedules, which may result in unnecessary servicing or delayed fault detection. In contrast, CBM uses data from sensors measuring vibration, temperature, electrical signals, and lubrication conditions to determine the actual health of turbine components. By combining these data streams with machine learning techniques, operators can identify degradation patterns and optimize maintenance interventions. Studies have shown that data-driven maintenance strategies can reduce downtime and improve energy yield by ensuring turbines operate closer to their optimal performance conditions.
The increasing digitalization of offshore wind farms also introduces cybersecurity risks, as operational technology (OT) systems become interconnected with information technology (IT) networks and external communication channels. SCADA systems are responsible for controlling turbine operations, monitoring power production, and managing grid interactions. Because these systems are connected through communication networks that link offshore turbines, substations, and onshore control centers, they can potentially become targets for cyber-attacks. A successful cyber intrusion could disrupt turbine operations, manipulate data, or interfere with grid stability.
To address these risks, robust cybersecurity frameworks are required. Secure SCADA architectures typically incorporate network segmentation, firewalls, encrypted communication protocols, and strict access control mechanisms to protect operational networks from unauthorized access.104IRENA. Digitalization of Energy Systems. Abu Dhabi: International Renewable Energy Agency, 2019.,105Deloitte. (2022). Cyber risk in the power sector: Managing cybersecurity in renewable energy infrastructure. Deloitte. Continuous monitoring systems are also implemented to detect abnormal network activity and potential cyber threats in real time. International standards and guidelines, such as those developed by organizations like the International Electrotechnical Commission (IEC) and the National Institute of Standards and Technology (NIST), provide best practices for securing industrial control systems used in energy infrastructure.
Another important consideration in digital offshore wind operations is data governance. Offshore wind farms generate large volumes of operational data from turbines, environmental monitoring systems, and grid interfaces. Effective data governance frameworks are necessary to ensure that this data is managed securely and used responsibly. This includes establishing policies for data ownership, storage, sharing, and regulatory compliance. Proper data governance allows developers and operators to maximize the value of operational data for performance optimization while ensuring compliance with privacy regulations and cybersecurity requirements.
Digitalization is transforming offshore wind farm management by enabling predictive maintenance, improving operational efficiency, and enhancing system reliability. However, the growing dependence on digital infrastructure also necessitates strong cybersecurity measures and effective data governance frameworks. As offshore wind capacity continues to expand globally, integrating advanced analytics, digital twins, and secure digital architectures will be essential for ensuring safe, resilient, and efficient offshore wind operations.
14 Coexistence and multi-use at sea
The concept of coexistence and multi-use at sea has gained increasing attention in marine spatial planning. Multi-use strategies aim to integrate offshore wind energy production with other maritime activities such as fisheries, aquaculture, marine conservation, and transportation corridors. When properly designed and managed, such approaches can improve the overall sustainability of offshore wind projects while providing additional environmental, social, and economic benefits.
One important strategy to enhance coexistence is nature-inclusive design (NID). Nature-inclusive design integrates ecological considerations into the planning, construction, and operation of offshore wind infrastructure. For example, scour protection around turbine foundations are typically composed of rock or gravel and can be modified to create reef-like habitats that promote biodiversity. These artificial reef structures may provide shelter and feeding grounds for fish, crustaceans, and other marine organisms, thereby enhancing local ecosystem productivity. Studies have shown that turbine foundations can function as artificial reefs, supporting diverse communities of marine species and potentially improving ecological conditions in otherwise disturbed seabed areas.106Degraer, S., Brabant, R., & Rumes, B. (2020). Environmental impacts of offshore wind farms in the Belgian part of the North Sea. Royal Belgian Institute of Natural Sciences.,107International Energy Agency (IEA) (2022). Offshore Wind Outlook 2022. Paris. In addition, design features such as textured surfaces, habitat modules, or eco-engineered materials can further support colonization by marine flora and fauna.
Offshore wind developments may restrict fishing activities within wind farm boundaries for safety reasons, potentially leading to economic impacts for local fishing communities. To address this challenge, several projects have introduced fisheries compensation schemes, co-management frameworks, and designated transit corridors. Fisheries co-management involves collaboration between developers, regulators, and fishing communities to establish guidelines for safe navigation, partial fishing access, or shared monitoring programs. In some regions, compensation mechanisms are implemented to offset economic losses during construction or operational phases. Designated navigation and transit corridors can also allow fishing vessels and other maritime users to safely pass through or around wind farm areas, thereby reducing spatial conflicts and maintaining maritime connectivity.108European Commission (2020). EU Guidance on Offshore Wind and Maritime Spatial Planning. Brussels.
Offshore wind farms often create de facto protected zones where certain fishing practices are limited, which can provide favourable conditions for sustainable aquaculture operations. Pilot projects in Europe and Asia have explored integrating shellfish farming, seaweed cultivation, and other marine food production systems within wind farm boundaries. Seaweed aquaculture, in particular, has received significant attention because it requires relatively low infrastructure, contributes to carbon sequestration, and can support local blue economy initiatives. Additionally, some projects combine wind farm infrastructure with habitat restoration efforts, such as oyster reef restoration or marine biodiversity enhancement programs.109Buck, B. H., Krause, G., Pogoda, B., Grote, B., Wever, L., Goseberg, N., Schupp, M. F., Mochtak, A., & Czybulka, D. (2017). The German case study: Pioneer projects of aquaculture–wind farm multi-uses. In B. H. Buck & R. Langan (Eds.), Aquaculture perspective of multi-use sites in the open ocean: The untapped potential for marine resources in the Anthropocene (pp. 253–354). Springer. https://doi.org/10.1007/978-3-319-51159-7_11
Successful implementation of multi-use strategies requires inclusive stakeholder engagement and robust marine spatial planning frameworks. Early involvement of fishermen, aquaculture operators, environmental organizations, and coastal communities can help identify potential conflicts and develop mutually beneficial solutions. Transparent communication, data sharing, and adaptive management approaches are essential for maintaining trust and ensuring that offshore wind developments contribute positively to regional marine economies. Furthermore, regulatory frameworks and planning policies must support integrated ocean management in order to facilitate safe and sustainable multi-use activities.
15 Decommissioning and circular economy
Offshore wind turbines typically have an operational lifetime of approximately 20–25 years, after which they may undergo decommissioning, repowering, refurbishment, or life extension. Planning for these end-of-life strategies during the early stages of project development is essential to minimize environmental impacts, manage costs effectively, and maximize the recovery and reuse of valuable materials.110International Energy Agency. Offshore Wind Outlook 2022. Paris: IEA, 2022. Early lifecycle planning helps ensure that offshore wind infrastructure can be dismantled responsibly and that materials can be recovered efficiently at the end of the project lifecycle.
In circular offshore wind development, the implementation of design for disassembly and modular construction is very important. Turbines and associated infrastructure can be designed in a way that allows components such as nacelles, towers, foundations, and electrical equipment to be dismantled efficiently at the end of their operational life. Modular designs facilitate easier transportation, refurbishment, and replacement of individual components. This approach not only reduces the complexity and cost of decommissioning operations but also enables parts of the wind farm infrastructure to be reused in other projects or repurposed for alternative applications. Early integration of circular design principles also supports compliance with environmental regulations and sustainability goals established by governments and industry organizations.111European Commission. Circular Economy Action Plan for Renewable Energy Infrastructure, 2020.
Another major challenge in the circular management of offshore wind infrastructure is the recycling of turbine blades. Wind turbine blades are primarily composed of composite materials such as Glass fiber reinforced plastics and carbon fiber composites, which are difficult to recycle using traditional mechanical recycling processes. Historically, many retired blades have been disposed of in landfills, raising concerns about long-term environmental sustainability. However, recent technological developments have introduced several promising recycling approaches, including mechanical shredding, thermal treatment (pyrolysis), and chemical recycling techniques. These methods enable the recovery of fibers and resins that can be reused in construction materials, cement production, or new composite products.112International Renewable Energy Agency. End-of-Life Management of Wind Turbine Blades. Abu Dhabi, 2019.,113Jensen, J. P., & Skelton, K. (2018). Wind turbine blade recycling: Experiences, challenges, and possibilities. Renewable and Sustainable Energy Reviews. Increasing research efforts and industrial initiatives are focused on scaling these technologies to support the growing volume of decommissioned turbine blades expected in the coming decades.114Wind Europe. Accelerating Wind Turbine Blade Circularity. Brussels, 2020.
Repowering is another key strategy that contributes to circular economy principles in offshore wind energy systems. Instead of fully dismantling an existing wind farm, repowering involves replacing older turbines with modern, higher-capacity turbines that can generate significantly more electricity using the same site infrastructure. Advances in turbine technology have resulted in larger rotor diameters, improved aerodynamic efficiency, and higher rated capacities, allowing new turbines to produce more energy while reducing the number of units required. Repowering projects therefore extend the productive life of offshore wind sites, reduce the need for new seabed installations, and improve overall energy output while minimizing environmental disturbances.110International Energy Agency. Offshore Wind Outlook 2022. Paris: IEA, 2022.
Effective material recovery and recycling are also important aspects of offshore wind decommissioning strategies. Wind turbines contain substantial quantities of recyclable materials such as steel, copper, aluminium, and rare metals used in electrical components. These materials can be recovered during dismantling and reintroduced into industrial supply chains, thereby reducing the demand for raw material extraction and lowering the environmental footprint of renewable energy infrastructure. The development of specialized recycling facilities and supply chains for wind turbine components will play a crucial role in enabling large-scale circular economy practices within the offshore wind sector.114Wind Europe. Accelerating Wind Turbine Blade Circularity. Brussels, 2020.
In addition to technical considerations, successful implementation of decommissioning and circular economy strategies requires clear regulatory frameworks and financial planning mechanisms. Many countries require offshore wind developers to establish financial guarantees or decommissioning funds to ensure that the costs associated with dismantling and site restoration are covered at the end of the project lifecycle. Transparent regulatory guidelines also help ensure that decommissioning activities protect marine ecosystems, restore seabed conditions where necessary, and manage waste responsibly. Furthermore, investments in recycling infrastructure and research are essential to support sustainable end-of-life management as offshore wind installations continue to grow globally.111European Commission. Circular Economy Action Plan for Renewable Energy Infrastructure, 2020.
16 Insurance and risk transfer
Offshore wind projects involve large capital investments, complex engineering systems, and challenging marine environments. As a result, developers and investors must carefully manage a wide range of technical, financial, and operational risks throughout the project lifecycle. Insurance and risk transfer mechanisms play a critical role in protecting project stakeholders, ensuring financial stability, and enabling access to project financing. Comprehensive insurance programs and contractual risk allocation strategies help mitigate uncertainties related to construction, equipment failure, delays, and environmental conditions.115International Energy Agency. Offshore Wind Outlook 2022. Paris, 2022.,116International Renewable Energy Agency. Renewable Energy Finance: Risk Mitigation Instruments. Abu Dhabi, 2020.
One of the most important components of risk management in offshore wind projects is construction all-risk (CAR) insurance. This type of insurance provides coverage for potential losses or damages that may occur during the construction phase, including installation of turbines, offshore substations, foundations, and subsea cables. Construction activities in offshore environments face several hazards such as severe weather conditions, transportation accidents, equipment failures, and installation errors. CAR policies therefore protect project developers, contractors, and financiers from financial losses associated with unexpected events during the construction process.117DNV. Risk Management and Insurance Considerations for Offshore Wind Projects. DNV Energy Report, 2021.
Another important insurance category is marine cargo insurance, which covers the transportation of large and specialized wind turbine components from manufacturing facilities to offshore installation sites. Offshore wind turbines require the movement of heavy components such as blades, towers, nacelles, and foundations using specialized vessels and port infrastructure. Because these components are often transported across long distances and exposed to maritime risks such as storms, collisions, or handling damage, marine cargo insurance is essential to safeguard the supply chain and prevent costly disruptions.118WindEurope. Financing and Risk Management in Offshore Wind Projects. Brussels, 2021.
Offshore wind projects also commonly rely on delay-in-startup (DSU) insurance, which provides financial protection against revenue losses resulting from project delays. Construction delays may occur due to adverse weather conditions, supply chain disruptions, or technical challenges encountered during installation. DSU insurance compensates project owners and investors for the loss of expected revenue if the wind farm cannot begin operations according to the planned schedule. This type of coverage is particularly important for projects financed through project finance structures, where timely commissioning is necessary to meet debt repayment obligations.116International Renewable Energy Agency. Renewable Energy Finance: Risk Mitigation Instruments. Abu Dhabi, 2020.
During the operational phase, performance guarantees and operational insurance policies help ensure that wind turbines achieve the expected levels of electricity generation and reliability. Turbine manufacturers typically provide performance guarantees covering factors such as power output, availability, and reliability over specified time periods. If the equipment fails to meet contractual performance targets, the manufacturer may be required to compensate the project owner or undertake corrective measures. Operational insurance policies further cover risks such as equipment breakdown, cable failures, and damage caused by extreme weather events, thereby helping maintain financial stability throughout the operational lifetime of the wind farm.119Musial, W., et al. Large-Scale Offshore Wind Power in the United States: Assessment of Opportunities and Barriers. National Renewable Energy Laboratory, 2019.
Offshore wind projects require comprehensive risk management frameworks due to their high capital costs and exposure to marine operational hazards. Studies show that financial and regulatory safeguards such as decommissioning bonds and performance guarantees are commonly required to ensure responsible project closure and to protect public interests.120BEIS (2018). Cost Estimation and Liabilities in Decommissioning Offshore Wind Installations. UK Department for Business, Energy & Industrial Strategy. Analyses of offshore wind decommissioning liabilities in the United Kingdom estimate that decommissioning costs can represent roughly 2–3 % of the total capital expenditure of a wind farm, highlighting the need for dedicated financial security mechanisms to cover end-of-life removal and site restoration.120BEIS (2018). Cost Estimation and Liabilities in Decommissioning Offshore Wind Installations. UK Department for Business, Energy & Industrial Strategy. Research on renewable energy project finance further indicates that structured risk allocation and insurance mechanisms significantly reduce investment uncertainty and improve project bankability.121Kitzing, L., Mitchell, C., & Morthorst, P. (2016). Risks and risk management of renewable energy projects: The case of onshore and offshore wind parks. Renewable and Sustainable Energy Reviews. https://doi.org/10.1016/j.rser.2016.01.103 In addition, lifecycle risk management frameworks emphasize the importance of maintaining detailed risk registers and engaging insurers early during the planning phase, which can improve underwriting assessments and enhance overall project resilience.122Zhang, Y., et al. (2023). Macroeconomic impact on the risk management of offshore wind farms. Ocean Engineering. https://doi.org/10.1016/j.oceaneng.2023.115224 These measures are particularly important in offshore wind developments where construction delays, extreme weather events, and equipment failures can lead to substantial financial losses if risks are not adequately transferred or mitigated.123Frederiksen, R. D., et al. (2024). Cost-Effectiveness of Predictive Maintenance for Offshore Wind Farms: A Case Study. Energies. https://doi.org/10.3390/en17133147
17 Lifecycle cost comparison with other renewable energy technologies
Offshore wind energy generally exhibits higher lifecycle costs compared with other renewable technologies due to the complexity of offshore construction, specialized installation vessels, subsea cable systems, and grid connection infrastructure. Global assessments indicate that the levelized cost of electricity (LCOE) for offshore wind averages about 81 USD/MWh, compared with approximately 33 USD/MWh for onshore wind and 49 USD/MWh for solar photovoltaic (PV) systems, reflecting the higher capital and operational expenditures associated with marine environments.124International Renewable Energy Agency (IRENA). (2023). Renewable Power Generation Costs in 2022. Abu Dhabi. Capital investment requirements further illustrate this difference, with offshore wind capital expenditure (CAPEX) projected at around 1730–2570 €/kW, compared with 940–1210 €/kW for onshore wind and 250–430 €/kW for solar PV.125Schmidt, O., et al. (2022). Capital expenditure and levelized cost of electricity of photovoltaic plants and wind turbines – Development by 2050. Renewable Energy. Similarly, European cost analyses estimate electricity generation costs for offshore wind in the range of 7.2–12.1 €cent/kWh, which is generally higher than onshore wind but competitive with some other low-carbon generation technologies.126Fraunhofer Institute for Solar Energy Systems (ISE). (2021). Levelized Cost of Electricity Study. Despite these higher lifecycle costs, offshore wind offers significant advantages such as higher and more stable wind resources, larger turbine capacities, and higher capacity factors, which can improve long-term energy yield and support large-scale renewable electricity generation near major coastal demand centers.127Evans, A., Strezov, V., & Evans, T. (2013). A comparative analysis of renewable electricity generation technologies. Applied Energy.
18 Community engagement best practices in emerging markets
Effective community engagement is a critical factor in the successful development of offshore wind projects in emerging markets, where coastal communities often depend on marine resources for their livelihoods. Research indicates that early stakeholder involvement during project planning and site selection can significantly improve public acceptance, with participatory engagement processes shown to increase support for renewable energy projects by 20–30 % compared with projects developed without early consultation.128Velasco-Herrejón, P., et al. (2020). Co-production in the wind energy sector: A systematic literature review of public engagement beyond invited stakeholder participation. Energy Research & Social Science. Transparent communication regarding environmental impacts, economic benefits, and project timelines also helps build trust and reduce local opposition.129World Bank ESMAP (2024). The Strategic Value of Community Benefits in Offshore Wind Development. Studies further highlight the importance of community benefit programs, such as local employment opportunities, infrastructure development, and training initiatives. For example, offshore wind projects can generate thousands of local jobs during construction and several hundred long-term operational positions, while community benefit funds in European wind projects typically allocate €1,000–€5,000 per MW per year to support local development initiatives.130Walker, B., Wiersma, B., & Bailey, E. (2014). Community benefits, framing and the social acceptance of offshore wind farms: An experimental study in England. Energy Research & Social Science.,129World Bank ESMAP (2024). The Strategic Value of Community Benefits in Offshore Wind Development. In addition, participatory models that allow community co-investment or shared ownership have been shown to significantly increase project acceptance, with surveys indicating that local support can increase by up to 15–20 % when communities are offered financial participation in renewable energy projects.131Knauf, J., & Wüstenhagen, R. (2023). Crowdsourcing social acceptance: Why, when and how project developers offer citizens to co-invest in wind power. Energy Policy. Integrating these best practices—early engagement, transparent communication, community benefits, and participatory decision-making—can therefore support socially sustainable offshore wind deployment in emerging markets while fostering long-term collaboration between developers, governments, and coastal communities.
References
- 1Grid Integration of Offshore Wind Power: Standards, Control, Power Quality and Transmission.
- 2Global Wind Energy, C., Rebecca, W. & Feng, Z. Global Offshore Wind Report 2024. 156 (Brussels, Belgium, 2024).
- 3Su, X. et al. Offshore Wind Power: Progress of the Edge Tool, Which Can Promote Sustainable Energy Development. Sustainability 16, 7810 (2024). https://doi.org:10.3390/su16177810
- 4Wu, X. et al. Foundations of offshore wind turbines: A review. Renewable and Sustainable Energy Reviews 104, 379-393 (2019). https://doi.org:10.1016/j.rser.2019.01.012
- 5Angus, M., Eric, U., Ulf, M., Christine, G. & Virginia, S.-O. B. Global trends in renewable energy investment 2013. (Frankfurt School-UNEP Centre/BNEF (2013)).
- 6Esteban, M. D., Diez, J. J., López, J. S. & Negro, V. Why offshore wind energy? Renewable Energy 36, 444-450 (2011). https://doi.org:10.1016/j.renene.2010.07.009
- 7Wu, J., Wang, Z.-X. & Wang, G.-Q. The key technologies and development of offshore wind farm in China. Renewable and Sustainable Energy Reviews 34, 453-462 (2014). https://doi.org:10.1016/j.rser.2014.03.023
- 8O’Kelly, B. C. & Arshad, M. in Offshore Wind Farms 589-610 (Elsevier, 2016).
- 9Laura, C.-S. & Vicente, D.-C. Floating offshore wind farms. (Springer International Publishing, 2016).
- 10Global Wind Energy Council (via Anadolu Agency). (2024, January 20). Global offshore wind capacity rises 24% in 2023, second highest growth in offshore wind history. Anadolu Agency. https://www.aa.com.tr/en/energy/electricity/global-offshore-wind-capacity-rises-24-in-2023-second-highest-growth-in-offshore-wind-history/42117
- 11Dr. Rohit Kumar, G. Advancements in Offshore Wind Energy Technology: Challenges and Opportunities for Sustainable Power Generation. Indian Journal of Renewable Energy 1, 1-6 (2024).
- 12Angel, M. et al. Offshore Wind Market Report: 2024 Edition. (National Renewable Energy Laboratory).
- 13The World Bank – Energy Sector Management Assistance, P. Offshore Wind Technical Potential Analysis Maps.
- 14Adrijana, B. (2024).
- 15Business Norway. (2025). How offshore wind turbines are connected to the grid. https://businessnorway.com/articles/how-offshore-wind-turbines-are-connected-to-the-grid
- 16Bundesverband Windenergie Offshore. (n.d.). Structure and function of an offshore wind farm. https://bwo-offshorewind.de/en/category/themen/grundlagen/aufbau-und-funktion-eines-owp/
- 17Optimization of offshore grid planning considering onshore network expansions – Liu et al. – https://doi.org/10.1016/j.renene.2021.08.117
- 18Grid Connection Studies for Large-Scale Offshore Wind Farms Considering High Penetration of Regional Renewables – Choi et al. – DOI:10.3390/su14021015
- 19Offshore Wind Integration in the North Sea: The Benefits of an Offshore Grid and Floating Wind – Glaum, Neumann & Brown, 2023 – DOI:10.48550/arXiv.2305.01996
- 20Curis, J.-B., Descloux, J., Grisey, N., Wagner, A., Göksu, Ö., Saborío-Romano, O., Brantl, C., Kaiser, M., Quester, M., Ruffing, P., Dupont, B., Henneaux, P., Karoui, K., Nesterov, D., Irazabal, I. A., MacIver, C., & Bell, K. (2016). Deliverable 1.3: Synthesis of available studies on offshore meshed HVDC grids. PROMOTion – Progress on Meshed HVDC Offshore Transmission Networks. https://orbit.dtu.dk/en/publications/deliverable-13-synthesis-of-available-studies-on-offshore-meshed-/
- 21A Centralized Voltage Controller for Offshore Wind Plants: NY State Grid Case Study – Zhu et al. – DOI:10.1109/ISGT-LA56058.2023.10328266.
- 22International Renewable Energy, A. Renewable Power Generation Costs in 2023. 211 (Abu Dhabi, 2024).
- 23Lazard & Roland, B. Lazard’s Levelized Cost of Energy Analysis – June 2024. 48 (Lazard, 2024).
- 24Bosch, J., Staffell, I. & Hawkes, A. D. Global levelised cost of electricity from offshore wind. Energy 189, 116357 (2019). https://doi.org:10.1016/j.energy.2019.116357
- 25Stehly, T., Duffy, P., & Mulas Hernando, D. (2023). 2022 cost of wind energy review. National Renewable Energy Laboratory. https://www.nrel.gov/docs/fy24osti/88335.pdf
- 26Bloomberg New Energy, F. Energy Transition Investment Trends 2025. (2025).
- 27International Renewable Energy, A. Tracking COP28 Outcomes: Tripling renewable power capacity by 2030. 20 (Abu Dhabi, 2024).
- 28Global Wind Energy Council. (2024). Strong 2023 offshore wind growth as industry sets course for record-breaking decade. https://www.gwec.net/news/strong-2023-offshore-wind-growth/
- 29International Renewable Energy Agency. (2023). Renewable power generation costs in 2022. https://www.irena.org/-/media/Files/IRENA/Agency/Publication/2023/Aug/IRENA_Renewable_power_generation_costs_in_2022.pdf
- 30Global Energy Prize Foundation. (2024, October 5). Wind power costs continue to decline. https://globalenergyprize.org/en/2024/10/05/wind-power-costs-continue-to-decline/
- 31https://www.irena.org/publications/2020/Apr/Global-Renewables-Outlook-2020
- 32IEA 2019 Offshore Wind Outlook
- 33GWEC 2023 Global Offshore Wind Report
- 34OECD 2021 Supply Chain Resilience in Renewable Energy.
- 35Development of a Combined Operational and Strategic Decision Support Model for Offshore Wind – https://doi.org/10.1016/j.egypro.2013.07.169
- 36Ahsan, D., Pedersen, S., Nielsen, M. R., & Ovesen, J. (2019). Why does the offshore wind industry need standardized HSE management systems? An evidence from Denmark. Renewable Energy, 136, 691–700. https://doi.org/10.1016/j.renene.2019.01.034
- 37Wind Energy Ireland. (2023). Offshore safety guidelines gap analysis report (Revision 03 – June 2023). https://www.windenergyireland.com/images/files/offshore-safety-report-june-2023-final-updated-design.pdf
- 38Bailey, B. H., & Freedman, J. M. (2024). Developments in metocean information in support of US offshore wind energy and the ocean sciences. Oceanography, 37(3), 30–41. https://doi.org/10.5670/oceanog.2024.503
- 39Huang, B., Hu, K., Yin, G., Chen, R., & Du, J. (2022). Typhoon resistance analysis of offshore wind turbines: A review. Atmosphere, 13(3), 451. https://doi.org/10.3390/atmos13030451
- 40Liu, Y., Wei, W., & Wang, C. (2023). Investigation of typhoon-induced wind waves for deep-sea wind power platform design. Journal of Marine Science and Engineering, 13(5), 838. https://doi.org/10.3390/jmse13050838
- 41Etemaddar, M., Hansen, M. O. L., & Moan, T. (2014). Response analysis of a spar-type floating offshore wind turbine under atmospheric icing conditions. Journal of Ocean and Wind Energy, 1(4), 193–201. https://orbit.dtu.dk/en/publications/response-analysis-of-a-spar-type-floating-offshore-wind-turbine-u/.
- 42Maureen Hand (USA), O. H. G., David Infi eld (United Kingdom), Peter H. Jensen (Denmark), Vladimir Nikolaev (Russia), Mark O’Malley (Ireland), Graham Sinden (United Kingdom/Australia), Arthouros Zervos (Greece). Wind Energy. (2010).
- 43J.K. Kaldellis*, D. A. Life cycle energy and carbon footprint of offshore wind energy Comparison with onshore counterpart. (2017).
- 44IPCC, I. P. O. C. C. RENEWABLE ENERGY SOURCES AND CLIMATE CHANGE MITIGATION SUMMARY FOR POLICYMAKERS AND TECHNICAL SUMMARY. (2012).
- 45Thomas Bruckner (Germany), L. F. U., Edgar Hertwich (Austria / Norway), Alan McKinnon (UK / Germany), Daniel Perczyk (Argentina), Joyashree Roy (India), Roberto Schaeffer (Brazil), Steffen Schlömer (Germany), Ralph Sims (New Zealand), Pete Smith (UK), Ryan Wiser (USA). Technology-specific Cost and Performance Parameters. (2014).
- 46COUNCIL, G. W. E. GLOBAL WIND REPORT 2024. (2024).
- 47Chen Li, J. M. M., Arnold Tukker, and Bernhard Steubing. Environmental Impacts of Global Offshore Wind Energy Development until 2040. (2022).
- 48Orsted. What is the carbon footprint of offshore wind?
- 49HaskoningDHV, R. Carbon Footprint Assessment. (2020).
- 50Berndt*, M. L. Influence of concrete mix design on CO₂ emissions for large wind turbine foundations. (2015).
- 51Alexandra Bonou ⇑, A. L., Stig I. Olsen. Life cycle assessment of onshore and offshore wind energy-from theory to application. (2016).
- 52Liang Tsai, J. C. K., Brett S. Simon, Rachel M. Chalat, and Gregory A. Keoleian. Life Cycle Assessment of Offshore Wind Farm Siting. (2016).
- 53Spyroudi, A. Carbon footprint of offshore wind farm components. (2021).
- 54Shifeng Wang a, c., Sicong Wang b, *, Jinxiang Liu a. Life-cycle green-house gas emissions of onshore and offshore wind turbines. (2019).
- 55R Camilla Thomson, G. P. H. Life Cycle Costs and Carbon Emissions of Offshore Wind Power. (2015).
- 56Stephen C.L. Watson a, b., *, Paul J. Somerfield a, Ana¨elle J. Lemasson c, Antony M. Knights c, Andrew Edwards-Jones a,b, Joana Nunes a, Christine Pascoe a, Caroline Louise McNeill a, Michaela Schratzberger d, Murray S.A. Thompson d, Elena Couce d, Claire L. Szostek a,b, Heather Baxter a,b, Nicola J. Beaumont The global impact of offshore wind farms on ecosystem services. (2024).
- 57Chen Li, J. W. P. C., Laura Scherer, José M. Mogollón, Ulrike Braeckman, Jan Vanaverbeke, Arnold Tukker, and Bernhard Steubing. Offshore Wind Energy and Marine Biodiversity in the NorthSea: Life Cycle Impact Assessment for Benthic Communities. (2023).
- 58Elizabeth T. Methratta, A. H., Brian R. Hooker, Andrew Lipsky and Jonathan A. Hare. Offshore Wind Development in the Northeast US Shelf Large Marine Ecosystem. (2020).
- 59Chia-Hsiang Chen 1 and Nan-Jay Su 2, 4. Global Trends and Characteristics of Offshore Wind Farm Research over the Past Three Decades: A Bibliometric Analysis. (2022).
- 60Fatemeh Rezaei a, Pasquale Contestabile a,b, Diego Vicinanza a,b,c, Arianna Azzellino Towards understanding environmental and cumulative impacts of floating wind farms Lessons learned from the fixed bottom offshore wind farm. (2023).
- 61Andrew B. Gill, S. D., Andrew Lipsky, Ninon Mavraki, Elizabeth Methratta and Robin Brabant. SETTING THE CONTEXT FOR OFFSHORE WIND DEVELOPMENT EFFECTS ON FISH AND FISHERIES. (2020).
- 62Van Hoey, G., Bastardie, F., Birchenough, S., De Backer, A., Gill, A., de Koning, S., Hodgson, S., Mangi Chai, S., Steenbergen, J., Termeer, E., van den Burg, S., Hintzen, N.,. Overview of the effects of offshore wind farms on fisheries and aquaculture (2021).
- 63Steven Degraer, D. A. C., Joop W.P. Coolen, Zoë L. Hutchison, Francis Kerckhof, Bob Rumes and Jan Vanaverbeke. OFFSHORE WIND FARM ARTIFICIAL REEFS AFFECT ECOSYSTEM STRUCTURE AND FUNCTIONING. (2020).
- 64Karl M. Werner a, 1, Holger Haslob a, Anna F. Reichel a, Antje Gimpel a,b, Vanessa Stelzenmüller a. Offshore wind farm foundations as artificial reefs: The devil is in the detail. (2024).
- 65Lijing Wang 1 , Bangguo Wang 1 , 2 , Wenxi Cen 1 , 2 ,Rui Xu 3 , 4 ,Yuwei Huang 5 , Xin Zhang 1 , 2 , Yinghui Han 1 , 2 , ∗, Yuanxun Zhang 1 , 2 , 6. Ecological impacts of the expansion of offshore wind farms on trophic level species of marine food chain. (2024).
- 66T. Aran Mooney, M. H. A. a. J. S. ACOUSTIC IMPACTS OF OFFSHORE WIND ENERGY ON FISHERY RESOURCES. (2020).
- 67Zoë L. Hutchison, D. H. S. a. A. B. G. The Interaction Between Resource Species and Electromagnetic Fields Associated with Electricity Production by Offshore Wind Farms. (2020).
- 68Aurore Raouxa, b., ∗, Samuele Tecchioa, Jean-Philippe Pezyb, Géraldine Lassallec, Steven Degraerd, Dan Wilhelmssone, Marie Cacherag, Bruno Ernandef, Camille Le Guena, Matilda Haraldssona, Karine Grangeréa, Franc¸ ois Le Loc’hg, Jean-Claude Dauvinb, Nathalie Niquila. Climate change effects on the ecophysiology and ecological functioning of an offshore wind farm artificial hard substrate community. (2022).
- 69Joshua van Berkel, H. B., Asbjørn Christensen, Lars O. Mortensen, Ole Svenstrup Petersen and Frank Thomsen. The Effects of Offshore Wind Farms on Hydrodynamics and Implications for Fishes. (2020).
- 70Hall R a, Topham E b,a, Jo˜ao E Environmental Impact Assessment for the decommissioning of offshore wind farms (2015).
- 71Ashley M Fowler1*, A.-M. J., Jon C Svendsen3, Peter I Macreadie4, Daniel OB Jones5, Arjen R Boon6, David J Booth1, Robin Brabant7, Emily Callahan8, Jeremy T Claisse9, Thomas G Dahlgren10,11, Steven Degraer7, Quenton R Dokken12, Andrew B Gill13, David G Johns14, Robert J Leewis15, Han J Lindeboom16,17, Olof Linden18, Roel May19, Albertinka J Murk20, Geir Ottersen21,22, Donna M Schroeder23, Sunil M Shastri24, Jonas Teilmann25, Victoria Todd26,27, Gert Van Hoey28, Jan Vanaverbeke7, and Joop WP Coolen. Environmental benefits of leaving offshore infrastructure in the ocean. (2018).
- 72Vanessa Spielmann a, Jennifer Dannheim b,c, Thomas Brey a,b,c, Joop W.P. Coolen d,e. Decommissioning of offshore wind farms and its impact on benthic ecology. (2023).
- 73Aurore Raouxa, b., ∗, Samuele Tecchioa, Jean-Philippe Pezyb, Géraldine Lassallec, Steven Degraerd, Dan Wilhelmssone, Marie Cacherag, Bruno Ernandef, Camille Le Guena, Matilda Haraldssona, Karine Grangeréa, Franc¸ ois Le Loc’hg, Jean-Claude Dauvinb, Nathalie Niquila. Benthic and fish aggregation inside an offshore wind farm: Which effects on the trophic web functioning? (2017).
- 74WindEurope. Offshore wind and biodiversity.
- 75Roberto Danovaro a, b., *, Silvia Bianchelli a,b, Paola Brambilla c, Gaia Brussa d, Cinzia Corinaldesi b,e, Adriana Del Borghi f, Antonio Dell’Anno a,b, Simonetta Fraschetti b,g, Silvestro Greco h, Mario Grosso d, Ettore Nepote a,b, Lucia Rigamonti d, Ferdinando Boero. Making eco-sustainable floating offshore wind farms: Siting, mitigations, and compensations. (2024).
- 76Tobias Bo¨ rger *, T. L. H., Melanie C. Austen. Valuation of ecological and amenity impacts of an offshore windfarm as a factor in marine planning. (2015).
- 77Ian D. Bishopa, David R. Millerb. Visual assessment of off-shore wind turbines the influence of distance, contrast, movement and social variables. (2016).
- 78John Glasson, B. D., Tokunbo Olorundami and Kellie Welch. Guidance on assessing the socio-economic impacts of offshore wind farms. (2020).
- 79Alice Freiberg1, C. S. J. H. A. S. The influence of wind turbine visibility on the health of local residents. (2018).
- 80Innovation, E. Why People Oppose Or Support Offshore Wind: Distilling The Key Factors That Drive Social Acceptance Of Ocean Renewable Energy. (2022).
- 81Ollson2, L. D. K. a. C. A. Health effects and wind turbines A review of the literature. (2011).
- 82WorldBank. THE STRATEGIC value of community benefits in offshore wind development. (2024).
- 83Global Wind Energy, C. Global-Wind-Workforce-Outlook-2024. (2024).
- 84Fact, W. E. T. The Social Research on Wind Energy Offshore.
- 85WindEurope. Briefing on Offshore wind and fisheries. (2024).
- 86Offshore Wind Facts. Jobs and Workforce Development in Offshore Wind.
- 87Clark, C., McDowell, B., Pons, B., & Stefek, J. (2023). Offshore wind workforce development best practices. National Renewable Energy Laboratory (NREL). https://www.nrel.gov/docs/fy23osti/87405.pdf
- 88Global Wind Organisation (GWO). Global Safety Training Standards for the Wind Industry.
- 89Global Wind Energy Council (GWEC) & Global Wind Organisation (GWO). Powering the Future: Global Offshore Wind Workforce Outlook 2020–2024.
- 90Dhavle, J. & Nguyen, T. Enabling frameworks for offshore wind scale up: innovations in permitting. (International Renewable Energy Agency, 2023).
- 91United Nations Convention on the Law of the Sea. (1982).
- 92Salvador, S. & Ribeiro, M. C. Socio‐economic, legal, and political context of offshore renewable energies. WIREs Energy & Environment 12, e462 (2023). https://doi.org:10.1002/wene.462
- 93Vasconcelos, R. M. D., Silva, L. L. C., González, M. O. A., Santiso, A. M. & De Melo, D. C. Environmental licensing for offshore wind farms: Guidelines and policy implications for new markets. Energy Policy 171, 113248 (2022). https://doi.org:10.1016/j.enpol.2022.113248
- 94Dr. Christian, K. & Dr. Anna Leah Tabios, H. Offshore Wind Worldwide: Regulatory Framework in Selected Countries. 163 (Hogan Lovells, Hamburg, 2023).
- 95International Energy, A., Holttinen, H. & Jørgensen, B. H. IEA Wind TCP Annual Report 2023. (2024).
- 96Paris Agreement – United Nations Framework Convention on Climate Change (UNFCCC). (2015).
- 97The North Seas Energy Cooperation (NSEC). (2016).
- 98World Energy Council. (2022, September 16). North Seas Energy Cooperation commits to 260 GW offshore wind by 2050. World-Energy. Retrieved from https://www.world-energy.org/article/26716.html?
- 99International Energy Agency. Offshore Wind Outlook 2019. Paris: IEA, 2019.
- 100National Renewable Energy Laboratory. Digitalization and the Future of Wind Energy Operations. NREL Report, 2021.
- 101International Electrotechnical Commission. IEC 62443 – Industrial Communication Networks and Systems Security. IEC Standards, 2022.
- 102National Institute of Standards and Technology. Guide to Industrial Control Systems (ICS) Security. NIST Special Publication 800-82, 2015.
- 103Tautz-Weinert, J., & Watson, S. J. (2017). Using SCADA data for wind turbine condition monitoring – A review. Renewable and Sustainable Energy Reviews, 75, 371–391. https://doi.org/10.1016/j.rser.2016.11.050
- 104IRENA. Digitalization of Energy Systems. Abu Dhabi: International Renewable Energy Agency, 2019.
- 105Deloitte. (2022). Cyber risk in the power sector: Managing cybersecurity in renewable energy infrastructure. Deloitte.
- 106Degraer, S., Brabant, R., & Rumes, B. (2020). Environmental impacts of offshore wind farms in the Belgian part of the North Sea. Royal Belgian Institute of Natural Sciences.
- 107International Energy Agency (IEA) (2022). Offshore Wind Outlook 2022. Paris.
- 108European Commission (2020). EU Guidance on Offshore Wind and Maritime Spatial Planning. Brussels.
- 109Buck, B. H., Krause, G., Pogoda, B., Grote, B., Wever, L., Goseberg, N., Schupp, M. F., Mochtak, A., & Czybulka, D. (2017). The German case study: Pioneer projects of aquaculture–wind farm multi-uses. In B. H. Buck & R. Langan (Eds.), Aquaculture perspective of multi-use sites in the open ocean: The untapped potential for marine resources in the Anthropocene (pp. 253–354). Springer. https://doi.org/10.1007/978-3-319-51159-7_11
- 110International Energy Agency. Offshore Wind Outlook 2022. Paris: IEA, 2022.
- 111European Commission. Circular Economy Action Plan for Renewable Energy Infrastructure, 2020.
- 112International Renewable Energy Agency. End-of-Life Management of Wind Turbine Blades. Abu Dhabi, 2019.
- 113Jensen, J. P., & Skelton, K. (2018). Wind turbine blade recycling: Experiences, challenges, and possibilities. Renewable and Sustainable Energy Reviews.
- 114Wind Europe. Accelerating Wind Turbine Blade Circularity. Brussels, 2020.
- 115International Energy Agency. Offshore Wind Outlook 2022. Paris, 2022.
- 116International Renewable Energy Agency. Renewable Energy Finance: Risk Mitigation Instruments. Abu Dhabi, 2020.
- 117DNV. Risk Management and Insurance Considerations for Offshore Wind Projects. DNV Energy Report, 2021.
- 118WindEurope. Financing and Risk Management in Offshore Wind Projects. Brussels, 2021.
- 119Musial, W., et al. Large-Scale Offshore Wind Power in the United States: Assessment of Opportunities and Barriers. National Renewable Energy Laboratory, 2019.
- 120BEIS (2018). Cost Estimation and Liabilities in Decommissioning Offshore Wind Installations. UK Department for Business, Energy & Industrial Strategy.
- 121Kitzing, L., Mitchell, C., & Morthorst, P. (2016). Risks and risk management of renewable energy projects: The case of onshore and offshore wind parks. Renewable and Sustainable Energy Reviews. https://doi.org/10.1016/j.rser.2016.01.103
- 122Zhang, Y., et al. (2023). Macroeconomic impact on the risk management of offshore wind farms. Ocean Engineering. https://doi.org/10.1016/j.oceaneng.2023.115224
- 123Frederiksen, R. D., et al. (2024). Cost-Effectiveness of Predictive Maintenance for Offshore Wind Farms: A Case Study. Energies. https://doi.org/10.3390/en17133147
- 124International Renewable Energy Agency (IRENA). (2023). Renewable Power Generation Costs in 2022. Abu Dhabi.
- 125Schmidt, O., et al. (2022). Capital expenditure and levelized cost of electricity of photovoltaic plants and wind turbines – Development by 2050. Renewable Energy.
- 126Fraunhofer Institute for Solar Energy Systems (ISE). (2021). Levelized Cost of Electricity Study.
- 127Evans, A., Strezov, V., & Evans, T. (2013). A comparative analysis of renewable electricity generation technologies. Applied Energy.
- 128Velasco-Herrejón, P., et al. (2020). Co-production in the wind energy sector: A systematic literature review of public engagement beyond invited stakeholder participation. Energy Research & Social Science.
- 129World Bank ESMAP (2024). The Strategic Value of Community Benefits in Offshore Wind Development.
- 130Walker, B., Wiersma, B., & Bailey, E. (2014). Community benefits, framing and the social acceptance of offshore wind farms: An experimental study in England. Energy Research & Social Science.
- 131Knauf, J., & Wüstenhagen, R. (2023). Crowdsourcing social acceptance: Why, when and how project developers offer citizens to co-invest in wind power. Energy Policy.