Authors: Mohammad Rasel, Fahmida Amin, Dlal Gema Hamid Mohammed
Edited by: Francisco Suárez, Leon Campos de Lima
Last updated: May 18, 2026
Executive summary
Solar photovoltaic (PV) technology converts sunlight directly into electricity using semiconductor materials. It has become a central pillar of the global energy transition due to its scalability, declining costs, and low operational emissions. Continuous technological innovation—particularly in crystalline silicon, thin-film, and emerging tandem cell technologies—has driven steady improvements in efficiency and performance.
From a technical perspective, system design decisions such as module type, inverter architecture, and tracking configuration strongly influence energy yield, reliability, and cost. Performance depends on factors including irradiance, temperature, degradation rates, and operational practices such as maintenance and monitoring. Integration into power systems requires advanced inverter capabilities to support grid stability as solar penetration increases.
Economically, solar PV has experienced a dramatic cost decline driven by economies of scale, manufacturing advancements, and global competition. The levelized cost of electricity (LCOE) for solar PV is now among the lowest of all energy sources in many regions, enabling widespread deployment across residential, commercial, and utility-scale applications. Continued innovation and supportive policy frameworks are expected to further enhance competitiveness.
Environmentally, PV systems offer substantial benefits, including very low lifecycle greenhouse gas emissions and short energy payback times. However, large-scale deployment requires careful management of land use, material sourcing, and end-of-life recycling. Strategies such as agrivoltaics, use of degraded land, and circular economy approaches can mitigate ecological impacts and improve sustainability.
Socially, solar PV contributes to job creation, improved public health, and increased energy access, particularly in underserved regions. Public acceptance has grown significantly, driven by declining costs and visible adoption. Policy frameworks—such as feed-in tariffs, tax incentives, and auctions—have played a critical role in accelerating deployment, although they must be carefully designed to avoid market distortions and ensure long-term stability.
1 Description and history
Rising global energy demand and growing environmental and economic concerns have driven a significant shift toward renewable energy sources. Among these, solar photovoltaic (PV) technology has emerged as a key solution due to its ability to harness clean and sustainable energy. Solar PV systems provide a non-polluting energy alternative, contributing to global efforts toward reducing carbon footprints and dependence on fossil fuels. As a result, solar PV has gained widespread adoption and continues to be a focal point in energy research and development.
A solar cell is the fundamental unit of a photovoltaic system, consisting of semiconductor materials that convert sunlight into electrical energy through the photovoltaic effect. These cells are assembled into solar panels or modules, which are typically connected in series or parallel to achieve the required voltage and current levels for various applications.1Zhang, C., et al., Semiconductor photovoltaic cells. 2021: Springer. Solar PV systems are widely used in residential, commercial, and industrial settings, powering everything from small electronic devices to large-scale grid-connected energy systems.
Theoretical principle: A PV cell converts sunlight into electricity through the photovoltaic effect. Sunlight is composed of various photons packets of solar energy. These photons contain different amounts of energy that correspond to the different wavelengths of the solar spectrum. When photons strike a PV cell, they may be reflected or absorbed, or they may pass right through. An important property of PV semiconductors is the bandgap, which indicates the wavelengths of light that can pass through the material. The absorbed photons generate electricity.2Cook, G., Photovoltaic fundamentals. 1991: Solar Energy Research Institute. If the bandgap is too big, the energy of the photons would not be enough to excite the electrons and produce electricity. In contrast, if the bandgap is too small, part of the energy will be absorbed and converted into electricity but most of it will be lost in recombination.3Energy, U.S.D.o. Solar Photovoltaic Cell Basics. 2025 18 March 2026; Available from: https://www.energy.gov/eere/solar/solar-photovoltaic-cell-basics. The efficiency of a solar cell, defined as the percentage of sunlight energy converted into usable electrical energy, varies based on the materials used and the technology employed.
Solar energy harnessing technologies are primarily categorized into two branches: Concentrated Solar Power (CSP) and Photovoltaic (PV) systems. The concentrated solar power system uses mirrors or lenses which focus extensive sunlight sections to generate heat for driving steam turbines that power electric generators.4Feeds, S. Concentrated Solar Power (CSP) Vs Photovoltaic (PV): An In-depth Comparison. 2023; Available from: https://www.solarfeeds.com/mag/csp-and-pv-differences-comparison/. PV systems generate electricity directly from sunlight through semiconductor materials in which the photovoltaic effect occurs.4Feeds, S. Concentrated Solar Power (CSP) Vs Photovoltaic (PV): An In-depth Comparison. 2023; Available from: https://www.solarfeeds.com/mag/csp-and-pv-differences-comparison/.
Both CSP and PV systems can operate independently of conventional power grids or be integrated into existing electrical grids at various transmission or distribution levels, offering flexibility in their applications.5Energy, U.S.D.o. Solar Systems Integration Basics. 2025; Available from: https://www.energy.gov/eere/solar/solar-systems-integration-basics.
The evolution of solar photovoltaic (PV) technology: The development of solar photovoltaic (PV) technology has spanned nearly two centuries, with significant scientific discoveries and engineering breakthroughs shaping its evolution into a mainstream energy source. From the early understanding of the photovoltaic effect to the commercialization of highly efficient solar panels, the journey of solar PV technology is a testament to human innovation and the pursuit of sustainable energy solutions.
Early discoveries and inventions: The foundation of solar PV technology dates back to 1839 when French physicist Alexandre-Edmond Becquerel discovered the photovoltaic effect. In his experiment with metal electrodes in an electrolyte solution, he observed that exposure to light generated an electric current.6Marques Lameirinhas, R.A., J.P.N. Torres, and J.P. de Melo Cunha, A photovoltaic technology review: History, fundamentals and applications. Energies, 2022. 15: p. 1823. This discovery laid the groundwork for future advancements in photovoltaic technology.
Further progress was made in 1873, when Willoughby Smith identified the photoconductivity of selenium, revealing that its electrical resistance decreased when exposed to light. Building upon this discovery, Charles Fritts created the first solid-state photovoltaic cell in 1883 by coating selenium with a thin layer of gold. Although this early cell had an efficiency of only about 1%, it demonstrated the feasibility of converting sunlight directly into electricity.6Marques Lameirinhas, R.A., J.P.N. Torres, and J.P. de Melo Cunha, A photovoltaic technology review: History, fundamentals and applications. Energies, 2022. 15: p. 1823.
Theoretical advancements: The theoretical understanding of photovoltaics took a major leap in 1905 when Albert Einstein published his explanation of the photoelectric effect. His work demonstrated how photons could eject electrons from a material, creating an electric current, a principle that became fundamental to photovoltaic technology. For this groundbreaking contribution, Einstein received the Nobel Prize in Physics in 1921 (awarded in 1922).6Marques Lameirinhas, R.A., J.P.N. Torres, and J.P. de Melo Cunha, A photovoltaic technology review: History, fundamentals and applications. Energies, 2022. 15: p. 1823.,7Prize, N. All Nobel Prizes.
Development of practical solar cells: The modern era of solar PV technology began in 1954, when researchers at Bell Laboratories Calvin Fuller, and Gerald Pearson ’s colleague developed a process to dope silicon. This innovation led to the creation of the first p-n junction (diode) by immersing a doped silicon bar on lithium. They reported photovoltaic properties and an astonishing efficiency of 6%, for dopants of boron and arsenic.6Marques Lameirinhas, R.A., J.P.N. Torres, and J.P. de Melo Cunha, A photovoltaic technology review: History, fundamentals and applications. Energies, 2022. 15: p. 1823. Many argue that this event marks the true invention of PV technology because it was the first instance of solar technology that could actually power an electric device for several hours of a day.8Richardson, L. Solar history: Timeline & invention of solar panels. 2023; Available from: https://www.energysage.com/about-clean-energy/solar/the-history-and-invention-of-solar-panel-technology/. This innovation is widely regarded as the birth of modern solar PV technology.9Society, A.-A.P. April 25, 1954: Bell Labs Demonstrates the First Practical Silicon Solar Cell. 2009; Available from: https://www.aps.org/apsnews/2009/04/bell-labs-silicon-solar-cell.
Space applications and early adoption: The first major application of solar cells was in space technology. In 1958, the Vanguard I satellite became the first spacecraft to use photovoltaic cells as a power source, demonstrating their reliability in extreme conditions.10Planet, O. Vanguard 1, the first Solar-Powered Satellite and the Oldest Human-Made Object Still in Orbit was Launched on March 17, 1958. 2023; Available from: https://ourplnt.com/vanguard-1-first-solar-powered-satellite/. Following this success, solar technology was integrated into other space missions, increasing global interest in photovoltaic systems.
The 1970s; energy crisis and renewed interest: The 1973 oil crisis played a critical role in sparking renewed interest in alternative energy sources, including solar power. Governments worldwide increased investments in solar energy research, leading to significant advancements in efficiency and cost reduction. Institutions such as the U.S. Department of Energy along with private sector researchers contributed to the development of more efficient and commercially viable solar panel.11Powerlutions. The History of Solar Energy in the United States. 2023; Available from: https://powerlutions.com/blog/the-history-of-solar-energy-in-the-united-states/.
The 1980s; thin-film technology and efficiency gains: The 1980s saw significant improvements in thin-film solar cell technology, which used less material and had the potential for lower manufacturing costs. In 1980, the Institute of Energy Conversion at the University of Delaware developed the first thin-film solar cell.12Delaware, U.o. Over the Years. 2025; Available from: https://iec.udel.edu/about/. These advancements made solar technology more accessible to a broader market. Efficiencies in thin-film technologies were around 7-9 %.13National Renewable Energy Laboratory (NREL). Best research-cell efficiency chart. n.d. 22 February 2026; Available from: https://www.nrel.gov/pv/cell-efficiency.html.
The 1990s–2000s; commercialization and expansion: During the 1990s and early 2000s, solar PV technology experienced rapid commercialization. Government incentives, environmental awareness, and technological improvements led to widespread adoption. In this period the advancements in solar technology led to significant improvements in efficiency. By the early 1990s, solar panel efficiencies had reached around 15-20% for commercially available panels. The early 2000s saw significant technological breakthroughs in solar energy. Innovations in thin-film solar cells, multi-junction cells, and concentrated photovoltaic systems pushed efficiencies beyond 20%. The introduction of large-scale manufacturing processes, particularly in China, led to economies of scale that drastically reduced costs.14Energy, N.E.-C. Evolution of Solar Cost. 2025; Available from: https://newenglandcleanenergy.com/panels/evolution-of-solar-efficiency/.
The 2010s; global growth and cost reduction: The 2010s marked a period of rapid expansion for solar photovoltaic (PV) technology, characterized by significant cost reductions and increased global adoption. Manufacturing costs for solar modules dropped by approximately 90% during this decade, driven by technological advancements and economies of scale.15Data, O.W. Solar panel prices have fallen by around 20% every time global capacity doubled. 2024; Available from: https://ourworldindata.org/data-insights/solar-panel-prices-have-fallen-by-around-20-every-time-global-capacity-doubled. These substantial decreases made solar power increasingly competitive with conventional energy sources. Countries such as China, Germany, and the United States invested heavily in large-scale solar farms, integrating solar energy into their national power grids. China, for instance, became the world’s largest producer of photovoltaic power by 2015, surpassing Germany, and continued to lead in solar installations throughout the decade.16Wikipedia. Growth of photovoltaics. 2025; Available from: https://en.wikipedia.org/wiki/Growth_of_photovoltaics. Germany maintained its leadership in solar installations, contributing significantly to its renewable energy portfolio.17TheFaunaVerse. The Significance of Large Scale Solar Farms in Energy Sustainability. 2025; Available from: https://thefaunaverse.com/articles/large-scale-solar-farms-sustainable-energy/. U.S. utility-scale PV operating capacity also rose from a few gigawatts at the start of the 2010s to ~46 GWAC by end-2020, continuing to grow thereafter.18Bolinger, M. and J. Rand, Utility-Scale Solar 2023 Edition. 2023, Lawrence Berkeley National Laboratory: Berkeley, CA, United States.,19NREL. Utility-Scale PV. 2021 8/03/2026; Available from: https://atb.nrel.gov/electricity/2021/utility-scale_pv. The United States also saw substantial growth in utility-scale solar projects, with installations increasing from 2.6 GW in 2010 to over 35 GW by 2020.
Present day; a mainstream energy source: As of 2025, solar photovoltaic (PV) technology has become a mainstream energy source, contributing significantly to global electricity generation. Continuous advancements in materials science, energy storage, and grid integration have enhanced the efficiency and reliability of solar power. For instance, recent developments in photovoltaic materials have led to higher efficiency rates, making solar energy more competitive with traditional energy sources.20Dada, M. and P. Popoola, Recent advances in solar photovoltaic materials and systems for energy storage applications: a review. Beni-Suef University Journal of Basic and Applied Sciences, 2023. 12: p. 1–15.
In terms of global renewable energy targets, numerous countries have set ambitious goals to increase their renewable energy capacity. The International Renewable Energy Agency (IRENA) outlines various pathways and strategies to accelerate the deployment of solar PV to meet these objectives.21Asmelash, E. and G. Prakash, Future of Solar Photovoltaic: Deployment, investment, technology, grid integration and socio-economic aspects. 2019, International Renewable Energy Agency: Abu Dhabi. p. 1–73. These developments underscore the pivotal role of solar PV in the transition toward a sustainable energy future, ensuring that solar energy remains a key driver in the global shift towards renewables. According National Renewable Energy Laboratory (NREL) to IRENA the projected cumulative global PV capacity has been illustrated in Figure 1.
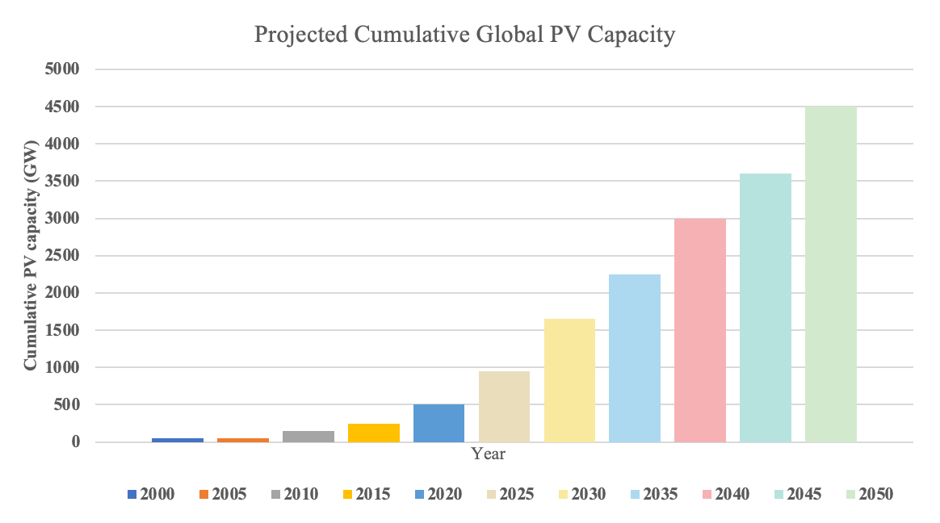
Figure 1: Projected cumulative global PV capacity.22Weckend, S., A. Wade, and G.A. Heath, End of life management: solar photovoltaic panels. 2016, National Renewable Energy Laboratory (NREL): Golden, CO (United States).
2 Technical performance
PV technology landscape and efficiency pathways
Current mainstream PV technologies are dominated by crystalline silicon (c-Si) technologies, with silicon wafer technology accounting for about 98 % of total production in 2024. The most used technologies in the industry are monocrystalline PERC (Passivated Emitted and Rear Cell), TOPCon (Tunnel Oxide Passivated Contact), and HJT (Heterojunction cell), which have progressively replaced older BSF technology.23Fraunhofer Institute for Solar Energy Systems ISE, Photovoltaics Report. 2025: Freiburg, Germany. Other commercially available technology is the thin-film cells made of cadmium telluride (CdTe), which have their main application in large solar plants.24International Energy Agency (IEA PVPS), Trends in Photovoltaic Applications. 2023, IEA Photovoltaic Power Systems Programme (IEA PVPS): Paris, France. An emerging technology nowadays are perovskite-silicon tandem cells, promising option for increasing significantly the efficiency of solar cells.
The cell structure plays an important role in increasing the efficiency and energy yield of solar cells. For instance, the use of aluminum black surface layer and aluminum oxide passivation film to form a passivation layer produce a reduction of the recombination in solar cells, which causes an increase in efficiency.25Zhang, G., et al., Industrialized high-efficiency mono-PERC cells. Photovoltaics International, 2018. Other technological advance are bifacial solar cells, which increase energy production through the use of light absorption from albedo, making possible for the solar modules to collect photons from the front and from the back side, increasing the yield power output significantly, even reaching values of 50 % more electric power generation . Another advantage of bifacial cells is that they have lower cell temperatures than traditional modules due to the reduced infrared absorption in the absence of the aluminum back metallization.26Guerrero-Lemus, R., et al., Bifacial solar photovoltaics – A technology review. Renewable and Sustainable Energy Reviews, 2016. 60.
An important improvement made in solar modules is the reduction of the surface reflection, which reached values of over 30 % in bare silicon surface. The use of a thin layer of dielectric material in the coating (Anti reflection coatings – ARC) causes a reduction in the in the reflection of solar waves. This material causes the wave from the anti-reflection coating top surface to be out of phase with the wave reflected from the semiconductor surfaces, which will destructively interfere with one another, resulting in none reflected energy.27PV Education. Anti-reflection coatings. n.d. 22 February 2026; Available from: https://www.pveducation.org/pvcdrom/design-of-silicon-cells/anti-reflection-coatings.
These advances in technology have also an effect on the levelized cost of energy LCOE. The more efficient a system is, the more energy yield it would have, which in turn, causes a reduction in the LCOE.
Solar cell performance also depends on the temperature and solar irradiance. Its performance decreases with increasing temperature, mainly due to the recombination losses. Both the electrical efficiency and the power output of the solar cell depend linearly on the temperature.28Dubey, S., J.N. Sarvaiya, and B. Seshadri, Temperature dependent photovoltaic (PV) efficiency and its effect on PV production in the world – A review. Energy Procedia, 2013. 33. In most module datasheets there is information about the temperature coefficients of the open circuit voltage and the short circuit current. The temperature coefficient on the voltage is negative and the coefficient on the current is usually positive, meaning that with increased temperature the voltage is reduced and the current increments. Also, efficiency depends on the energy output of the solar cell, and the output depends on the irradiance of the sun, so the irradiance plays an important role. Also, higher module efficiency PV plants need less space to produce the same energy, which causes less BOS costs. These aspects must be considered to increase the level gains of PV systems.
The NLR efficiency chart from 13 depicts the development of different PV technologies in terms of efficiency. Initial solar cell efficiencies, mostly crystalline Si cells) rounded between 0 and 15 % in the 80s and increased to values of over 20 % in the next decades. Then, other technologies emerged, such as multijunction cells or perovskite cells, which can reach values of over 30 %.
In Table 1, efficiencies of commercial modules and record cell efficiencies per technology are presented. Temperature coefficients and bifacial factors are also presented. The Figure 2 presents graphically this information using the maximum commercial efficiency and also the record cell efficiency by the year 2024 for these technologies.
| Technology | Model | Comercial module efficiency | Temperature coefficient [%] | Bifacial factor [%] |
| Mono Perc | JA SOLAR -JAM72D30 540-565 | 20.9-22 % | -0.35 % | 70 % |
| TopCON | Jinko Solar – Tiger Neo 72HL4 560-580 | 21.6-22.5 % | -0.29 % | 80 % |
| HJT | Sun Evo – EvoGNSEG-66HBD | 25.5 – 23.7 % | -0.24 % | 95 % |
| CdTe | Sun Evo Solar – Series7TRL 525-550 | 18.8-19.5 % | -0.32 % | — |
Table 1: Parameters of commercial solar modules.7Prize, N. All Nobel Prizes.,8Richardson, L. Solar history: Timeline & invention of solar panels. 2023; Available from: https://www.energysage.com/about-clean-energy/solar/the-history-and-invention-of-solar-panel-technology/.,9Society, A.-A.P. April 25, 1954: Bell Labs Demonstrates the First Practical Silicon Solar Cell. 2009; Available from: https://www.aps.org/apsnews/2009/04/bell-labs-silicon-solar-cell.,10Planet, O. Vanguard 1, the first Solar-Powered Satellite and the Oldest Human-Made Object Still in Orbit was Launched on March 17, 1958. 2023; Available from: https://ourplnt.com/vanguard-1-first-solar-powered-satellite/.,11Powerlutions. The History of Solar Energy in the United States. 2023; Available from: https://powerlutions.com/blog/the-history-of-solar-energy-in-the-united-states/.
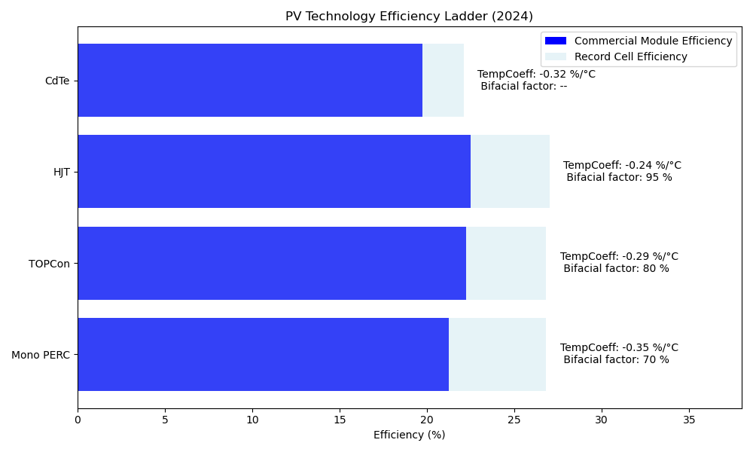
Figure 2: PV technology efficiency ladder.13National Renewable Energy Laboratory (NREL). Best research-cell efficiency chart. n.d. 22 February 2026; Available from: https://www.nrel.gov/pv/cell-efficiency.html.,29ENF Ltd. Crystalline Solar Panel Datasheet (Model ID: 59728). n.d. 1 March 2026; Available from: https://de.enfsolar.com/pv/panel-datasheet/crystalline/59728.,30AIKO Solar Co., L., EVO 6N N-Type HJT Bifacial Double Glass 132 Half-Cells 700–715 W Module Datasheet. 2024, AIKO Solar Co., Ltd.,31Jinko Solar Co., L., JKM560–580N-72HL4-BDV-F3 Module Datasheet. 2023, Jinko Solar Co., Ltd.,32JA Solar Technology Co., L., JAM72D30 540–565/GB Series Specification Sheet. 2022, JA Solar Technology Co., Ltd.
Performance metrics and reliability
I. Capacity factor
The capacity factor represents the percentage of usability of a PV system and is defined by the ratio of the actual annual energy output to the amount of energy the PV system would generate at full power the whole time.33Elsevier. Capacity factor. n.d. 22 February 2026; Available from: https://www.sciencedirect.com/topics/engineering/capacity-factor.
CF=E_annual/(P_rated×8760)33Elsevier. Capacity factor. n.d. 22 February 2026; Available from: https://www.sciencedirect.com/topics/engineering/capacity-factor.
Typical values of capacity factors are: For Fixed tilted systems and an inverter-loading ratio of about 1.4, the capacity factor is of about 28 %, whereas for 1-Axis tracker systems, the capacity factor is of about 35 %.34Sánchez-Pérez, P.A. and S. Kurtz, Capacity Factor Analysis of U.S. PV System Reliability and Performance. IEEE Journal of Photovoltaics, 2020. 10(3): p. 786-794.
II. Specific yield
The specific yield is one of the most commonly used performance metrics for solar systems, and it is calculated by the ratio of the total energy (kWh) to the installed capacity (kWp).34Sánchez-Pérez, P.A. and S. Kurtz, Capacity Factor Analysis of U.S. PV System Reliability and Performance. IEEE Journal of Photovoltaics, 2020. 10(3): p. 786-794. The value of the specific yield depends on the location, weather or module of the project and can normally vary from 1000 and 15000 kWh/kWhp.35Solar Power World. What is specific yield? An overview. 2017 22 February 2026; Available from: https://www.solarpowerworldonline.com/2017/08/specific-yield-overview/. For bifacial modules, the albedo plays an important role in the specific yield, larger values of albedo can increase significantly the specific yield in about 10-15 %.26Guerrero-Lemus, R., et al., Bifacial solar photovoltaics – A technology review. Renewable and Sustainable Energy Reviews, 2016. 60. A parameter that decreases the specific yield is soiling, which is one of the most influential factors for photovoltaic systems, causing a loss of annual energy of 3-5 %, reaching higher values in zones with higher quantities of dust and/or snow.36IEA PVPS. Soiling losses – Impact on the performance of photovoltaic power plants. n.d. 22 February 2026; Available from: https://iea-pvps.org/key-topics/soiling-losses-impact-on-the-performance-of-photovoltaic-power-plants/. Other critical factor in the energy yield is shading, which depending on the position of the object causing it, can decrease significantly the energy production of the solar module.
III. Temperature coefficient
The temperature coefficient B_ref of solar modules has an important effect on the module’s electrical efficiency at a reference temperature. This coefficient depends on the cell type, typical values are for Mono-Si is 0.004 and for a-Si 0.0011, however, it varies depending on the cell structure.28Dubey, S., J.N. Sarvaiya, and B. Seshadri, Temperature dependent photovoltaic (PV) efficiency and its effect on PV production in the world – A review. Energy Procedia, 2013. 33.
IV. Annual degradation
All solar cells degrade with time; most high-quality solar modules are typically offered a product warranty of 25-30 years and a performance warranty, guaranteeing a 1-2 % first year degradation and 0.3-0.6 % after the first year, which causes a final nominal power of about 80-87 % after their life span.37Al-Rikabi, A.A., et al., Evaluation of degradation factor effect on solar panels performance after eight years of life operation. Energy Reports, 2024. 11: p. 1123-1132.,38Straub-Mück, M., J. Geyer-Klingeberg, and A.W. Rathgeber, Determinants of the long-term degradation rate of photovoltaic modules: A meta-analysis. Renewable and Sustainable Energy Reviews, 2025. 216. These are given at certain reference conditions. In places with high temperatures, soiling and shading degradation values can increase significantly. Field studies performed in individual modules or entire systems show a degradation median value of 0.5 %/year.39Jordan, D.C. and S.R. Kurtz, Photovoltaic degradation rates—An analytical review. Progress in Photovoltaics: Research and Applications, 2013. 21: p. 12-29. These assumptions in degradation influence directly the energy yield projections and financial risk assessment associated. Underestimating degradation inflate revenues and false projections, whereas overestimating them gives low values of P50 and P90 values and affects bankability. Therefore, reliable degradation data is critical to assure adequate long-term forecasts and bank viability.
Standards, codes and certification
The International Electrotechnical Commission (IEC) standards are recognized worldwide throughout the solar industry. These standards and other international standards ensure quality, performance and safety of solar modules and installations. Some of the most used an important internation standards for photovoltaic systems are presented.
I. IEC 61215 Aging of PV modules
The standard IEC 61215 covers the parameters which are responsible for the aging of PV modules by testing if the modules will perform adequately for their life expectancy of more than 25 years in most cases. It verifies the long-term reliability and aging of PV modules under environmental stresses that simulate outside conditions. These parameters include UV radiation from sunlight, high temperatures during the day, low temperatures during the night or in winter, humidiy, rain, mechanical stress from wind or snow.40Coule Energy. Understanding solar panel certification: IEC 61215 & 61730 standards explained. n.d. 22 February 2026; Available from: https://couleenergy.com/understanding-solar-panel-certification-iec-61215-61730-standards-explained/.
II. IEC 61730 Safety qualifications
This standard defines the safety requirements that PV modules have to comply, assuring adequate operation with low electrical, mechanical risk during the module’s lifetime, guaranteeing the safety of the users and equipment. In its first part the requirements for construction and states the design characteristics of PV modules, whereas in the second part covers the requirements for testing.40Coule Energy. Understanding solar panel certification: IEC 61215 & 61730 standards explained. n.d. 22 February 2026; Available from: https://couleenergy.com/understanding-solar-panel-certification-iec-61215-61730-standards-explained/.
III. IEC 61701 Salt Mist Corrosion
The international standard IEC 61701 evaluates the resistance of photovoltaic modules to salt miss corrosion. This standard is specially important in PV installations located in places with a lot of salt exposure, such as islands and coastal regions. The salt particles can increase the degradation of solar modules and that is why this effect have to be studied and evaluated. IEC 61701 describes test sequences to determine the resistance of modules to corrosion produced by salt mist containing Cl.41International Electrotechnical Commission, IEC 61701: Photovoltaic (PV) modules – Salt mist corrosion testing. 2020: Geneva, Switzerland.
IV. IEC 62804-1 Potential-induced degradation (PID)
This standard defines procedures to evaluate the effect of short-term high voltage stress, primarily due to potential-induced degradation (PID) in crystalline silicon PV modules with silicon cells having passivating dielectric layer. PID is a degradation mechanism that occurs due to a high potential difference between the solar cell and other part of the module, such as the glass or aluminum frame, which creates a leakage current that in turn produces power losses.42GreenSolver. Potential Induced Degradation (PID): What is it? 2023; Available from: https://greensolver.net/articles/potential-induced-degradation-pid-what-is-it/. The standard specifically address degradation processes associated with mobile ionic species that either modify the electric field within the silicon semiconductor or interact electronically with the semiconductor material.43International Electrotechnical Commission (IEC), IEC TS 62804-1:2025, Photovoltaic (PV) modules – Test methods for the detection of potential-induced degradation – Part 1: Crystalline silicon. 2025: Geneva, Switzerland.
V. NEC for rapid shutdown
Rapid shutdown is a requirement in PV systems having the goal of reducing the hazard for shock responders in the event of an emergency, by being able to de-energize a PV system so that the duties of firefighters can be safely performed. In Section 690.12 of NEC the requirements for rapid shutdown are described. Basically, to satisfy rapid shutdown requirements, controlled conductors must be de-energized below a defined voltage within 30 seconds of initiation.44National Fire Protection Association, National Electrical Code (NEC), NFPA 70. 2023: Quincy, MA, USA.
The use of international standards is very important because of their acceptance in different parts of the world. These standards have been revised by commissions of experts that have defined logical steps and requirements to achieve a goal. In case of PV systems, the different standards give requirements that PV systems need to achieve to reduce technical risk and ensure good performance. Bankability also depends on the use of international standards. The reason is that the compliance of norms shows that the PV system has an expected performance and low risk of failure or low gains, which is what the banks expect.
PV system configurations
Solar photovoltaic (PV) systems are available to be installed in different configurations depending on their size, location, and grid connection. Although the photovoltaic effect is the same across all systems, design choices at the system level strongly influence energy production, reliability, maintenance requirements, and overall costs over the plant’s lifetime.24International Energy Agency (IEA PVPS), Trends in Photovoltaic Applications. 2023, IEA Photovoltaic Power Systems Programme (IEA PVPS): Paris, France.,45National Renewable Energy Laboratory (NREL), U.S. Solar Photovoltaic System and Energy Storage Cost Benchmark. 2023, National Renewable Energy Laboratory: Golden, CO, USA. Because of that, it is important to evaluate PV technology at the complete system level, including inverters, mounting structures, electrical (CC and AC) layout, and grid connection.
I. PV system typologies
In the majority of cases, PV systems are installed on rooftops (most distributed generation) or ground-mounted (most utility-scale) installations. There are more types of installation, for instance, on the walls, on fluctuating structures on the water, and others.
Rooftop PV systems are installed on residential (small), commercial (small to medium), or industrial (large) buildings. They are usually connected to the low-voltage distribution system and supply electricity directly to the building for self-consumption, and any surplus goes to the grid. This reduces transmission losses and supports decentralized energy generation.24International Energy Agency (IEA PVPS), Trends in Photovoltaic Applications. 2023, IEA Photovoltaic Power Systems Programme (IEA PVPS): Paris, France.,46REN21, Renewables Global Status Report. 2023, REN21 Secretariat: Paris, France. These systems can also be connected to medium voltage and are used to inject energy to the grid. Yet, rooftop systems are limited by roof size, orientation, tilt angle, and shading from nearby buildings or trees. The structural capacity of roofs limits the size of the system.
Ground-mounted systems are typically large utility-scale plants connected at medium- or high-voltage levels. These plants can achieve capacities of hundreds of megawatts and take advantage of cost savings through larger-scale purchasing, construction, and operational efficiencies.24International Energy Agency (IEA PVPS), Trends in Photovoltaic Applications. 2023, IEA Photovoltaic Power Systems Programme (IEA PVPS): Paris, France.,46REN21, Renewables Global Status Report. 2023, REN21 Secretariat: Paris, France. However, they need significant land areas and detailed planning, including environmental assessments and grid interconnection studies. When many large PV plants are installed in the same region, transmission congestion can happen, increasing the risk of curtailment.24International Energy Agency (IEA PVPS), Trends in Photovoltaic Applications. 2023, IEA Photovoltaic Power Systems Programme (IEA PVPS): Paris, France.,47Denholm, P. and R.M. Margolis, The potential for energy storage to reduce the curtailment of variable renewable energy. Nature Energy, 2016. 1.
A typical utility-scale plant includes module arrays, mounting structures, string or central inverters, transformers, medium-voltage collection networks, and a substation. It is important to have a good layout for optimization that can reduce shading losses, improve access for maintenance, and increase operational efficiency.
II. Fixed-tilt vs. tracking systems
Ground-mounted PV systems use fixed-tilt structures or single-axis tracking systems.
Fixed-tilt systems are mechanically simple and generally much cheaper and easier to install. Modules are installed at a constant tilt angle optimized for local solar irradiation.45National Renewable Energy Laboratory (NREL), U.S. Solar Photovoltaic System and Energy Storage Cost Benchmark. 2023, National Renewable Energy Laboratory: Golden, CO, USA. These systems have much lower maintenance needs because they do not have moving parts.
Single-axis tracking systems rotate modules during the day to follow the sun’s movement. This increases annual energy production, typically by 10–25% depending on latitude and climate conditions.48Huld, T., Impact of tracking on PV performance. Solar Energy, 2012. The energy gain is higher in regions with strong direct solar radiation. Yet, tracking systems are much more expensive and mechanically more complex, which will increase maintenance needs and operational risks.45National Renewable Energy Laboratory (NREL), U.S. Solar Photovoltaic System and Energy Storage Cost Benchmark. 2023, National Renewable Energy Laboratory: Golden, CO, USA. The decision between fixed-tilt and tracking must consider local irradiation, electricity price structure, maintenance capability, and curtailment risk. In areas with high PV penetration, additional midday generation may have lower economic value due to demand saturation.47Denholm, P. and R.M. Margolis, The potential for energy storage to reduce the curtailment of variable renewable energy. Nature Energy, 2016. 1.
III. Inverter architectures
The inverter is responsible for converting DC electricity – generated by PV modules – into AC electricity compatible with the grid. The type and model of the inverter strongly affect reliability, performance, and maintenance strategy.49Muljadi, E., Centralized versus distributed inverters in large PV plants. IEEE Transactions on Industry Applications, 2012.,50Perea, A., Comparative analysis of central and string inverters. Renewable Energy, 2018.
There are three main inverter architectures:
• Central inverters
• String inverters
• Module-level power electronics (microinverters or DC optimizers)
Central inverters are common in large utility-scale plants. They are cost-effective at high capacities and can achieve high conversion efficiency. However, they introduce bigger single points of failure. If one central inverter fails, an important part of the plant might be affected.49Muljadi, E., Centralized versus distributed inverters in large PV plants. IEEE Transactions on Industry Applications, 2012. String inverters are increasingly used in modern utility-scale systems. Each inverter manages fewer module strings, which increases redundancy. If one string inverter fails, only a small part of the plant is impacted.50Perea, A., Comparative analysis of central and string inverters. Renewable Energy, 2018. This improves overall availability and simplifies maintenance.
Module-level power electronics (MLPE), basically microinverters and DC optimizers, operate at the individual module level. They improve performance in systems with shading or mismatch conditions. Nevertheless, they increase system complexity and the number of electronic components.50Perea, A., Comparative analysis of central and string inverters. Renewable Energy, 2018. It requires more effort to install. MLPE is more common in residential and commercial rooftop systems. Electrical layout decisions, such as string length, cable sizing, and transformer configuration, impact both efficiency and reliability. Optimizing the balance of the system can greatly improve general plant performance. In order to decrease cost and efficiency, parameters like the system voltage and current in DC and AC play a fundamental role. Using high voltages and low currents reduce power losses and costs significantly.
IV. DC-to-AC ratio and clipping behavior
It is common for PV systems to be designed with a DC capacity larger than the inverter’s AC capacity. This is called the DC-to-AC ratio or inverter loading ratio (ILR). Oversizing the DC array increases energy production during most operating hours because the inverter operates closer to rated capacity more frequently.51Deline, C., et al., Assessment of inverter loading ratio impacts on PV performance. Solar Energy, 2017.
During periods of very high irradiance, the inverter cannot convert all available DC power, resulting in clipping losses. Moderate DC oversizing often increases total annual energy production and reduces LCOE.51Deline, C., et al., Assessment of inverter loading ratio impacts on PV performance. Solar Energy, 2017. The optimal DC-to-AC ratio depends on irradiance distribution, temperature conditions, electricity prices, and grid export limits.24International Energy Agency (IEA PVPS), Trends in Photovoltaic Applications. 2023, IEA Photovoltaic Power Systems Programme (IEA PVPS): Paris, France.,47Denholm, P. and R.M. Margolis, The potential for energy storage to reduce the curtailment of variable renewable energy. Nature Energy, 2016. 1. Temperature also affects clipping behavior. In hot climates, module output power decreases due to temperature losses, reducing clipping risk. Consequently, slightly higher DC-to-AC ratios may be justified in warm regions.51Deline, C., et al., Assessment of inverter loading ratio impacts on PV performance. Solar Energy, 2017.
Grid export limits in distributed systems can also impact decisions concerning system sizing. In some countries, PV systems are limited in the maximum AC power they can inject into the grid. Oversizing the DC array may increase self-consumption without breaking export controls.45National Renewable Energy Laboratory (NREL), U.S. Solar Photovoltaic System and Energy Storage Cost Benchmark. 2023, National Renewable Energy Laboratory: Golden, CO, USA. However, it has to be taken into account that there is a maximum DC to AC ratio, which depends on the PV module’s manufacturers.
Inverter loading also affects long-term reliability. Operating inverters frequently near rated capacity may increase thermal stress, which must be considered in lifecycle planning. However, in terms of costs, it is preferable to operate inverters near their rated capacity, so that they can produce more electricity in the same period of time. Figure 3 presents an example of the DC-to-AC Ratio. The blue curve represents the solar curve in a sunny day without clouds and the orange line the inverter limit. Clipping makes the delivered power not to increase this limit.
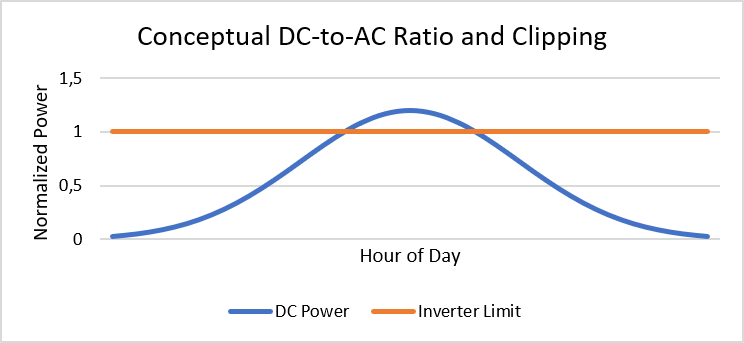
Figure 3: General normalized power behavior of an overload PV system.52Energy, S. 6 DC and AC Ratio Insights in Solar Power Plants. 2024 18 March 2026; Available from: https://soleosenergy.com/6-dc-and-ac-ratio-insights-solar-power-plants/.
Integration of inverter-based resources into the grid
As PV penetration grows, solar power becomes a major component of the electricity system. PV plants operate as inverter-based resources (IBRs), which differ from conventional synchronous generators.53Kroposki, B., et al., Achieving a 100% renewable grid: Operating electric power systems with extremely high levels of variable renewable energy. IEEE Power & Energy Magazine, 2017.
I. Differences from conventional generation
Traditional power plants use rotating machines that provide mechanical inertia. This inertia stabilizes grid frequency during disturbances. When there are disturbances, the electrical frequency changes, and the high masses try to spin faster or slower to balance the generation with the demand, however, the inertia do not permit sudden changes in velocity, which is why rotational machines stabilize frequency. PV systems do not naturally provide rotational inertia because they are connected through power electronic converters. It is not the nature of the PV system.54Ulbig, A., T. Borsche, and G. Andersson, Impact of low rotational inertia on power system stability and operation. IFAC Proceedings Volumes, 2014. 47.
Reduced inertia can increase frequency deviations after disturbances. Therefore, modern inverters must provide advanced control functions to support grid stability.54Ulbig, A., T. Borsche, and G. Andersson, Impact of low rotational inertia on power system stability and operation. IFAC Proceedings Volumes, 2014. 47.,55Simpson-Porco, J.W., F. Dörfler, and F. Bullo, Voltage stabilization in microgrids via quadratic droop control. IEEE Transactions on Power Systems, 2017.
Today’s inverters can provide reactive power control, voltage regulation, and fault-ride-through capability.55Simpson-Porco, J.W., F. Dörfler, and F. Bullo, Voltage stabilization in microgrids via quadratic droop control. IEEE Transactions on Power Systems, 2017. Fault ride-through allows PV systems to remain connected during short voltage drops, supporting system stability.
Grid-forming inverters represent a more recent development. Unlike traditional grid-following inverters, grid-forming inverters can help establish voltage and frequency under certain conditions. This capability is important in weak grids or systems with very high renewable participation.
II. Voltage regulation and hosting capacity
In distribution grids, high PV penetration may cause voltage rise and reverse power flow. Hosting capacity refers to the maximum amount of PV that can be integrated without exceeding voltage or thermal limits.56Peças Lopes, J.A., et al., Integrating distributed generation into electric power systems: A review of drivers, challenges and opportunities. Electric Power Systems Research, 2007.
Advanced inverter functions, such as reactive power support, can increase hosting capacity and reduce the need for grid upgrades.55Simpson-Porco, J.W., F. Dörfler, and F. Bullo, Voltage stabilization in microgrids via quadratic droop control. IEEE Transactions on Power Systems, 2017. However, physical network restrictions still limit integration levels. Grid regulations increasingly require PV systems to provide specific dynamic performance capabilities.
III. Curtailment
Curtailment occurs when available PV generation cannot be injected into the grid due to congestion or balancing limitations.47Denholm, P. and R.M. Margolis, The potential for energy storage to reduce the curtailment of variable renewable energy. Nature Energy, 2016. 1. Curtailment reduces the effective capacity factor and earnings.
In regions with high solar energy use, wholesale electricity prices often decrease significantly during midday hours. In extreme cases, prices may become negative. Under such conditions, generation may be reduced for economic reasons.47Denholm, P. and R.M. Margolis, The potential for energy storage to reduce the curtailment of variable renewable energy. Nature Energy, 2016. 1.
Transmission tie-ups can also lead to curtailment. PV-rich regions may lack sufficient export capacity to meet the demand of the centers. Grid expansion projects typically involve long planning and approval processes.
IV. Hybrid PV and storage systems
Battery storage can mitigate curtailment by shifting excess midday generation to evening peak demand periods.53Kroposki, B., et al., Achieving a 100% renewable grid: Operating electric power systems with extremely high levels of variable renewable energy. IEEE Power & Energy Magazine, 2017. Even short-duration storage (2–4 hours) can significantly improve plant economics.
Hybrid PV with storage systems can also provide auxiliary services such as frequency regulation. This increases gain streams and improves grid flexibility.53Kroposki, B., et al., Achieving a 100% renewable grid: Operating electric power systems with extremely high levels of variable renewable energy. IEEE Power & Energy Magazine, 2017.
As renewable penetration increases, hybrid systems may become standard in many markets. Improving resource efficiency by reducing curtailment improves renewable energy utilization. The following Figure is an example of how the behavior of PV systems with and without storage can be. Without Battery storage the whole energy is given away to the grid or it is lost in the cases the grid injection is not possible. Besides, at night, the demand cannot be met. In turn, in the PV system with storage, the extra PV generation is give to the batteries, which meet the demand in low irradiation hours.
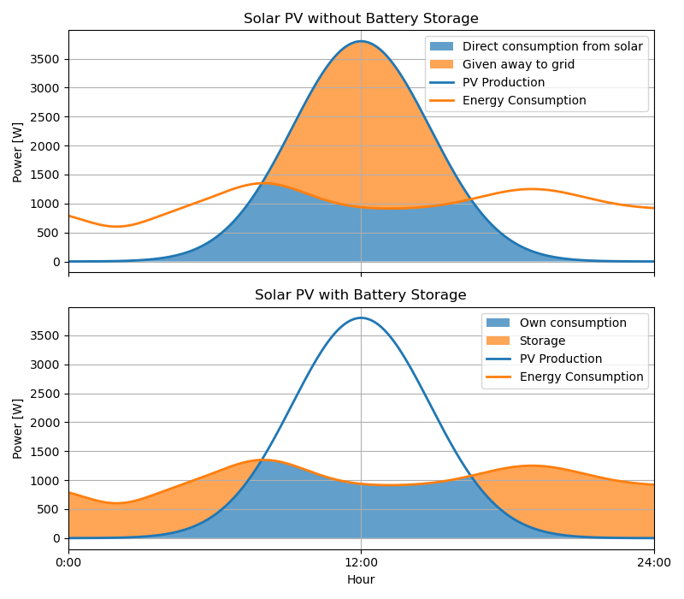
Figure 4: Comparison between the power behavior of a PV System (with and without storage)57HelioStorage. Battery. 18 March 2026; Available from: https://heliostorage.com/products/battery/.
Hybrid topologies using batteries is a good way to reduce curtailment and give better energy management. However, it has to be taken into account that batteries are more expensive that regular PV systems. An alternative to storage is the demand response, which involves the shift of electricity demand to help balance the grid and reduce the power consumption difference between peak hours and low demand hours. This is increasingly important with a network dominated by variable power generation such as solar PV or wind. Incentives to users to shift their consumption to times with higher renewable generation is the mechanism used by the demand response.58Agency, I.E. Demand Response. 2024 18 March 2026; Available from: https://www.iea.org/energy-system/energy-efficiency-and-demand/demand-response.
3 Economic performance
In the last two decades, solar photovoltaic (PV) technology has undergone significant advancement. Which results to a dramatic reduction in costs and making it an increasingly competitive alternative to traditional energy sources. Initially, in the 1970s, solar PV technology was prohibitively expensive, with costs around $76 per watt, primarily due to inefficiencies and the small scale of production.59IEA. Evolution of solar PV module cost by data source, 1970–2020. 2020; Available from: https://www.iea.org/data-and-statistics/charts/evolution-of-solar-pv-module-cost-by-data-source-1970-2020. However, solar PV has become one of the most affordable sources of energy today due to a combination of technological innovations, improved manufacturing processes, and economies of scale.
Technological advancements and cost reductions: One of the major drivers behind the decline in solar PV costs has been technological progress. Over the years, improvements in manufacturing techniques, materials, and design of solar cells have led to higher efficiency and lower production costs. Since 2010, the global average cost of solar PV has decreased by over 80%, driven by innovations in materials, manufacturing processes, and system designs. These advancements, such as the development of more efficient photovoltaic cells like PERC, and improvements in inverters and energy storage, have made solar PV more efficient and reliable, thus reducing installation costs and increasing energy output.60Kumar, R.R., et al., Phase change materials and nano-enhanced phase change materials for thermal energy storage in photovoltaic thermal systems: A futuristic approach and its technical challenges. Renewable and Sustainable Energy Reviews, 2020. 133: p. 110341. As the industry has scaled, economies of scale have further reduced costs, making solar PV more competitive with traditional energy sources, with the cost of utility-scale solar PV CAPEX declined from roughly $4,000-$5,000 /kW in 2000 to around $900-$1,100 /kW by 2020 (U.S. Benchmarks)61Smith, B.L., et al., Photovoltaic (PV) Module Technologies: 2020 Benchmark Costs and Technology Evolution Framework Results. 2020, National Renewable Energy Laboratory (NREL): Golden, CO, United States. dropping from over $350 per kilowatt in 2010 to $50–$60 per kilowatt by 2020.
Economies of scale and market competition: Another important factor contributing to cost reductions in solar PV is economies of scale. As the demand for solar technology has increased, manufacturers have been able to produce solar cells in larger quantities, thus reducing unit costs. According to a report by the International Renewable Energy Agency (IRENA), the global cost of solar PV has fallen by more than 80% since 2010, primarily due to increased production volumes and technological improvements.62La Camera, F., Renewable power generation costs in 2020–irena. 2020, International Renewable Energy Agency: Masdar City, Abu Dhabi. This reduction in cost has made solar PV more accessible, allowing it to compete with conventional energy sources, such as fossil fuels, in terms of both affordability and efficiency. According to the National Renewable Energy Laboratory (NREL), economies of scale and increased competition have significantly lowered the costs of utility-scale solar installations, making them more economically viable for large-scale energy generation.23Fraunhofer Institute for Solar Energy Systems ISE, Photovoltaics Report. 2025: Freiburg, Germany. For example, the cost of utility-scale solar projects has dropped from over $350 per kilowatt in 2010 to around $50–$60 per kilowatt by 2020, largely due to higher production volumes and technological innovations. This ongoing competitive pressure is expected to continue fostering advancements in solar technology, driving down costs even further and enhancing the economic performance of solar PV systems.62La Camera, F., Renewable power generation costs in 2020–irena. 2020, International Renewable Energy Agency: Masdar City, Abu Dhabi.
Levelized Cost of Electricity (LCOE)
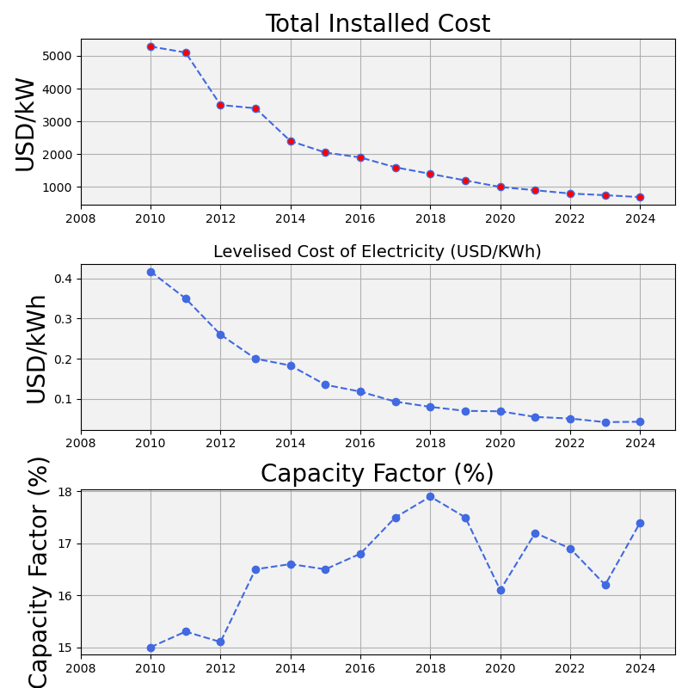
Figure 5: Global weighted-average total installed costs, capacity factors and LCOE for PV, 2010-202463Agency, I.R.E., Renewable Power Generation Costs in 2024. 2025, International Renewable Energy Agency (IRENA): Abu Dhabi. p. 1–152.
The Levelized Cost of Electricity (LCOE) is a critical metric used to evaluate the cost-effectiveness of different energy generation technologies, including solar PV. It represents the per-unit cost of electricity generated by a specific technology over its lifetime, accounting for all costs of installation, operation, and maintenance. According to the International Renewable Energy Agency (IRENA), the LCOE of solar PV has dropped significantly in recent years due to technological advancements and cost reductions in installation and maintenance. In 2020, the global weighted average LCOE for utility-scale solar PV was ~$57/MWh ranged from $20 to $60 per megawatt-hour (MWh), with many projects and auctions achieving lower prices in the $20–$40/MWh range in favorable markets64IRENA, Renewable Energy Statistics 2022. 2022, International Renewable Energy Agency: Abu Dhabi., making it one of the most affordable energy sources.62La Camera, F., Renewable power generation costs in 2020–irena. 2020, International Renewable Energy Agency: Masdar City, Abu Dhabi. This sharp decline in LCOE is primarily attributed to economies of scale, improved efficiencies in solar panel technology, and the increased availability of financing options. As the solar industry continues to evolve, it is expected that the LCOE for solar PV will continue to fall, further enhancing its competitiveness against traditional fossil fuels.65Vimmerstedt, L., Annual technology baseline: The 2022 electricity update. 2022, National Renewable Energy Lab. (NREL): Golden, CO (United States).
Development of the solar PV industry in terms of revenue: The solar photovoltaic (PV) industry has undergone substantial growth, evolving into a multi-billion-dollar global sector driven by both technological advancements and increasing demand for renewable energy. In 2020, the global revenue of the solar industry surpassed $100 billion, with projections indicating that it will continue to grow, reaching approximately $300 billion by 2030.66Moore, J., N. Bullard, and C.C. Officer, BNEF executive Factbook. 2021. The expansion of the solar PV market is largely fueled by increased deployment, technological innovations, and government incentives aimed at reducing carbon emissions and transitioning to cleaner energy sources.
According to BloombergNEF, China consistently produces around 70% of the world’s solar panels, which has made it the dominant player in the global solar manufacturing market.24International Energy Agency (IEA PVPS), Trends in Photovoltaic Applications. 2023, IEA Photovoltaic Power Systems Programme (IEA PVPS): Paris, France. The revenue generated from China’s solar industry alone was estimated at over $50 billion in 2020.67Bahar, H., Renewables 2020—Analysis and Forecast to 2025. 2020, International Energy Agency: Paris, France. Several large Chinese companies, including LONGi Green Energy and JinkoSolar, have become global leaders in solar panel production, contributing significantly to the industry’s financial growth. Similarly, countries like the United States and Germany have also witnessed substantial increases in the production of solar components, contributing to the global market’s expansion.
Technological advancements in solar PV have played a pivotal role in lowering production costs, improving panel efficiency, and enhancing energy storage capabilities. These improvements have helped reduce the levelized cost of electricity (LCOE) for solar PV, making it one of the most affordable forms of energy generation. As of 2020, the LCOE for utility-scale solar PV ranged from $20 to $60 per megawatt-hour (MWh), which is comparable to or even lower than conventional fossil fuels.62La Camera, F., Renewable power generation costs in 2020–irena. 2020, International Renewable Energy Agency: Masdar City, Abu Dhabi. The industry’s revenue is also bolstered by the growth in global installations, as more countries and regions adopt solar as a primary energy source, leading to increased demand for solar panels, inverters, and energy storage systems.
Moreover, the development of large-scale solar farms and the increase in investments from both private and public sectors have been critical drivers of the market’s revenue growth. In 2020 alone, over 120 gigawatts (GW) of solar capacity were installed globally, with countries like China, the United States, and India accounting for the majority of new installations.68Renewables, I., Analysis and Forecast to 2026. 2021, International Energy Agency: Paris, France. This growing demand for solar technology has attracted substantial capital investment, further contributing to the expansion of the solar PV market.
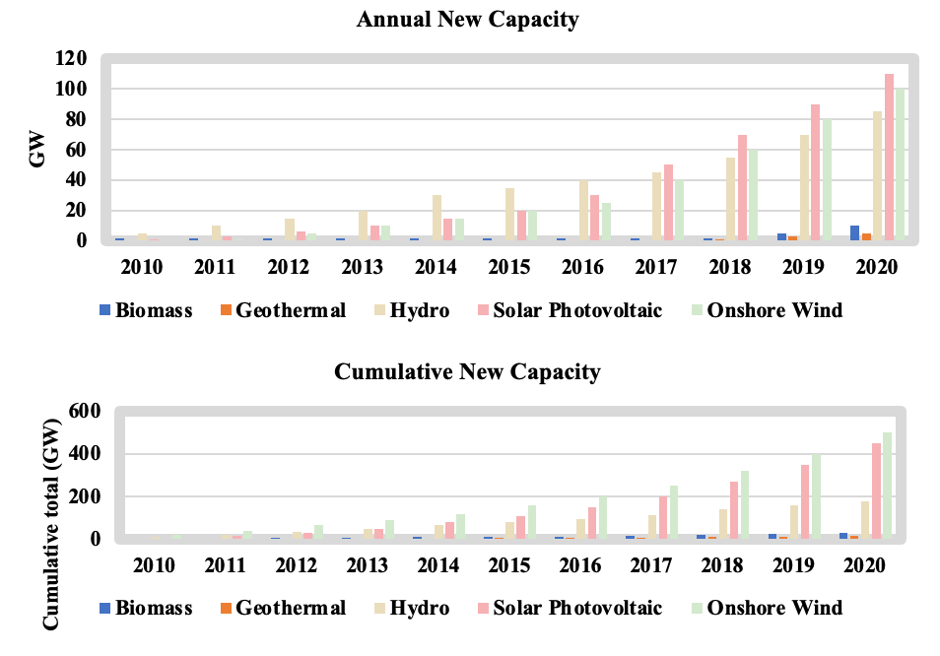
Figure 6: Annual and cumulative total new renewable power generation capacity added at a lower cost than the cheapest fossil fuel-fired option, 2010-202062La Camera, F., Renewable power generation costs in 2020–irena. 2020, International Renewable Energy Agency: Masdar City, Abu Dhabi.
The combination of falling costs, advancements in technology, and increased installation capacity has made solar PV a key contributor to the global energy transition which can be seen in Figure 3. As the market matures, solar PV companies are expected to continue driving innovation, improving efficiency, and expanding their reach, further enhancing their revenue potential and reinforcing the industry’s position as a leader in the renewable energy sector.
3 Ecological performance
Solar photovoltaic (PV) technology is a prominent renewable energy source, recognized for its minimal environmental impact during operation. Unlike fossil fuel-based energy generation, solar PV systems do not produce air pollution or greenhouse gases while generating electricity.69Administration, U.S.E.I. Solar Energy and the Environment. 2024; Available from: https://www.eia.gov/energyexplained/solar/solar-energy-and-the-environment.php.
Ecological impacts: The establishment of large-scale solar PV facilities can lead to habitat loss, soil erosion, and alterations in local hydrology. These environmental changes may adversely affect native flora and fauna, particularly in ecologically sensitive areas. The Union of Concerned Scientists highlights that the environmental impacts of solar power, including land use and habitat loss, can vary significantly depending on the technology and scale of the system.70Scientists, U.o.C. Environmental Impacts of Solar Power. 2013; Available from: https://www.ucsusa.org/resources/environmental-impacts-solar-power. To mitigate this, it required careful planning and management. Implementing strategies such as agrivoltaics, pollinator-friendly designs, and the utilization of degraded lands can mitigate negative impacts and promote biodiversity. Engaging local communities in decision-making processes is crucial to harmonize renewable energy development with ecological preservation and social acceptance.
Comparative analysis with alternative energy technologies: When evaluating the ecological impacts of solar PV relative to other energy technologies, several factors emerge:
Air pollution: Solar PV systems do not emit air pollutants during operation, unlike fossil fuel-based power plants, which release sulfur dioxide (SO₂), nitrogen oxides (NOₓ), and particulate matter, contributing to air quality degradation and health issues.69Administration, U.S.E.I. Solar Energy and the Environment. 2024; Available from: https://www.eia.gov/energyexplained/solar/solar-energy-and-the-environment.php.
Land use efficiency: Median surface power densities are on the order of ~6–7 W/m² for solar PV, ~240 W/m² for nuclear, and ~480 W/m² for natural gas, depending on system boundaries.71Wikipedia. Surface power density. 2024 18 March 2026; Available from: https://en.wikipedia.org/wiki/Surface_power_density. While nuclear and natural gas power plants have higher power densities (240 and 480 W/m², respectively), solar PV installations average about 7 W/m². However, integrating PV systems into existing structures, such as rooftops, can enhance land-use efficiency.72Wikipedia. Solar Power. 2025; Available from: https://en.wikipedia.org/wiki/Solar_power.
Resource availability and sustainability: Solar energy is abundant and renewable, whereas fossil fuels are finite and associated with extraction-related environmental disturbances. Wind and hydroelectric power also offer renewable alternatives with varying ecological footprints.72Wikipedia. Solar Power. 2025; Available from: https://en.wikipedia.org/wiki/Solar_power.
Reduction in greenhouse gas emissions:
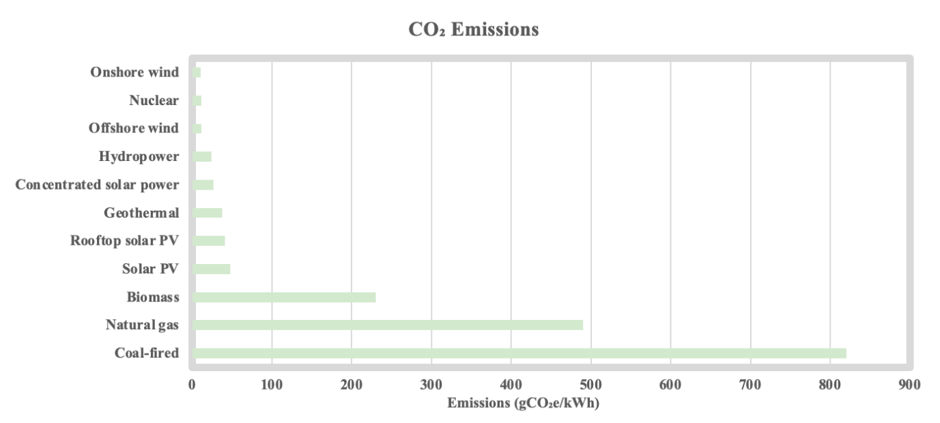
Figure 7: Greenhouse gas emissions for various energy sources73Wikipedia. Life-cycle greenhouse gas emissions of energy sources. 2024; Available from: https://en.wikipedia.org/wiki/Life-cycle_greenhouse_gas_emissions_of_energy_sources.
In the last few decades, the lifecycle greenhouse gas (GHG) emissions associated with solar photovoltaic (PV) systems have significantly decreased due to advancements in technology, manufacturing processes, and efficiency improvements. Early assessments of PV systems, particularly from the late 1990s and early 2000s, reported relatively higher GHG emissions. A study by Jungbluth (2000) estimated lifecycle GHG emissions for various PV systems to be in the range of 39–110 grams of CO₂-equivalent per kilowatt-hour (g CO₂-eq/kWh), with energy payback times (EPBT) of 3–6 years.74Fthenakis, V.M., H.C. Kim, and E. Alsema, Emissions from photovoltaic life cycles. Environmental Science & Technology, 2008. 42: p. 2168–2174. Since then, increased module efficiency, optimized manufacturing processes, and material innovations have contributed to a significant reduction in emissions.
Recent assessments reflect these technological advancements. A 2012 fact sheet from the National Renewable Energy Laboratory (NREL) reported that harmonized lifecycle GHG emissions for c-Si PV systems were significantly lower than earlier estimates.75Stages, L.C., Life cycle greenhouse gas emissions from solar photovoltaics. Journal of Industrial Ecology, 2012. 16: p. S122. A more recent 2023 NREL report further highlighted that modern utility-scale PV systems exhibit lifecycle GHG emissions of approximately 40 g CO₂-eq/kWh, showcasing continued improvements in PV technology and manufacturing efficiency.75Stages, L.C., Life cycle greenhouse gas emissions from solar photovoltaics. Journal of Industrial Ecology, 2012. 16: p. S122. When compared to conventional fossil fuel-based electricity generation, the reduction in GHG emissions from PV systems is even more pronounced. Coal-fired power plants, for example, have lifecycle GHG emissions approximately 20 times higher than those of solar PV systems.75Stages, L.C., Life cycle greenhouse gas emissions from solar photovoltaics. Journal of Industrial Ecology, 2012. 16: p. S122. The significant decline in lifecycle GHG emissions from solar PV systems underscores the positive environmental impact of technological advancements in the solar industry. As PV technologies continue to evolve, further reductions in GHG emissions are anticipated, reinforcing the role of solar energy in mitigating climate change. The scenario of greenhouse gas emission for different energy sources has been illustrated in Figure 4.
Decreased energy payback time: The energy payback time (EPBT) of solar photovoltaic (PV) systems has markedly improved, reflecting significant advancements in technology and manufacturing processes. EPBT measures the duration required for a PV system to generate the amount of energy expended in its production, serving as a critical indicator of the system’s sustainability. Contemporary PV systems now exhibit EPBTs of less than 2 years, highlighting the substantial progress made in enhancing the sustainability and energy efficiency of solar energy technologies.76Payback, C., Energy and Carbon Payback Times for Modern U.S. Utility Photovoltaic Systems. 2024.
Recent studies indicate a further reduction in EPBTs. Recent NREL analysis finds energy payback times for modern U.S. utility-scale PV of ~0.5–1.2 years, depending on location; carbon payback times are typically <2 years in average U.S. grids. A 2023 life cycle assessment by the National Renewable Energy Laboratory (NREL) reported that modern utility-scale PV systems in the United States exhibit EPBTs between 0.5 and 1.2 years, depending on the system’s location and local solar radiation levels.76Payback, C., Energy and Carbon Payback Times for Modern U.S. Utility Photovoltaic Systems. 2024.,77Dwarakanath, A., D. Feldman, and R. Margolis, U.S. Solar Photovoltaic System and Energy Storage Cost Benchmarks, With Minimum Sustainable Price Analysis: Q1 2023. 2024, National Renewable Energy Laboratory (NREL): Golden, CO, United States. A shorter EPBT allows a PV system to contribute clean energy more quickly. For instance, a system with an EPBT of one year starts generating net-positive energy for the remaining 24–29 years of its lifespan, reducing fossil fuel dependency and minimizing ecological damage.
Resource optimization and material usage: Advancements in PV technology have also led to more efficient use of materials. The transition from early, less efficient panels to modern designs has reduced the amount of semiconductor material required per unit of energy produced. For example, the development of perovskite-silicon tandem cells has demonstrated efficiencies exceeding 25%, indicating a promising path toward higher performance with potentially lower material inputs.78AXIOS. The technology paving the way for the future of solar energy. 2024; Available from: https://www.axios.com/sponsored/the-technology-paving-the-way-for-the-future-of-solar-energy. Moreover, ongoing research aims to enhance the recyclability of PV materials, addressing environmental concerns associated with panel disposal. Studies are exploring the recovery of valuable materials like silicon, silver, and rare earth elements from end-of-life panels, promoting a circular economy and reducing the need for new raw materials.
These continuous improvements in material efficiency and resource optimization have significantly advanced PV technology, leading to higher energy conversion rates and more sustainable manufacturing practices. These developments not only enhance the economic feasibility of solar energy but also contribute to environmental conservation through reduced material usage and improved recyclability.
Enhanced recycling and end-of-life management: As the deployment of PV systems has expanded, so has the emphasis on sustainable end-of-life management. Initially, in the 1970s and 1980s, recycling efforts were rudimentary, focusing mainly on recovering aluminum frames and glass from decommissioned panels. As PV technology matured, so did recycling processes, incorporating methods to reclaim valuable materials such as silicon, silver, and rare earth elements.79Delfos. Solar Panel Recycling: The Current State and Future Prospects of Sustainable Energy Solutions. 2025; Available from: https://www.delfos.energy/blog-posts/solar-panel-recycling.
Recent developments have further enhanced recycling efficiency. For instance, Pan Pacific Recycling in Brisbane has pioneered techniques to extract silver and copper from old solar panels without generating toxic emissions or contributing to landfill waste. This initiative addresses the growing concern of solar waste, especially as demand for secondhand panels declines due to the influx of affordable new panels from manufacturers like China.80Guardian, T. Australia’s solar waste problem – identified as a priority by the federal government in 2016 – is becoming larger and more urgent. 2024; Available from: https://www.theguardian.com/environment/2024/oct/23/australia-renewable-energy-solar-waste.
Looking ahead, the International Renewable Energy Agency (IRENA) estimates that by 2050, recycling or repurposing PV panels could unlock up to 78 million tonnes of raw materials globally, valued at over $15 billion. This underscores the immense potential of EoL management in contributing to a circular economy and reducing the environmental footprint of solar energy.22Weckend, S., A. Wade, and G.A. Heath, End of life management: solar photovoltaic panels. 2016, National Renewable Energy Laboratory (NREL): Golden, CO (United States).
Mitigation strategies: To address the ecological challenges of solar PV deployment, several strategies are being implemented. Agrivoltaics involves co-locating solar panels with agricultural activities, enabling both crop production and energy generation.81Energy, U.S.D.o. Agrivoltaics: Solar and Agriculture Co-Location. 2025; Available from: https://www.energy.gov/eere/solar/agrivoltaics-solar-and-agriculture-co-location. Pollinator-friendly solar initiatives integrate native vegetation into solar installations, enhancing biodiversity and supporting local ecosystems.82How to Address Two Environmental Crises at Once. 2025; Available from: https://www.newyorker.com/culture/the-lede/how-to-address-two-environmental-crises-at-once. Additionally, utilizing degraded lands, such as brownfields or abandoned mining areas, for solar development helps minimize impact on pristine environments while benefiting local communities.83Association, S.-S.E.I. Land Use & Solar Development. 2025; Available from: https://seia.org/initiatives/land-use-solar-development/. These strategies aim to make solar energy development more sustainable and environmentally beneficial.
Supply chain sustainability and responsible sourcing
Although PV systems produce electricity with minimal operational emissions, sustainability estimation must include manufacturing and material extraction impacts.84Fthenakis, V.M. and H.C. Kim, Photovoltaics: Life-cycle analyses. Renewable and Sustainable Energy Reviews, 2011. 15(4).,85International Energy Agency, Solar PV Global Supply Chains. 2022, International Energy Agency: Paris, France.
I. Incorporated carbon and manufacturing
Crystalline silicon modules require energy production steps, including polysilicon purification, ingot growth, wafer slicing, and cell processing.84Fthenakis, V.M. and H.C. Kim, Photovoltaics: Life-cycle analyses. Renewable and Sustainable Energy Reviews, 2011. 15(4).,86Pehl, M., et al., Understanding future emissions from low-carbon power systems by integration of life-cycle assessment and integrated energy modelling. Joule, 2017. 1(3): p. 463-473. Most lifecycle emissions occur during manufacturing rather than operation. Incorporated carbon depends strongly on the electricity mix used in production. Modules manufactured in regions with high-carbon electricity have higher lifecycle emissions than those produced in low-carbon regions.87Frischknecht, R., et al., Life cycle assessment of future photovoltaic electricity production from residential-scale systems operated in Europe. Progress in Photovoltaics: Research and Applications, 2020. 28(7): p. 662-681. Energy payback time (EPBT) for modern PV systems typically ranges between 0.5 and 2 years, depending on location and production conditions.84Fthenakis, V.M. and H.C. Kim, Photovoltaics: Life-cycle analyses. Renewable and Sustainable Energy Reviews, 2011. 15(4).,87Frischknecht, R., et al., Life cycle assessment of future photovoltaic electricity production from residential-scale systems operated in Europe. Progress in Photovoltaics: Research and Applications, 2020. 28(7): p. 662-681. Given lifetimes of 25–30 years, PV systems generate multiple times the energy required for their production.
II. Demand for material and resource utilization
PV modules are made of silicon, glass, aluminum, copper, and silver. Silver is utilized in cell contacts because of its high electrical conductivity. While the amount of silver used per watt has decreased, the overall demand may still be significant due to rapid capacity growth. Longer module lifetimes also reduce material demand per unit of electricity generated over time. Future PV growth will increase demand for aluminum frames, glass covers, and copper in electrical components. Efficient material use and recycling strategies will consequently become increasingly important.
III. Recycling of solar modules
Recycling can recover glass, aluminum, and other materials from end-of-life modules. Expanding recycling infrastructure reduces primary resource demand and environmental impacts. Some regions have introduced vast producer responsibility systems to manage module end-of-life. Developing modules for easier recycling can also improve circularity.
IV. Supply chain concentration
The international PV supply chain is geographically concentrated, mainly in polysilicon production.85International Energy Agency, Solar PV Global Supply Chains. 2022, International Energy Agency: Paris, France. This creates risks related to supply protection and environmental and social compliance. Responsible sourcing practices must include supply chain transparency, carbon footprint exposure, and sustainability standards in procurement.
4 Operation & maintenance and asset management
Operation and maintenance of PV plants are critical because they have long-term assets, such as modules, inverters, and infrastructure that should work properly during many years. Small deviations and malfunctioning of the assets can cause large financial impacts, reason why the different assets of the PV system need to be monitored and maintained properly. The guidelines of 88 reflect the state of art in operation & maintenance, as taken from recent research and various standards.
For an adequate power plant operation, the performance of the plant needs to be monitored and analyzed. The variables to be monitored are usually the irradiance, module temperature, electrical parameters of inverters and solar modules, and protection alarms, among others. IV curves also need to be measured and analyzed by measuring the current and voltage of the modules at string level. The shape of the IV-curve allows identifying the origin of failures and causes for loss of power. The measurement of dust or dirt accumulation (soiling) to optimize cleaning schedules is also crucial for PV plants. The most basic method to detect soiling is human inspections, a widely used method is the use of ground modules that remain soiled and can be compared with a reference cell. All these variables are then analyzed to detect easily faults or malfunctioning, so that they can be then diagnosed and corrected or prevented.88IEA PVPS Task 13, Operation and Maintenance (O&M) Guidelines for PV Power Plants. 2022.
Maintenance play also an important role in PV systems. Preventive or proactive maintenance aims to maximize the long-term energy yield and operational lifetime of a PV system by preventing the occurrence of failures at the PV system. The most common preventing actions are: periodic inspections of PV modules or strings, cleaning of modules, removal of vegetation, upkeep of monitoring systems such as SCADA or inspection of inverters and trackers. Thermal imagery is one of the inspection measurements, referring to the collection and processing of IR images of certain elements to see the thermal levels and define if they are in valid ranges or not.88IEA PVPS Task 13, Operation and Maintenance (O&M) Guidelines for PV Power Plants. 2022.
Electroluminescence imagery inspection is also used for preventing maintenance by inspecting defects in PV modules. For this, the PV cells are fed with reverse current to generate near infrared light, captured with a special camera.88IEA PVPS Task 13, Operation and Maintenance (O&M) Guidelines for PV Power Plants. 2022.
Similarly, regular cleaning of the modules from dust or snow is an important maintenance action in PV plants. Soiling, unwanted vegetation or shading can have a huge impact in the energy yield, reason why the cleaning of the modules and elimination of unwanted vegetation is crucial. The geographical zone has also to be analyzed due to the different climates that can affect the modules.88IEA PVPS Task 13, Operation and Maintenance (O&M) Guidelines for PV Power Plants. 2022.
Circular economy strategies for PV
PV modules have a life span of about 25 to 30 years, after their use it is important that they are disposed adequately causing minimum harm to the environment. The growth of PV generation on a global scale will result in a significant amount of waste from the modules that need to be addressed. According to the International Renewable Energy Agency (IRENA), it is estimated that this waste will be around 78 million tons by 2050, which calls for urgent development of end of life (EOF) management that integrate recycling and circular economy (CE) principles.89Pivatto, M., et al., Circular solar economy: PV modules decision-making framework for reuse. Journal of Cleaner Production, 2025. 493. The main goal of circular economy is independence on primary materials and increase in social prosperity.90Papamichael, I. and A.A. Zorpas, End-of-waste criteria in the framework of end-of-life PV panels concerning circular economy strategy. Waste Management & Research, 2022. 40(12). The 4R methodology, standing for Reduce, Reuse, Recycle and Recover, is based on the pillars of the circular economy and can make the PV industry transition to sustainable models, reducing waste and environmental impact.89Pivatto, M., et al., Circular solar economy: PV modules decision-making framework for reuse. Journal of Cleaner Production, 2025. 493.
The previous study proposes a way to test solar modules and make decisions based on the results. The first step is to clean the PV modules and make a visual inspection of each one. Then, in case necessary, maintenance and performance and security tests are done. In the visual inspection, the condition of the glass, junction box, cables and connectors is checked. If they have damages that can be repaired, maintenance is done. If not, it goes for recycling. In case there is no damage or maintenance was performed, electrical tests are carried out, such as insulation and resistance tests, IV curve and electroluminescence tests are performed. If there are only few damages and the module can function properly for more time, they would be available for second life; otherwise, the modules are recycled.89Pivatto, M., et al., Circular solar economy: PV modules decision-making framework for reuse. Journal of Cleaner Production, 2025. 493.
The way of recycling PV modules is also object of discussion. Normally, the methods used are physical and chemical methods. Objective of the physical methods is mechanical recovery (manual dismantling) and crashing; however, these methods produce low purity materials, hard to reuse for other purposes. Other practices are electrostatic separation, eddy current separation and mechanical screening, which can lead to higher quality recycling processes.90Papamichael, I. and A.A. Zorpas, End-of-waste criteria in the framework of end-of-life PV panels concerning circular economy strategy. Waste Management & Research, 2022. 40(12).
5 Social impact
The social acceptance of solar photovoltaic (PV) technology has undergone a significant transformation over the past few decades, evolving from a niche interest to a widely embraced energy solution. This shift is evident through various studies, statistics, and literature that highlight the growing public support and adoption of solar PV systems globally.
Early perceptions and adoption: In the initial stages, solar PV technology faced skepticism and limited adoption due to high costs, technological uncertainties, and a lack of awareness. For instance, a study conducted in Malaysia in 2011 Pakistan in 2023 revealed that the public was hesitant to invest in photovoltaics, primarily because they did not believe that renewable energy has environmental and economic benefits and they were not willing to support this technology. Also, the public was hesitant because they did not fully understand the incentives and significant socioeconomic benefits associated with the technology. So campaigns to increase social acceptance and public awareness towards renewable energies are very important to accelerate the transition to clean energies.91Ud Din, S., Assessing public perception and willingness to pay for renewable energy in Pakistan through the theory of planned behavior. Frontiers in Energy Research, 2023. 11: p. 1088297.
Influence of social factors: Research indicates that social dynamics play a crucial role in the adoption of solar PV technology. A study by the London School of Economics found that households, businesses, and farms are more likely to install solar panels if others in their neighborhood have already done so, especially when existing installations are highly visible.92Baranzini, A., S. Carattini, and M. Péclat, What drives social contagion in the adoption of solar photovoltaic technology. 2017, Grantham Research Institute on Climate Change and the Environment. This phenomenon, known as social contagion, suggests that visible adoption within a community can alleviate concerns about investment risks and encourage others to follow suit.
Statistical growth and public support: The increasing social acceptance of solar PV is reflected in its rapid adoption rates. In Germany, for example, the share of renewable energy in electricity production rose from 3.5% in 1990 to 52.4% in 2023, with solar power contributing significantly to this growth.93Wikipedia. Renewable energy in Germany. 2025; Available from: https://en.wikipedia.org/wiki/Renewable_energy_in_Germany. Public opinion surveys further underscore this acceptance; a 2014 survey showed that 94% of Germans supported the expansion of renewable energies, with more than two-thirds open to having renewable power plants close to their homes. Similarly, in California, solar power has seen substantial growth, with the state achieving a total of 46,874 MW of installed solar capacity by the end of 2023, enough to power 13.9 million homes. This expansion is attributed to high public support, favorable policies, and declining solar costs.94Wikipedia. Solar power in California. 2024; Available from: https://en.wikipedia.org/wiki/Solar_power_in_California.
Recent trends and innovations: Innovative applications of solar PV technology have further enhanced its social acceptance. The concept of “balcony solar” has gained popularity in urban areas, particularly in Germany, where approximately 1.5 million households have installed plug-in solar panels on their balconies. These systems offer a cost-effective and accessible means for apartment dwellers to participate in renewable energy generation, reflecting a societal shift towards embracing decentralized energy solutions.95Guardian, T. Balcony solar panels can save 30% on a typical household’s electricity bill and, with vertical surface area in cities larger than roof space, the appeal is clear. 2025; Available from: https://www.theguardian.com/environment/2024/dec/18/if-a-million-germans-have-them-there-must-be-something-in-it-how-balcony-solar-is-taking-off.
Challenges and barriers: Despite the positive trajectory, challenges persist. Barriers such as financial constraints, regulatory hurdles, and informational deficits can effect this adoption. A meta-analysis highlighted that perceived benefits, environmental concern, and social norms significantly influence individuals’ intentions to adopt residential PV systems.96Schulte, E., et al., A meta-analysis of residential PV adoption: the important role of perceived benefits, intentions and antecedents in solar energy acceptance. Energy Research & Social Science, 2022. 84: p. 102339. Addressing these factors through targeted policies and community engagement is essential to further enhance social acceptance.
Job creation and economic opportunities:
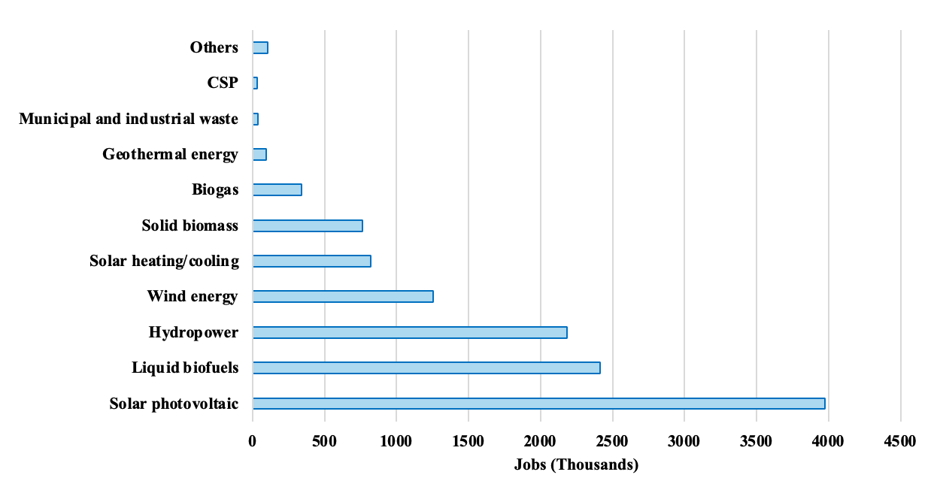
Figure 8: Global renewable energy employment by technology (2021)97Agency, I.R.E. Renewable Energy and Jobs – Annual Review 2021. 2021; Available from: https://www.irena.org/publications/2021/Oct/Renewable-Energy-and-Jobs-Annual-Review-2021.
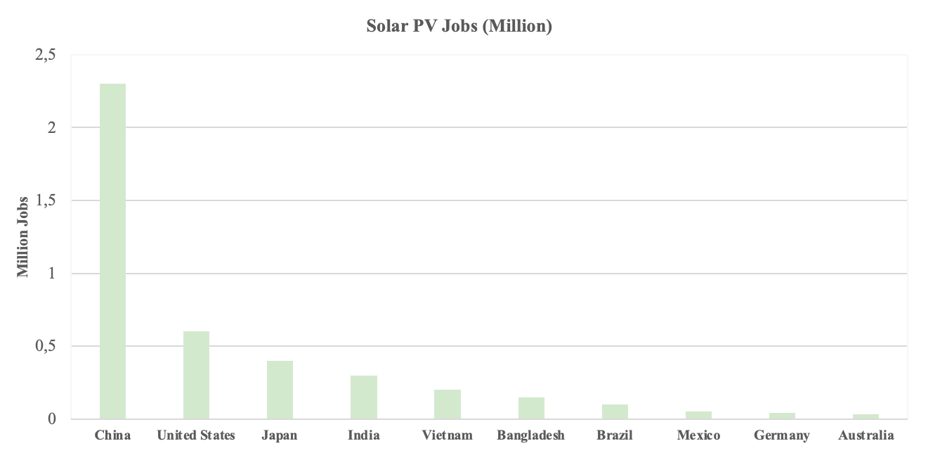
Figure 9: Solar PV employment top 10 counties97Agency, I.R.E. Renewable Energy and Jobs – Annual Review 2021. 2021; Available from: https://www.irena.org/publications/2021/Oct/Renewable-Energy-and-Jobs-Annual-Review-2021.
The adoption of solar photovoltaic (PV) technology has created significant job opportunities across sectors like manufacturing, installation, maintenance, and research & development (R&D) as shown in Figure 5 and Figure 6. According to the International Renewable Energy Agency (IRENA), the solar PV sector alone employed approximately 4 million people globally in 2021, accounting for the highest share among all renewable energy sources.97Agency, I.R.E. Renewable Energy and Jobs – Annual Review 2021. 2021; Available from: https://www.irena.org/publications/2021/Oct/Renewable-Energy-and-Jobs-Annual-Review-2021. These jobs span multiple skill levels, from low-skilled panel installation to high-tech engineering and R&D roles, ensuring employment opportunities for a broad segment of the population.
Furthermore, the solar energy industry provides localized employment, particularly in rural and underdeveloped areas where grid connectivity remains a challenge. The decentralized nature of solar PV systems allows small-scale enterprises and cooperatives to thrive, enabling individuals to generate their own electricity and even participate in microgrid systems, fostering economic independence. For instance, in Sub-Saharan Africa and South Asia, small and medium-sized enterprises (SMEs) involved in solar panel sales, installation, and maintenance have seen a surge in demand, thus contributing to job creation and economic empowerment in marginalized regions.98Group, W.B. Off-Grid Solar Market Trends Report 2020. 2020; Available from: https://www.worldbank.org/en/topic/energy/publication/off-grid-solar-market-trends-report-2020.
Moreover, investment in solar PV technology supports a just transition from fossil fuel-based industries to a cleaner and more sustainable energy system. In countries where traditional fossil fuel industries have dominated, reskilling programs aimed at transitioning workers into the solar sector have played a crucial role in mitigating job displacement. As a result, solar energy contributes not only to environmental sustainability but also to social stability by ensuring a smooth employment transition.97Agency, I.R.E. Renewable Energy and Jobs – Annual Review 2021. 2021; Available from: https://www.irena.org/publications/2021/Oct/Renewable-Energy-and-Jobs-Annual-Review-2021.
Health benefits and avoided mortality: Solar PV technology directly contributes to improved public health by reducing reliance on fossil fuel-based power generation, which is a major source of air pollution and greenhouse gas emissions. The burning of coal, oil, and natural gas releases pollutants such as particulate matter (PM2.5), nitrogen oxides (NOx), and sulfur dioxide (SO2), which are known to cause respiratory diseases, cardiovascular conditions, and premature mortality.99Organization, W.H. Air Pollution. 2025; Available from: https://www.who.int/health-topics/air-pollution. According to a study by the Health Effects Institute (2020), air pollution from fossil fuel combustion was responsible for an estimated 8.7 million premature deaths globally in 2018.100Chan, H.T.H. Fossil fuel air pollution responsible for 1 in 5 deaths worldwide. 2021; Available from: https://hsph.harvard.edu/climate-health-c-change/news/fossil-fuel-air-pollution-responsible-for-1-in-5-deaths-worldwide/. By replacing fossil fuels with solar PV, these adverse health effects can be substantially reduced, leading to lower disease burden and improved life expectancy.
In addition to reducing outdoor air pollution, solar PV technology also minimizes health hazards associated with indoor air pollution. In many developing countries, households without access to electricity rely on kerosene lamps, biomass, or diesel generators for lighting and cooking. These sources emit harmful pollutants that contribute to respiratory illnesses, particularly among women and children who spend more time indoors.101Program, U.E. Seven things you should know about household air pollution. 2021; Available from: https://www.unep.org/news-and-stories/story/seven-things-you-should-know-about-household-air-pollution.
Furthermore, solar PV technology contributes to improved healthcare services by providing reliable electricity to medical facilities, especially in remote regions where grid access is unreliable. Studies indicate that electrified health centers experience improved patient care, better storage of vaccines and medicines (due to refrigeration), and increased medical equipment functionality, ultimately reducing maternal and child mortality rates. In rural clinics of Sub-Saharan Africa, for example, solar-powered refrigeration has played a pivotal role in vaccine distribution, significantly reducing preventable diseases.102Alliance, G.-T.V. In a Nigerian border town, a solar vaccine fridge is changing lives. 2021; Available from: https://www.gavi.org/vaccineswork/nigerian-border-town-solar-vaccine-fridge-changing-lives.
Reduction of social inequality: Access to affordable and sustainable energy is a key factor in reducing social and economic disparities. Solar PV technology has been instrumental in bridging the energy access gap, particularly in underserved and remote regions. According to the International Energy Agency (IEA), over 700 million people worldwide still lack access to electricity, with the majority residing in Sub-Saharan Africa and South Asia.103IEA, P., World Energy Outlook 2022. 2022, International Energy Agency (IEA): Paris, France.
Solar PV-powered microgrids and off-grid systems enable equitable energy distribution, ensuring that even the poorest communities can benefit from reliable electricity. This access to energy improves educational outcomes by providing lighting for evening study, powering digital learning tools, and ensuring schools can function effectively.104Agency, I.E. Access to Electricity. 2021; Available from: https://www.iea.org/reports/sdg7-data-and-projections/access-to-electricity. Additionally, women and children, who often bear the brunt of energy poverty, experience significant social benefits through solar PV deployment. Electrification reduces time spent on labor-intensive household chores, such as collecting firewood or manually grinding grains, thereby allowing more opportunities for education and income-generating activities.
By reducing energy poverty and enabling economic participation, solar PV technology fosters greater social inclusion and mobility. In many regions, electrification through solar energy has contributed to gender empowerment by supporting women-led solar enterprises and increasing female participation in clean energy initiatives. Programs such as the Barefoot College’s solar engineering training for rural women in India and Africa highlight the role of solar technology in promoting gender equality and sustainable development.105college, b. It starts with the sun. 2025; Available from: https://www.barefootcollege.org/solution/solar/.
Negative social impacts: While solar photovoltaic (PV) systems are widely recognized for their environmental benefits, they can also pose certain social challenges in some extend. The construction phase of large-scale solar farms generates noise, which may disrupt nearby communities, though operational PV systems are generally quiet.106Transect. AI solar sentiment: The Social Impacts of Solar Energy. 2023; Available from: https://www.transect.com/blog/ai-solar-sentiment. Health concerns also arise from the presence of hazardous materials like lead or cadmium in some PV panels, which, if damaged or improperly disposed of, could contribute to environmental contamination.70Scientists, U.o.C. Environmental Impacts of Solar Power. 2013; Available from: https://www.ucsusa.org/resources/environmental-impacts-solar-power. Additionally, large-scale solar farms require significant land, potentially leading to habitat disruption, biodiversity loss, and conflicts with existing land uses such as agriculture or residential.28Dubey, S., J.N. Sarvaiya, and B. Seshadri, Temperature dependent photovoltaic (PV) efficiency and its effect on PV production in the world – A review. Energy Procedia, 2013. 33. However, these impacts can often be mitigated through sustainable planning, community engagement, and adherence to environmental regulations.
6 Political and legal aspects
The global advancement of solar photovoltaic (PV) technology have been profoundly influenced by the divers of national policies. These policies, encompassing financial incentives, regulatory frameworks, and strategic initiatives, have been pivotal in shaping the solar energy landscape. The detailed examination of the policies adopted by various countries has been illustrated below.
I. Germany
Germany’s solar photovoltaic (PV) sector has been profoundly influenced by a series of policies aimed at promoting renewable energy adoption and integration. These policies have evolved over time, reflecting the dynamic nature of the energy market and technological advancements. Few key policies are illustrated below:
Renewable Energy Sources Act (Eeg) 2014: The 2014 amendment of the Renewable Energy Sources Act marked a significant shift in Germany’s approach to renewable energy incentives. This version introduced a transition from fixed feed-in tariffs to an auction-based system for determining remuneration rates for renewable energy sources, including solar PV. The objective was to enhance market integration and cost efficiency in renewable energy expansion. Specific deployment corridors were established to control the growth of various technologies, ensuring a balanced and sustainable increase in renewable energy capacity.107German Renewable Energy Sources Act. 2024; Available from: https://en.wikipedia.org/wiki/German_Renewable_Energy_Sources_Act.
Feed-in tariffs adjustments: Germany’s feed-in tariff (FiT) system has undergone multiple adjustments to align with market conditions and technological progress. As of July 2014, the FiTs ranged from 3.33 €c/kWh for hydropower facilities >50 MW to 12.88 €c/kWh for rooftop PV solar installations on buildings up to >30 kWp (July 2014). These tariffs were designed to provide long-term security to renewable energy producers, with rates reflecting the cost of generation for each technology. The regular degression of tariffs aimed to encourage innovation and cost reductions within the industry.108Wikipedia. Feed-in tariffs in Germany. 2024; Available from: https://en.wikipedia.org/wiki/Feed-in_tariffs_in_Germany.
Market integration measures: In November 2024, the German cabinet approved a plan requiring new wind and solar power plants to sell electricity independently on the open market, moving away from guaranteed prices. This policy targets facilities as small as 25 kilowatts, aiming to better integrate renewable energy into Germany’s energy system and manage electricity surpluses that can lead to negative prices. The reform encourages operators to market their power directly and invest in storage solutions, promoting a more resilient and market-responsive renewable energy sector.109Reuters. Germany to mandate open market sales for new wind, solar plants. 2024; Available from: https://www.reuters.com/business/energy/germany-mandate-open-market-sales-new-wind-solar-plants-2024-11-13/.
Zero VAT rate for solar installations (2024): Germany introduced a 0% VAT rate for qualifying small PV supplies and installations effective January 1, 2023; subsequent clarifications followed in 2023-2024.110Piper, D. Recently introduced VAT rate of 0% for solar panel systems – new federal instructions. 2023; Available from: https://www.dlapiper.com/en-de/insights/publications/vat-monthly-alert-series/2023/vat-monthly-alert-march-2023/recently-introduced-vat-rate-of-0-for-solar-panel-systems-new-federal-instructions. To incentivize the adoption of solar energy, the German government proposed a zero Value Added Tax (VAT) rate for the supply and installation of solar modules, effective from January 2023. This policy reduces eliminates VAT charges for operators of private PV systems on both the purchase and installation, reducing the overall cost and encouraging more homeowners and businesses to invest in solar energy solutions.111PIPER, D. The zero tax rate on the supply of photovoltaic systems – further clarifications in the newly published BMF circular. 2023; Available from: https://www.dlapiper.com/en/insights/publications/2023/12/the-zero-tax-rate-on-the-supply-of-photovoltaic-systems.
Moreover, Germany’s solar industry has experienced significant growth, with solar power accounting for an estimated 14% of net public electricity generation in 2024, up from less than 0.1% in 2000. This expansion has been supported by policies such as the Renewable Energy Sources Act (EEG) and various financial incentives. These policies and measures reflect Germany’s commitment to fostering the development and diffusion of solar photovoltaic (PV) technology, while continually adapting to market developments and technological advancements.112ISE, F.I.f.S.E.S. German Net Power Generation in 2024: Electricity Mix Cleaner than Ever. 2025; Available from: https://www.ise.fraunhofer.de/en/press-media/press-releases/2025/public-electricity-generation-2024-renewable-energies-cover-more-than-60-percent-of-german-electricity-consumption-for-the-first-time.html.
II. China
China has ascended as a global leader in solar energy deployment, driven by strategic government policies and economic planning. China’s rapid development and diffusion of solar photovoltaic (PV) technology have been significantly influenced by a series of strategic policies and initiatives implemented over the past few decades; among them the key policies are highlighted below:
Early initiatives and industrial policies: The foundation for China’s solar PV industry was laid during the Sixth Five-Year Plan (1981–1985), which first addressed government support for solar PV panel manufacturing. Subsequent plans continued this emphasis, fostering growth in both manufacturing and technological innovation. In the late 1990s and early 2000s, programs like the Brightness and Township Electrification initiatives aimed to provide electricity to approximately 23 million people in remote areas, significantly contributing to the early development of the PV industry.113Wikipedia. Solarenergie in China. 2025; Available from: https://de.wikipedia.org/wiki/Solarenergie_in_China.
Stimulus measures and feed-in tariffs: The global financial crisis of 2007–2008 prompted China to invigorate its then-struggling solar industry through significant stimulus efforts. In 2009, the government launched the “Golden Sun” program, offering financial subsidies, technological support, and market incentives to promote solar power development.114Yongqing, X. and Y. X., Government subsidies for the Chinese photovoltaic industry. Elsevier, 2016. 99. This initiative aimed to reduce dependence on foreign markets and mitigate trade tensions with the European Union and the United States. In 2011, China introduced nationwide feed-in tariffs (FITs) to guarantee favorable electricity prices for solar power producers, further accelerating domestic installations.115Song, X., et al., An Appraisal on China’s Feed-In Tariff Policies for PV and Wind Power: Implementation Effects and Optimization. Sustainability, 2023. 15: p. 5137.
Recent developments and policy adjustments: China added 357 gigawatts (GW) of combined solar and wind power capacity in 2024, representing a 45% increase in solar capacity and an 18% increase in wind capacity compared to the end of 2023.116Press, A.-T.A. China built out record amount of wind and solar power in 2024. 2025; Available from: https://apnews.com/article/wind-solar-energy-china-climate-carbon-emissions-b337503abfacfd9b7829fd7bbcd507e9.This significant growth enabled China to surpass its 2030 renewable energy targets six years ahead of schedule.116Press, A.-T.A. China built out record amount of wind and solar power in 2024. 2025; Available from: https://apnews.com/article/wind-solar-energy-china-climate-carbon-emissions-b337503abfacfd9b7829fd7bbcd507e9.
In response to this rapid expansion, in February 2025, China’s National Development and Reform Commission (NDRC) announced plans to scale back subsidies for new renewable energy projects. The new policy requires projects approved after June 2025 to participate in market-based bidding for electricity payments, reflecting the maturation of the industry and aiming to ensure its sustainable development.117Reuters. China to roll back clean power subsidies after boom. 2025; Available from: https://www.reuters.com/business/energy/china-roll-back-clean-power-subsidies-after-boom-2025-02-09/.
These policies collectively highlight China’s strategic approach to fostering the growth of its solar PV industry, balancing rapid expansion with sustainable practices and market-oriented reforms.
III. India
India’s advancement and widespread adoption of solar photovoltaic (PV) technology have been significantly influenced by a series of strategic policies and initiatives implemented over the past decade. The cornerstone of these efforts is the National Solar Mission, inaugurated in 2010 with an initial target of 20 gigawatts (GW) of solar capacity by 2022. Recognizing the potential of solar energy, this target was ambitiously revised in 2015 to 100 GW.118Energy, M.o.N.a.R. India surging ahead in the field of Green Energy – 100 GW Solar Scale-Up plan. 2015; Available from: https://pib.gov.in/newsite/PrintRelease.aspx. This mission has been instrumental in accelerating solar power development across the country.
To further bolster solar energy adoption, the Pradhan Mantri Kisan Urja Suraksha evam Utthaan Mahabhiyan (PM-KUSUM) scheme was launched in 2019. This initiative aims to reduce farmers’ dependence on diesel and conventional grid electricity by promoting the use of solar-powered irrigation pumps.119Energy, M.o.N.a.R. A New Revolution. 2025; Available from: https://mnre.gov.in/en/pradhan-mantri-kisan-urja-suraksha-evam-utthaan-mahabhiyaan-pm-kusum/. The scheme not only provides financial incentives for the installation of standalone solar pumps but also supports the development of grid-connected renewable power plants, thereby enhancing energy security in rural areas.
In a bid to encourage domestic manufacturing and reduce reliance on imports, particularly from China, the government mandated in December 2024 that, starting June 2026, all clean energy projects must utilize locally produced solar photovoltaic modules. This policy is expected to stimulate local manufacturing, addressing supply chain vulnerabilities and fostering self-reliance in the solar sector.120R, S.N. India mandates use of locally made solar cells in government projects from June 2026. 2024; Available from: https://www.reuters.com/business/energy/india-mandates-use-locally-made-solar-cells-clean-energy-projects-june-2026-2024-12-10/.
Collectively, these policies have created a conducive environment for the development and diffusion of solar PV technology in India, aligning with the nation’s commitment to sustainable energy and climate change mitigation.
IV. United States
The development and diffusion of Solar Photovoltaic (PV) technology in the United States have been significantly influenced by several key policies. The Energy Policy Act of 2005 was a crucial milestone, providing tax incentives, including the Investment Tax Credit (ITC), which offers a 30% federal tax credit for solar systems installed on residential, commercial, and industrial properties, driving market growth.121Star, E. Tax Credit Legislation. 2022; Available from: https://www.energystar.gov/about/federal-tax-credits/tax-credit-information. The American Recovery and Reinvestment Act (ARRA) of 2009 further accelerated solar energy deployment by allocating significant funds to solar technology development and offering grants for solar installations, stimulating both demand and innovation in the solar industry.122Energy, U.S.D.o. Recovery Act. 2021; Available from: https://www.energy.gov/recovery-ac. State-level policies, particularly in California, have also been vital. The California Solar Initiative (CSI) and Net Metering policies have provided strong incentives for both residential and commercial solar installations, enhancing solar energy adoption.123Comission, C.P.U. California Solar Initiative (CSI). 2025; Available from: https://www.cpuc.ca.gov/industries-and-topics/electrical-energy/demand-side-management/california-solar-initiative.
A trade measure that have impact the growth of U.S. solar manufacturing is the antidumping and countervailing duties (AD/CVD), which are fees on import goods that are imported at very low prices. The main objective is to protect domestic produces form unfair foreign prices. AD/CVD have been placed in history to countries such as China, Taiwan, Southeast Asia, especially on c-Si solar modules and cells.124Energy, U.S.D.o. Overview of Trade and Policy Measures for U.S. Solar Manufacturing. 2024 18 March 2026; Available from: https://www.energy.gov/eere/solar/overview-trade-and-policy-measures-us-solar-manufacturing..
These policies have collectively fostered a robust environment for solar energy growth in the U.S., lowering costs, encouraging innovation.
Positive and negative aspects of alternative policies: The implementation of alternative policies in the solar photovoltaic (PV) industry has led to both positive and negative outcomes, each playing a crucial role in shaping the growth of the sector. One of the key benefits of these policies is the promotion of market efficiency. Auction-based systems, such as those introduced in Germany’s Renewable Energy Sources Act (EEG), encourage competitive bidding for solar energy contracts, ensuring that energy is procured at the lowest cost. This fosters a more cost-efficient and integrated renewable energy market, helping to streamline the transition to clean energy.125Action, F.M.f.E.A.a.C. Renewable Energy. 2025; Available from: https://www.bmwk.de/Redaktion/EN/Dossier/renewable-energy.html. Similarly, financial incentives such as feed-in tariffs (FiTs) in Germany and the U.S. Investment Tax Credit (ITC) are crucial in encouraging technological advancements in solar technology.121Star, E. Tax Credit Legislation. 2022; Available from: https://www.energystar.gov/about/federal-tax-credits/tax-credit-information. These policies offer long-term financial stability to producers, driving innovation and making solar energy more affordable and widespread.
Moreover, subsidies and grants like China’s “Golden Sun” program have been instrumental in rapidly expanding solar PV installations. By offering financial support, China has successfully reduced barriers to entry for local manufacturers, thereby stimulating industry growth.126Wang, Y.-h., G.-l. L., and H. K. 2017. Additionally, policies that mandate the use of locally produced solar modules, such as India’s National Solar Mission, have not only helped create jobs but also fostered economic development within the renewable energy sector. These measures ensure that the country is building a self-sustaining solar industry. Furthermore, consumer empowerment is a significant advantage in regions like California, where policies such as net metering allow consumers to sell excess energy back to the grid. This encourages greater solar adoption and contributes to the overall energy transition.
However, while these policies have fostered considerable growth, they also bring certain challenges. The over-reliance on subsidies, such as Germany’s feed-in tariffs, can lead to market distortion, potentially resulting in inefficiencies. These subsidies may place a financial burden on governments and can contribute to concerns over solar over-supply and negative pricing.127Comission, E. EU energy policy. 2024; Available from: https://energy.ec.europa.eu/index_en. Auction systems, while promoting efficiency, also introduce uncertainty for investors. Low winning bids can lead to unsustainable prices, making it difficult for smaller projects to compete and potentially stalling the growth of the solar sector.
These alternative policies have both positive and negative implications for the solar PV industry, each contributing to different aspects of the energy transition. Proper management of these policies is essential for achieving sustainable and equitable growth.
References
- 1Zhang, C., et al., Semiconductor photovoltaic cells. 2021: Springer.
- 2Cook, G., Photovoltaic fundamentals. 1991: Solar Energy Research Institute.
- 3Energy, U.S.D.o. Solar Photovoltaic Cell Basics. 2025 18 March 2026; Available from: https://www.energy.gov/eere/solar/solar-photovoltaic-cell-basics.
- 4Feeds, S. Concentrated Solar Power (CSP) Vs Photovoltaic (PV): An In-depth Comparison. 2023; Available from: https://www.solarfeeds.com/mag/csp-and-pv-differences-comparison/.
- 5Energy, U.S.D.o. Solar Systems Integration Basics. 2025; Available from: https://www.energy.gov/eere/solar/solar-systems-integration-basics.
- 6Marques Lameirinhas, R.A., J.P.N. Torres, and J.P. de Melo Cunha, A photovoltaic technology review: History, fundamentals and applications. Energies, 2022. 15: p. 1823.
- 7Prize, N. All Nobel Prizes.
- 8Richardson, L. Solar history: Timeline & invention of solar panels. 2023; Available from: https://www.energysage.com/about-clean-energy/solar/the-history-and-invention-of-solar-panel-technology/.
- 9Society, A.-A.P. April 25, 1954: Bell Labs Demonstrates the First Practical Silicon Solar Cell. 2009; Available from: https://www.aps.org/apsnews/2009/04/bell-labs-silicon-solar-cell.
- 10Planet, O. Vanguard 1, the first Solar-Powered Satellite and the Oldest Human-Made Object Still in Orbit was Launched on March 17, 1958. 2023; Available from: https://ourplnt.com/vanguard-1-first-solar-powered-satellite/.
- 11Powerlutions. The History of Solar Energy in the United States. 2023; Available from: https://powerlutions.com/blog/the-history-of-solar-energy-in-the-united-states/.
- 12Delaware, U.o. Over the Years. 2025; Available from: https://iec.udel.edu/about/.
- 13National Renewable Energy Laboratory (NREL). Best research-cell efficiency chart. n.d. 22 February 2026; Available from: https://www.nrel.gov/pv/cell-efficiency.html.
- 14Energy, N.E.-C. Evolution of Solar Cost. 2025; Available from: https://newenglandcleanenergy.com/panels/evolution-of-solar-efficiency/.
- 15Data, O.W. Solar panel prices have fallen by around 20% every time global capacity doubled. 2024; Available from: https://ourworldindata.org/data-insights/solar-panel-prices-have-fallen-by-around-20-every-time-global-capacity-doubled.
- 16Wikipedia. Growth of photovoltaics. 2025; Available from: https://en.wikipedia.org/wiki/Growth_of_photovoltaics.
- 17TheFaunaVerse. The Significance of Large Scale Solar Farms in Energy Sustainability. 2025; Available from: https://thefaunaverse.com/articles/large-scale-solar-farms-sustainable-energy/.
- 18Bolinger, M. and J. Rand, Utility-Scale Solar 2023 Edition. 2023, Lawrence Berkeley National Laboratory: Berkeley, CA, United States.
- 19NREL. Utility-Scale PV. 2021 8/03/2026; Available from: https://atb.nrel.gov/electricity/2021/utility-scale_pv.
- 20Dada, M. and P. Popoola, Recent advances in solar photovoltaic materials and systems for energy storage applications: a review. Beni-Suef University Journal of Basic and Applied Sciences, 2023. 12: p. 1–15.
- 21Asmelash, E. and G. Prakash, Future of Solar Photovoltaic: Deployment, investment, technology, grid integration and socio-economic aspects. 2019, International Renewable Energy Agency: Abu Dhabi. p. 1–73.
- 22Weckend, S., A. Wade, and G.A. Heath, End of life management: solar photovoltaic panels. 2016, National Renewable Energy Laboratory (NREL): Golden, CO (United States).
- 23Fraunhofer Institute for Solar Energy Systems ISE, Photovoltaics Report. 2025: Freiburg, Germany.
- 24International Energy Agency (IEA PVPS), Trends in Photovoltaic Applications. 2023, IEA Photovoltaic Power Systems Programme (IEA PVPS): Paris, France.
- 25Zhang, G., et al., Industrialized high-efficiency mono-PERC cells. Photovoltaics International, 2018.
- 26Guerrero-Lemus, R., et al., Bifacial solar photovoltaics – A technology review. Renewable and Sustainable Energy Reviews, 2016. 60.
- 27PV Education. Anti-reflection coatings. n.d. 22 February 2026; Available from: https://www.pveducation.org/pvcdrom/design-of-silicon-cells/anti-reflection-coatings.
- 28Dubey, S., J.N. Sarvaiya, and B. Seshadri, Temperature dependent photovoltaic (PV) efficiency and its effect on PV production in the world – A review. Energy Procedia, 2013. 33.
- 29ENF Ltd. Crystalline Solar Panel Datasheet (Model ID: 59728). n.d. 1 March 2026; Available from: https://de.enfsolar.com/pv/panel-datasheet/crystalline/59728.
- 30AIKO Solar Co., L., EVO 6N N-Type HJT Bifacial Double Glass 132 Half-Cells 700–715 W Module Datasheet. 2024, AIKO Solar Co., Ltd.
- 31Jinko Solar Co., L., JKM560–580N-72HL4-BDV-F3 Module Datasheet. 2023, Jinko Solar Co., Ltd.
- 32JA Solar Technology Co., L., JAM72D30 540–565/GB Series Specification Sheet. 2022, JA Solar Technology Co., Ltd.
- 33Elsevier. Capacity factor. n.d. 22 February 2026; Available from: https://www.sciencedirect.com/topics/engineering/capacity-factor.
- 34Sánchez-Pérez, P.A. and S. Kurtz, Capacity Factor Analysis of U.S. PV System Reliability and Performance. IEEE Journal of Photovoltaics, 2020. 10(3): p. 786-794.
- 35Solar Power World. What is specific yield? An overview. 2017 22 February 2026; Available from: https://www.solarpowerworldonline.com/2017/08/specific-yield-overview/.
- 36IEA PVPS. Soiling losses – Impact on the performance of photovoltaic power plants. n.d. 22 February 2026; Available from: https://iea-pvps.org/key-topics/soiling-losses-impact-on-the-performance-of-photovoltaic-power-plants/.
- 37Al-Rikabi, A.A., et al., Evaluation of degradation factor effect on solar panels performance after eight years of life operation. Energy Reports, 2024. 11: p. 1123-1132.
- 38Straub-Mück, M., J. Geyer-Klingeberg, and A.W. Rathgeber, Determinants of the long-term degradation rate of photovoltaic modules: A meta-analysis. Renewable and Sustainable Energy Reviews, 2025. 216.
- 39Jordan, D.C. and S.R. Kurtz, Photovoltaic degradation rates—An analytical review. Progress in Photovoltaics: Research and Applications, 2013. 21: p. 12-29.
- 40Coule Energy. Understanding solar panel certification: IEC 61215 & 61730 standards explained. n.d. 22 February 2026; Available from: https://couleenergy.com/understanding-solar-panel-certification-iec-61215-61730-standards-explained/.
- 41International Electrotechnical Commission, IEC 61701: Photovoltaic (PV) modules – Salt mist corrosion testing. 2020: Geneva, Switzerland.
- 42GreenSolver. Potential Induced Degradation (PID): What is it? 2023; Available from: https://greensolver.net/articles/potential-induced-degradation-pid-what-is-it/.
- 43International Electrotechnical Commission (IEC), IEC TS 62804-1:2025, Photovoltaic (PV) modules – Test methods for the detection of potential-induced degradation – Part 1: Crystalline silicon. 2025: Geneva, Switzerland.
- 44National Fire Protection Association, National Electrical Code (NEC), NFPA 70. 2023: Quincy, MA, USA.
- 45National Renewable Energy Laboratory (NREL), U.S. Solar Photovoltaic System and Energy Storage Cost Benchmark. 2023, National Renewable Energy Laboratory: Golden, CO, USA.
- 46REN21, Renewables Global Status Report. 2023, REN21 Secretariat: Paris, France.
- 47Denholm, P. and R.M. Margolis, The potential for energy storage to reduce the curtailment of variable renewable energy. Nature Energy, 2016. 1.
- 48Huld, T., Impact of tracking on PV performance. Solar Energy, 2012.
- 49Muljadi, E., Centralized versus distributed inverters in large PV plants. IEEE Transactions on Industry Applications, 2012.
- 50Perea, A., Comparative analysis of central and string inverters. Renewable Energy, 2018.
- 51Deline, C., et al., Assessment of inverter loading ratio impacts on PV performance. Solar Energy, 2017.
- 52Energy, S. 6 DC and AC Ratio Insights in Solar Power Plants. 2024 18 March 2026; Available from: https://soleosenergy.com/6-dc-and-ac-ratio-insights-solar-power-plants/.
- 53Kroposki, B., et al., Achieving a 100% renewable grid: Operating electric power systems with extremely high levels of variable renewable energy. IEEE Power & Energy Magazine, 2017.
- 54Ulbig, A., T. Borsche, and G. Andersson, Impact of low rotational inertia on power system stability and operation. IFAC Proceedings Volumes, 2014. 47.
- 55Simpson-Porco, J.W., F. Dörfler, and F. Bullo, Voltage stabilization in microgrids via quadratic droop control. IEEE Transactions on Power Systems, 2017.
- 56Peças Lopes, J.A., et al., Integrating distributed generation into electric power systems: A review of drivers, challenges and opportunities. Electric Power Systems Research, 2007.
- 57HelioStorage. Battery. 18 March 2026; Available from: https://heliostorage.com/products/battery/.
- 58Agency, I.E. Demand Response. 2024 18 March 2026; Available from: https://www.iea.org/energy-system/energy-efficiency-and-demand/demand-response.
- 59IEA. Evolution of solar PV module cost by data source, 1970–2020. 2020; Available from: https://www.iea.org/data-and-statistics/charts/evolution-of-solar-pv-module-cost-by-data-source-1970-2020.
- 60Kumar, R.R., et al., Phase change materials and nano-enhanced phase change materials for thermal energy storage in photovoltaic thermal systems: A futuristic approach and its technical challenges. Renewable and Sustainable Energy Reviews, 2020. 133: p. 110341.
- 61Smith, B.L., et al., Photovoltaic (PV) Module Technologies: 2020 Benchmark Costs and Technology Evolution Framework Results. 2020, National Renewable Energy Laboratory (NREL): Golden, CO, United States.
- 62La Camera, F., Renewable power generation costs in 2020–irena. 2020, International Renewable Energy Agency: Masdar City, Abu Dhabi.
- 63Agency, I.R.E., Renewable Power Generation Costs in 2024. 2025, International Renewable Energy Agency (IRENA): Abu Dhabi. p. 1–152.
- 64IRENA, Renewable Energy Statistics 2022. 2022, International Renewable Energy Agency: Abu Dhabi.
- 65Vimmerstedt, L., Annual technology baseline: The 2022 electricity update. 2022, National Renewable Energy Lab. (NREL): Golden, CO (United States).
- 66Moore, J., N. Bullard, and C.C. Officer, BNEF executive Factbook. 2021.
- 67Bahar, H., Renewables 2020—Analysis and Forecast to 2025. 2020, International Energy Agency: Paris, France.
- 68Renewables, I., Analysis and Forecast to 2026. 2021, International Energy Agency: Paris, France.
- 69Administration, U.S.E.I. Solar Energy and the Environment. 2024; Available from: https://www.eia.gov/energyexplained/solar/solar-energy-and-the-environment.php.
- 70Scientists, U.o.C. Environmental Impacts of Solar Power. 2013; Available from: https://www.ucsusa.org/resources/environmental-impacts-solar-power.
- 71Wikipedia. Surface power density. 2024 18 March 2026; Available from: https://en.wikipedia.org/wiki/Surface_power_density.
- 72Wikipedia. Solar Power. 2025; Available from: https://en.wikipedia.org/wiki/Solar_power.
- 73Wikipedia. Life-cycle greenhouse gas emissions of energy sources. 2024; Available from: https://en.wikipedia.org/wiki/Life-cycle_greenhouse_gas_emissions_of_energy_sources.
- 74Fthenakis, V.M., H.C. Kim, and E. Alsema, Emissions from photovoltaic life cycles. Environmental Science & Technology, 2008. 42: p. 2168–2174.
- 75Stages, L.C., Life cycle greenhouse gas emissions from solar photovoltaics. Journal of Industrial Ecology, 2012. 16: p. S122.
- 76Payback, C., Energy and Carbon Payback Times for Modern U.S. Utility Photovoltaic Systems. 2024.
- 77Dwarakanath, A., D. Feldman, and R. Margolis, U.S. Solar Photovoltaic System and Energy Storage Cost Benchmarks, With Minimum Sustainable Price Analysis: Q1 2023. 2024, National Renewable Energy Laboratory (NREL): Golden, CO, United States.
- 78AXIOS. The technology paving the way for the future of solar energy. 2024; Available from: https://www.axios.com/sponsored/the-technology-paving-the-way-for-the-future-of-solar-energy.
- 79Delfos. Solar Panel Recycling: The Current State and Future Prospects of Sustainable Energy Solutions. 2025; Available from: https://www.delfos.energy/blog-posts/solar-panel-recycling.
- 80Guardian, T. Australia’s solar waste problem – identified as a priority by the federal government in 2016 – is becoming larger and more urgent. 2024; Available from: https://www.theguardian.com/environment/2024/oct/23/australia-renewable-energy-solar-waste.
- 81Energy, U.S.D.o. Agrivoltaics: Solar and Agriculture Co-Location. 2025; Available from: https://www.energy.gov/eere/solar/agrivoltaics-solar-and-agriculture-co-location.
- 82How to Address Two Environmental Crises at Once. 2025; Available from: https://www.newyorker.com/culture/the-lede/how-to-address-two-environmental-crises-at-once.
- 83Association, S.-S.E.I. Land Use & Solar Development. 2025; Available from: https://seia.org/initiatives/land-use-solar-development/.
- 84Fthenakis, V.M. and H.C. Kim, Photovoltaics: Life-cycle analyses. Renewable and Sustainable Energy Reviews, 2011. 15(4).
- 85International Energy Agency, Solar PV Global Supply Chains. 2022, International Energy Agency: Paris, France.
- 86Pehl, M., et al., Understanding future emissions from low-carbon power systems by integration of life-cycle assessment and integrated energy modelling. Joule, 2017. 1(3): p. 463-473.
- 87Frischknecht, R., et al., Life cycle assessment of future photovoltaic electricity production from residential-scale systems operated in Europe. Progress in Photovoltaics: Research and Applications, 2020. 28(7): p. 662-681.
- 88IEA PVPS Task 13, Operation and Maintenance (O&M) Guidelines for PV Power Plants. 2022.
- 89Pivatto, M., et al., Circular solar economy: PV modules decision-making framework for reuse. Journal of Cleaner Production, 2025. 493.
- 90Papamichael, I. and A.A. Zorpas, End-of-waste criteria in the framework of end-of-life PV panels concerning circular economy strategy. Waste Management & Research, 2022. 40(12).
- 91Ud Din, S., Assessing public perception and willingness to pay for renewable energy in Pakistan through the theory of planned behavior. Frontiers in Energy Research, 2023. 11: p. 1088297.
- 92Baranzini, A., S. Carattini, and M. Péclat, What drives social contagion in the adoption of solar photovoltaic technology. 2017, Grantham Research Institute on Climate Change and the Environment.
- 93Wikipedia. Renewable energy in Germany. 2025; Available from: https://en.wikipedia.org/wiki/Renewable_energy_in_Germany.
- 94Wikipedia. Solar power in California. 2024; Available from: https://en.wikipedia.org/wiki/Solar_power_in_California.
- 95Guardian, T. Balcony solar panels can save 30% on a typical household’s electricity bill and, with vertical surface area in cities larger than roof space, the appeal is clear. 2025; Available from: https://www.theguardian.com/environment/2024/dec/18/if-a-million-germans-have-them-there-must-be-something-in-it-how-balcony-solar-is-taking-off.
- 96Schulte, E., et al., A meta-analysis of residential PV adoption: the important role of perceived benefits, intentions and antecedents in solar energy acceptance. Energy Research & Social Science, 2022. 84: p. 102339.
- 97Agency, I.R.E. Renewable Energy and Jobs – Annual Review 2021. 2021; Available from: https://www.irena.org/publications/2021/Oct/Renewable-Energy-and-Jobs-Annual-Review-2021.
- 98Group, W.B. Off-Grid Solar Market Trends Report 2020. 2020; Available from: https://www.worldbank.org/en/topic/energy/publication/off-grid-solar-market-trends-report-2020.
- 99Organization, W.H. Air Pollution. 2025; Available from: https://www.who.int/health-topics/air-pollution.
- 100Chan, H.T.H. Fossil fuel air pollution responsible for 1 in 5 deaths worldwide. 2021; Available from: https://hsph.harvard.edu/climate-health-c-change/news/fossil-fuel-air-pollution-responsible-for-1-in-5-deaths-worldwide/.
- 101Program, U.E. Seven things you should know about household air pollution. 2021; Available from: https://www.unep.org/news-and-stories/story/seven-things-you-should-know-about-household-air-pollution.
- 102Alliance, G.-T.V. In a Nigerian border town, a solar vaccine fridge is changing lives. 2021; Available from: https://www.gavi.org/vaccineswork/nigerian-border-town-solar-vaccine-fridge-changing-lives.
- 103IEA, P., World Energy Outlook 2022. 2022, International Energy Agency (IEA): Paris, France.
- 104Agency, I.E. Access to Electricity. 2021; Available from: https://www.iea.org/reports/sdg7-data-and-projections/access-to-electricity.
- 105college, b. It starts with the sun. 2025; Available from: https://www.barefootcollege.org/solution/solar/.
- 106Transect. AI solar sentiment: The Social Impacts of Solar Energy. 2023; Available from: https://www.transect.com/blog/ai-solar-sentiment.
- 107German Renewable Energy Sources Act. 2024; Available from: https://en.wikipedia.org/wiki/German_Renewable_Energy_Sources_Act.
- 108Wikipedia. Feed-in tariffs in Germany. 2024; Available from: https://en.wikipedia.org/wiki/Feed-in_tariffs_in_Germany.
- 109Reuters. Germany to mandate open market sales for new wind, solar plants. 2024; Available from: https://www.reuters.com/business/energy/germany-mandate-open-market-sales-new-wind-solar-plants-2024-11-13/.
- 110Piper, D. Recently introduced VAT rate of 0% for solar panel systems – new federal instructions. 2023; Available from: https://www.dlapiper.com/en-de/insights/publications/vat-monthly-alert-series/2023/vat-monthly-alert-march-2023/recently-introduced-vat-rate-of-0-for-solar-panel-systems-new-federal-instructions.
- 111PIPER, D. The zero tax rate on the supply of photovoltaic systems – further clarifications in the newly published BMF circular. 2023; Available from: https://www.dlapiper.com/en/insights/publications/2023/12/the-zero-tax-rate-on-the-supply-of-photovoltaic-systems.
- 112ISE, F.I.f.S.E.S. German Net Power Generation in 2024: Electricity Mix Cleaner than Ever. 2025; Available from: https://www.ise.fraunhofer.de/en/press-media/press-releases/2025/public-electricity-generation-2024-renewable-energies-cover-more-than-60-percent-of-german-electricity-consumption-for-the-first-time.html.
- 113Wikipedia. Solarenergie in China. 2025; Available from: https://de.wikipedia.org/wiki/Solarenergie_in_China.
- 114Yongqing, X. and Y. X., Government subsidies for the Chinese photovoltaic industry. Elsevier, 2016. 99.
- 115Song, X., et al., An Appraisal on China’s Feed-In Tariff Policies for PV and Wind Power: Implementation Effects and Optimization. Sustainability, 2023. 15: p. 5137.
- 116Press, A.-T.A. China built out record amount of wind and solar power in 2024. 2025; Available from: https://apnews.com/article/wind-solar-energy-china-climate-carbon-emissions-b337503abfacfd9b7829fd7bbcd507e9.
- 117Reuters. China to roll back clean power subsidies after boom. 2025; Available from: https://www.reuters.com/business/energy/china-roll-back-clean-power-subsidies-after-boom-2025-02-09/.
- 118Energy, M.o.N.a.R. India surging ahead in the field of Green Energy – 100 GW Solar Scale-Up plan. 2015; Available from: https://pib.gov.in/newsite/PrintRelease.aspx.
- 119Energy, M.o.N.a.R. A New Revolution. 2025; Available from: https://mnre.gov.in/en/pradhan-mantri-kisan-urja-suraksha-evam-utthaan-mahabhiyaan-pm-kusum/.
- 120R, S.N. India mandates use of locally made solar cells in government projects from June 2026. 2024; Available from: https://www.reuters.com/business/energy/india-mandates-use-locally-made-solar-cells-clean-energy-projects-june-2026-2024-12-10/.
- 121Star, E. Tax Credit Legislation. 2022; Available from: https://www.energystar.gov/about/federal-tax-credits/tax-credit-information.
- 122Energy, U.S.D.o. Recovery Act. 2021; Available from: https://www.energy.gov/recovery-ac.
- 123Comission, C.P.U. California Solar Initiative (CSI). 2025; Available from: https://www.cpuc.ca.gov/industries-and-topics/electrical-energy/demand-side-management/california-solar-initiative.
- 124Energy, U.S.D.o. Overview of Trade and Policy Measures for U.S. Solar Manufacturing. 2024 18 March 2026; Available from: https://www.energy.gov/eere/solar/overview-trade-and-policy-measures-us-solar-manufacturing.
- 125Action, F.M.f.E.A.a.C. Renewable Energy. 2025; Available from: https://www.bmwk.de/Redaktion/EN/Dossier/renewable-energy.html.
- 126Wang, Y.-h., G.-l. L., and H. K. 2017.
- 127Comission, E. EU energy policy. 2024; Available from: https://energy.ec.europa.eu/index_en.