Authors: Ann-Katrin Bohlen, Lilian Schepermann, Karolin Wallmeier
Edited by: –
Last updated: December 17, 2025
1 Definition and relevance
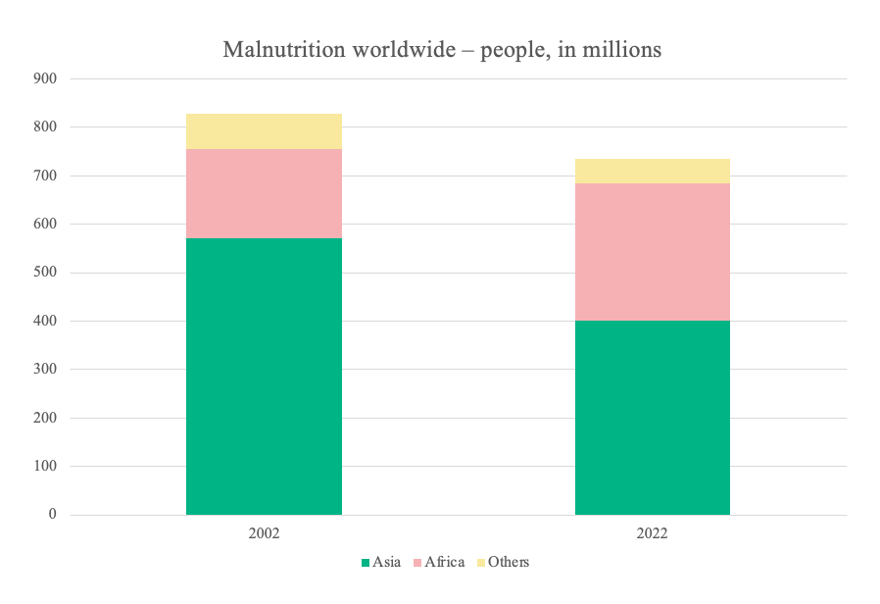
Hunger and food waste are two closely linked global challenges that are now more than ever the focus of international efforts. According to the Food and Agriculture Organization (FAO), around 735 million people worldwide were undernourished in 2022. Regions in Asia and Africa are particularly affected (Fig. 1)1Statistisches Bundesamt. 735 Millionen Menschen weltweit haben nicht genug zu essen, https://www.destatis.de/DE/Themen/Laender-Regionen/Internationales/Thema/landwirtschaft-fischerei/Unterernaehrung.html#:~:text=735%20Millionen%20Menschen%20weltweit%20galten,unter%20dem%20Wert%20des%20Vorjahres. (2023).,2Food and Agriculture Organization of the United Nations. Hunger and food insecurity, https://www.fao.org/hunger/en/ (2023).
Famine is a more extreme form of hunger. This occurs when a large population in a region or country is affected by acute food shortages. Famine situations are typically caused by a combination of natural disasters, prolonged droughts, conflicts and economic crises that disrupt food production and distribution. The Integrated Food Security Phase Classification (IPC) system classifies famines as phases in which the acute malnutrition rate exceeds 30%, more than two people die per 10,000 people per day and people do not have sufficient access to food and other basic needs.3Sanchez, P. A. & Swaminathan, M. S. Cutting World Hunger in Half. Science 307, 357-359 (2005). https://doi.org:doi:10.1126/science.1109057
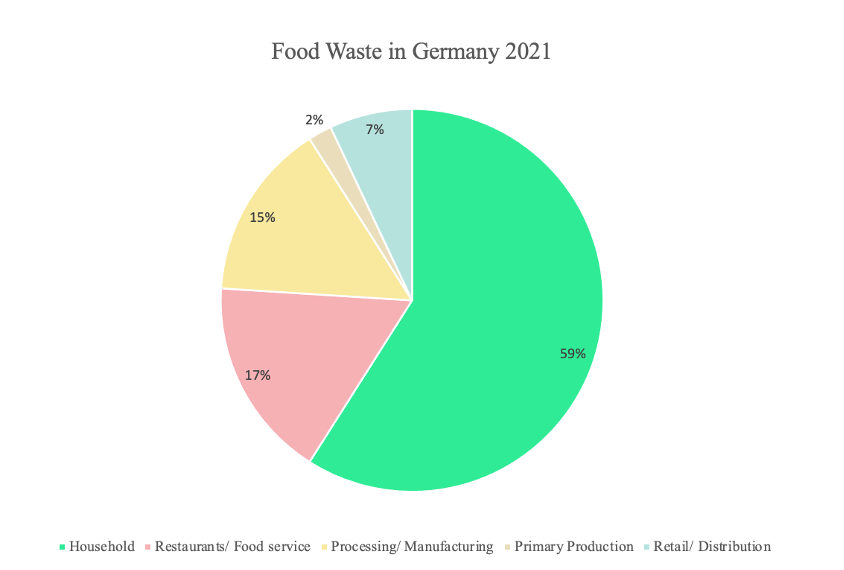
There is no standard definition of food waste as an integral part of the global food problem. However, it is generally recognized that food waste occurs along the entire food supply chain (FSC). In an EU project, food waste is defined as follows: „Food waste is any food, and inedible parts of food, removed from the FSC to be recovered or disposed“ (Östergren et al., 2014)4Östergren, K. et al. FUSIONS definitional framework for food waste. Full report. (2014).. Others take approaches in their definition that focus on the scope or the time component, also distinguishing between edible and inedible parts of the food or between avoidable and unavoidable waste.5Lebersorger, S. & Schneider, F. Discussion on the methodology for determining food waste in household waste composition studies. Waste Management 31, 1924-1933 (2011).https://doi.org:https://doi.org/10.1016/j.wasman.2011.05.023 Another definition includes nutritional value as a quantifiable component. This implies that overeating can also be seen as a form of food waste.6Smil, V. Improving Efficiency and Reducing Waste in Our Food System. Environmental Sciences 1, 17-26 (2004). https://doi.org:10.1076/evms.1.1.17.23766 The majority of food waste in Germany in 2021 (Fig. 2) took place in private households, which accounted for 59% of total waste. In comparison, restaurants were responsible for less than half of this amount with a share of 17%).7Statistisches Bundesamt. Food Waste, https://www.destatis.de/EN/Themes/Society-Environment/Environment/_Graphic/_Interactive/food-waste.html (2024).
In 2015, the 193 member states of the United Nations adopted the 2030 Agenda, one of the goals of which is to eradicate global hunger and promote sustainable development. Two of the 17 goals on this agenda, “Zero Hunger” (Goal 2) and “Ensure sustainable consumption and production patterns” (Goal 12), are particularly relevant to combating hunger and reducing food waste.8Bundesministerium für wirtschaftliche Zusammenarbeit und Entwicklung.Agenda 2030: Die globalen Ziele für nachhaltige Entwicklung https://www.bmz.de/de/agenda-2030 (2023).
Goal 2 aims to end hunger worldwide, ensure food security and improve nutrition. This is to be achieved through measures such as doubling agricultural productivity, promoting sustainable agriculture and ensuring fair access to land, knowledge and markets.9The Global Goals. The 17 Goals, https://www.globalgoals.org/goals/ (n.d.).
Goal 12 strives for the sustainable management and efficient use of natural resources. It aims to halve food waste at retail and consumer level by 2030 and reduce losses along the entire production and supply chain. Companies, especially large corporations, are encouraged to establish sustainable practices and create transparency about their products.9The Global Goals. The 17 Goals, https://www.globalgoals.org/goals/ (n.d.).
The forecast that more than 600 million people could be affected by hunger in 2030 also underlines the urgency of these issues. Businesses and governments alike are challenged to integrate sustainable practices and develop innovative solutions to combat global hunger and reduce food waste. These tasks are not only ethical and social obligations, but also economic necessities for a sustainable and just future.10Food and Agriculture Organization of the United Nations, International Fund for Agricultural Development, unicef, World Food Programme & World Health Organization. The State of Food Security and Nutrition in the World. (2023).
It becomes clear that the two issues are closely linked. Hunger cannot be combated by increasing production alone, but waste must also be reduced.11Grewal, D., Guha, A., Noble, S. M. & Bentley, K. The food production–consumption chain: Fighting food insecurity, loss, and waste with technology. Journal of the Academy of Marketing Science (2024). https://doi.org:10.1007/s11747-024-01040-x
In the following, we will refer to both Food Waste and Food Loss together, meaning any waste that can occur along the entire supply chain. To support this terminology, we will use the term FWL.
2 Measurement and KPI´s of food waste and hunger
The options for measuring FWL and hunger are discussed below. The key performance indicators (KPIs) are also presented. This is followed by an insight into a company that serves as a best practice example.
2.1 Food waste and food loss
Various methods for measuring FWL are described below. The type of measurement depends on where the food waste occurs. There is a consensus that FWL not only has an environmental impact, but also social and economic consequences. It is therefore essential to carry out all measurements along the entire FSC to be able to understand the effects in their entirety.12Rodrigues, V. S., Demir, E., Wang, X. & Sarkis, J. Measurement, mitigation and prevention of food waste in supply chains: An online shopping perspective. Industrial Marketing Management 93, 545-562 (2021). https://doi.org:https://doi.org/10.1016/j.indmarman.2020.09.020 In order to meet SDG target 12.3, it is necessary to differentiate between the measurements of food loss and food waste. The indicator for food loss covers the FSC from harvest to retail, while the index for food waste is intended to measure waste at retail and consumer level in particular.13Food and Agriculture Organization of the United Nations. SDG Indicators Data Portal. Indicator 12.3.1 – Global Food Loss and Waste, https://www.fao.org/sustainable-development-goals-data-portal/data/indicators/1231-global-food-losses/en (n.d.).
The Global Food Loss Index (GFLI) is used to measure food losses in various sectors and compares them with the values from previous years. The particular focus here is on the individual supply stages of food chains, from harvest to retail. Additionally, the GFLI is made up of the Food Loss Index (FLI) of the individual countries. The provision of comparable data should provide a basis for political decisions and highlight the main problems along the food chain. Data collection and the measurement of waste are carried out on the one hand through the annual survey in the form of questionnaires and on the other hand through the provision of data from offices and ministries. If the exact losses cannot be collected, an estimate is made, which is subsequently validated by a working group. In particular, the Index measures the proportion of food losses, i.e. the percentage of food that does not make it from the production stage to the retail stage. Additionally, the analysis covers various stages, including the following: Pre-harvest loss, harvest loss, post-harvest loss, transportation loss, storage loss and packaging, handling and distribution. In addition, the foodstuffs are divided into the following groups: Grains, Fruit & Vegetables, Milk & Meat and Fish.14Food and Agriculture Organization of the United Nations. The State of Food and Agriculture. Moving forward on food loss and waste reduction. (2019).
The Food Waste Index was developed by the United Nations Environment Program (UNEP). The index covers food retail, food service and households and is compiled in three stages (Fig. 3). The first stage involves estimating the missing data using data from previous surveys or data from other countries to determine the extent of the problem and take short-term measures. Additionally, the second stage involves direct measurement by the individual countries. Specific measurement methods include waste composition analysis (WCA), volumetric assessments or even counts and scans. Depending on the sector under investigation, different methods of data collection should be used. Finally, in the third stage, a prevention strategy is developed on the basis of the previously collected data and additional information. In this regard, the breakdown of the data by destination and the consideration of home composting should be mentioned in particular. The support of the individual countries is an essential prerequisite for the successful implementation of the second and third stages. As the stage progresses, an increase in resource requirements must be taken into account to generate increasingly specific measures.15United Nations Environment Programme. Food Waste Index Report 2024. Think Eat Save: Tracking Progress to Halve Global Food Waste. (2024).

When measuring in absolute quantities, the problem arises that no uniform measurement of the quantity can be guaranteed. As there is no uniform definition of the term food waste, the extent of the explanations varies depending on the underlying definition. A comparison of the results of the UNEP survey with those of the FAO shows that the FAO calculated less food waste at household level than the UNEP. The difference is double.17Hoehn, D. et al. A critical review on food loss and waste quantification approaches: Is there a need to develop alternatives beyond the currently widespread pathways? Resources, Conservation and Recycling 188, 106671 (2023). https://doi.org:https://doi.org/10.1016/j.resconrec.2022.106671
In 2014, the FAO carried out a full cost accounting (FCA) to assess food losses from a cost perspective. The survey took into account not only the financial costs, but also the social and environmental costs. Every year, around a third of the food produced is thrown away. This corresponds to a producer price of 750 billion US dollars and a retail price of one trillion US dollars. In addition, indirect economic losses arise through the subsidization of the food grown, which is also wasted through its disposal. The further impact on the environment results in additional annual ecological costs of 700 billion US dollars. This sum includes, for example, the emission of greenhouse gases, the unnecessary consumption of water and the resulting water scarcity and loss of biodiversity. The social costs of 900 billion US dollars must also be taken into account in the overall calculation. Additionally, the use of pesticides carries the risk of adverse health effects and can also have a negative impact on people’s general well-being and quality of life. Furthermore, an increased risk of conflict is to be expected due to the scarcity of resources and the associated loss of livelihoods. However, not all relevant factors were taken into account in the calculation and not all could be precisely determined. This is due to the fact that not all impacts can be quantified.18Food and Agriculture Organization of the United Nations. The State of Food and Agriculture. Innovation in family farming. (2014).
In the past, the diary and self-report method was often used in smaller studies. The use of visual tools or scales can increase the informative value of the self-report. This method is used in particular to study waste at household level.19van Herpen, E., van der Lans, I. A., Holthuysen, N., Nijenhuis-de Vries, M. & Quested, T. E. Comparing wasted apples and oranges: An assessment of methods to measure household food waste. Waste Management 88, 71-84 (2019). https://doi.org:https://doi.org/10.1016/j.wasman.2019.03.013
A common method of measuring food waste is to weigh the amount that is not consumed. In numerous studies, the weighed amount of waste is used as the basis for the investigation of food waste (see20Williams, H., Wikström, F., Otterbring, T., Löfgren, M. & Gustafsson, A. Reasons for household food waste with special attention to packaging. Journal of Cleaner Production 24, 141-148 (2012). https://doi.org:https://doi.org/10.1016/j.jclepro.2011.11.044,21Elimelech, E., Ayalon, O. & Ert, E. What gets measured gets managed: A new method of measuring household food waste. Waste Management 76, 68-81 (2018). https://doi.org:https://doi.org/10.1016/j.wasman.2018.03.031,22Langley, J. et al. Food for Thought? — A UK pilot study testing a methodology for compositional domestic food waste analysis. Waste Management & Research 28, 220-227 (2010). https://doi.org:10.1177/0734242×08095348). Another way to identify and quantify food waste is to sort the waste into different categories. This allows a more detailed analysis of specific food waste to be carried out (see23Parizeau, K., von Massow, M. & Martin, R. Household-level dynamics of food waste production and related beliefs, attitudes, and behaviours in Guelph, Ontario. Waste Management 35, 207-217 (2015). https://doi.org:https://doi.org/10.1016/j.wasman.2014.09.019,24Ventour, L. & WRAP. The Food We Waste. (WRAP, 2008).). Additionally, this procedure is referred to as WCA. Although the exact determination of the food enables a more in-depth analysis, it is also associated with higher costs. It should also be noted that when measuring waste via a waste collection system, waste that is disposed of via composting or drainage is not taken into account.25Quested, T. E., Palmer, G., Moreno, L. C., McDermott, C. & Schumacher, K. Comparing diaries and waste compositional analysis for measuring food waste in the home. Journal of Cleaner Production 262, 121263 (2020). https://doi.org:https://doi.org/10.1016/j.jclepro.2020.121263 The methodology of food diaries and self-reports can also be transferred to other sectors. For example, the method is also suitable for measuring waste in food service outlets such as schools, restaurants, petrol stations and canteens. The main causes of waste in this context are overproduction and the phenomenon of so-called serving waste. This is food that is prepared but not passed on to the consumer.26Silvennoinen, K., Heikkilä, L., Katajajuuri, J.-M. & Reinikainen, A. Food waste volume and origin: Case studies in the Finnish food service sector. Waste Management 46, 140-145 (2015). https://doi.org:https://doi.org/10.1016/j.wasman.2015.09.010
2.2 Hunger
Hunger is a global problem that varies in severity depending on the region and population group. to be able to measure hunger globally, comprehensive and comparable indicators are required. One of the most important global measuring instruments is the Global Hunger Index (GHI).27Global Hunger Index. Global Hunger Index Methodology, https://www.globalhungerindex.org/methodology.html(n.d.).
The GHI is a multidimensional statistical tool published annually by the International Food Policy Research Institute (IFPRI) in collaboration with Welthungerhilfe and Concern Worldwide. Additionally, the GHI measures and tracks hunger at global, regional and national levels and combines four indicators (Tab. 1).
| Prevalence of Undernourishment | This indicator measures the proportion of the population that does not consume enough calories to lead a normal, active life.27Global Hunger Index. Global Hunger Index Methodology, https://www.globalhungerindex.org/methodology.html(n.d.). |
| Child Wasting | This indicator measures the proportion of children under the age of five who are underweight in relation to their height, which indicates acute malnutrition.27Global Hunger Index. Global Hunger Index Methodology, https://www.globalhungerindex.org/methodology.html(n.d.). |
| Child Stunting | This indicator measures the proportion of children under the age of five who are too small for their age, which indicates chronic malnutrition.27Global Hunger Index. Global Hunger Index Methodology, https://www.globalhungerindex.org/methodology.html(n.d.). |
| Child Mortality | This indicator includes the mortality rate of children under the age of five and reflects the deadly consequences of malnutrition and inadequate health care.27Global Hunger Index. Global Hunger Index Methodology, https://www.globalhungerindex.org/methodology.html(n.d.). |
The GHI is calculated as a weighted average of these four indicators, with each indicator being weighted equally. The results are presented on a scale from 0 to 100, with a low value meaning less hunger and a high value meaning more hunger.28von Grebmer, K. et al. 2023 – Global Hunger Index – The Power of Youth in Shaping Food Systems. (Welthungerhilfe, 2023). The GHI thus comprehensively records the hunger situation at global, regional and national level by combining four key indicators. This detailed analysis makes it possible to compare hunger between different countries and regions and to focus attention on particularly affected areas to derive appropriate measures. However, there are also limitations, as reliable data is not available in some countries and estimates are often only partially possible. This makes it difficult to analyze and derive specific action requirements and can hinder further development on the ground.27Global Hunger Index. Global Hunger Index Methodology, https://www.globalhungerindex.org/methodology.html(n.d.).
Another important instrument for measuring hunger is the Food Insecurity Experience Scale (FIES). This scale is an FAO instrument for measuring the individual experience of food insecurity. By using statistical methods such as item response theory, the comparability of data between countries can be ensured.29Food and Agriculture Organization of the United Nations. Voices of the Hungry. The Food Insecurity Experience Scale, https://www.fao.org/in-action/voices-of-the-hungry/fies/en/ (n.d.). Nevertheless, it must be taken into account that different cultures may have a different understanding of deprivation and that self-reporting can lead to distortions.30Bernal, J., Fram, M. & Frongillo, E. The measurement of food insecurity among children: Review of literature and concept note. (2015). The FIES is based on surveys that measure how often people have had difficulties eating enough in the last 12 months. The scale comprises eight questions covering different aspects of food insecurity, such as worries about food supply, reduced meals and starvation meals.31Food and Agriculture Organization of the United Nations. Food Insecurity Experience Scale (FIES),http://www.fao.org/in-action/voices-of-the-hungry/fies/en/ (2018).
The IPC is an internationally recognized tool for classifying the severity of food insecurity and famine. The IPC uses a five-point scale ranging from minimal food insecurity (stage 1) to famine (stage 5). Additionally, the assessment is based on a variety of data sources, including nutrition, health and food supply indicators. The IPC is often used by humanitarian organizations to assess needs in crisis situations and to plan appropriate measures.32Integrated Food Security Phase Classification. IPC – Integrated Food Security Phase Classification, https://www.ipcinfo.org (n.d.).
The Prevalence of Undernourishment (PoU) indicator is a key FAO indicator that measures the proportion of the population that does not consume enough calories to lead a healthy and active life. The PoU is based on national data on food production, trade balances and household surveys. Additionally, the indicator is published annually and serves as a central basis for the global assessment of hunger.33Food and Agriculture Organization of the United Nations. SDG Indicators Data Portal. Indicator 2.1.1 – Prevalence of undernourishment, https://www.fao.org/sustainable-development-goals-data-portal/data/indicators/2.1.1-prevalence-of-undernourishment/en (n.d.).
Although the Human Development Index (HDI) is not a direct indicator of hunger, it still provides valuable insights into the living conditions and well-being of the population. The HDI combines data on life expectancy, educational attainment and per capita income to provide a comprehensive picture of human development. Countries with a low HDI often have higher rates of food insecurity and hunger.34Human Development Index. Human Development Index (HDI), https://hdr.undp.org/data-center/human-development-index#/indicies/HDI (n.d.).
Measuring hunger at a global level requires the use of different indicators and approaches to capture the complexity of the problem. The GHI provides a comprehensive assessment by combining several dimensions of hunger. Instruments such as the FIES and the IPC provide detailed insights into individual and regional food insecurity. The PoU indicator and the HDI offer additional perspectives on the problem. Together, these tools provide valuable data to combat hunger and improve global food security.
2.3 Key performance indicators
KPIs provide a comprehensive basis for companies to measure their progress in reducing FWL and to take targeted action to improve sustainability both within their own organization and throughout the supply chain. Systematic monitoring and reporting are essential to evaluate the effectiveness of food waste prevention measures.
For a robust evaluation, it is essential to define a clear baseline and specific objectives. These objectives should be SMART (specific, measurable, achievable, relevant and time-bound) to ensure clear direction and measurable results. Continuous monitoring of actions against appropriate KPIs enables companies to regularly review and adjust their strategies.35Pathinha Caldera C., De Laurentiis V., Sala S. Assessment of food waste prevention actions. (Publications Office of the European Union, 2019).
Unfortunately, in practice, there is often a lack of SMART objectives, clearly defined baselines and relevant KPIs. Without these basic elements, it is difficult to accurately measure the success of FWL reduction efforts and make appropriate improvements.35Pathinha Caldera C., De Laurentiis V., Sala S. Assessment of food waste prevention actions. (Publications Office of the European Union, 2019).
| Economic KPIs | Economic losses | Measuring the total cost of food waste and its disposal in currency.36Lehn, F., Goossens, Y. & Schmidt, T. Economic and environmental assessment of food waste reduction measures – Trialing a time-temperature indicator on salmon in HelloFresh meal boxes. Journal of Cleaner Production 392, 136183 (2023). https://doi.org:https://doi.org/10.1016/j.jclepro.2023.136183 |
| Missed sales | Measuring the loss of sales due to unsold but wasted food in currency.12Rodrigues, V. S., Demir, E., Wang, X. & Sarkis, J. Measurement, mitigation and prevention of food waste in supply chains: An online shopping perspective. Industrial Marketing Management 93, 545-562 (2021). https://doi.org:https://doi.org/10.1016/j.indmarman.2020.09.020 | |
| Opportunity Costs | Measuring lost potential revenue that could have been realized through alternative use of the wasted food in currency.12Rodrigues, V. S., Demir, E., Wang, X. & Sarkis, J. Measurement, mitigation and prevention of food waste in supply chains: An online shopping perspective. Industrial Marketing Management 93, 545-562 (2021). https://doi.org:https://doi.org/10.1016/j.indmarman.2020.09.020 | |
| Cost Savings | Measuring savings through measures to reduce food waste in currency.12Rodrigues, V. S., Demir, E., Wang, X. & Sarkis, J. Measurement, mitigation and prevention of food waste in supply chains: An online shopping perspective. Industrial Marketing Management 93, 545-562 (2021). https://doi.org:https://doi.org/10.1016/j.indmarman.2020.09.020 | |
| Social KPIs | Proportion of donated food | Amount of food donated to charities and food banks.37Gorgan, C., Chersan, I.-C., Dragomir, V. & Dumitru, M. Food Waste Prevention Solutions in the Annual Reports of European Companies. Amfiteatru Economic Journal 24 (2022). https://doi.org:10.24818/EA/2022/60/309 |
| Discounts to employees and other consumers | Amount of food sold to employees and other consumers at reduced prices before it was thrown away (i.e. via platforms such as Too good to go).12Rodrigues, V. S., Demir, E., Wang, X. & Sarkis, J. Measurement, mitigation and prevention of food waste in supply chains: An online shopping perspective. Industrial Marketing Management 93, 545-562 (2021). https://doi.org:https://doi.org/10.1016/j.indmarman.2020.09.020,38Too Good To Go. Marketplace Surprise Bags, https://www.toogoodtogo.com/surplus-food-marketplace (n.d.). | |
| Production-Related KPIs | Food loss rate | Proportion of food lost during production or within the FSC in percent.12Rodrigues, V. S., Demir, E., Wang, X. & Sarkis, J. Measurement, mitigation and prevention of food waste in supply chains: An online shopping perspective. Industrial Marketing Management 93, 545-562 (2021). https://doi.org:https://doi.org/10.1016/j.indmarman.2020.09.020 |
| Food loss per harvest | Proportion of the harvest that cannot be utilized in per cent.39Economou, F. et al. The concept of food waste and food loss prevention and measuring tools. Waste Management & Research 42, 651-669 (2024). https://doi.org:10.1177/0734242×241237187 | |
| Quality control parameters | Measures of the quality of produced food and the reduction of losses due to quality defects.39Economou, F. et al. The concept of food waste and food loss prevention and measuring tools. Waste Management & Research 42, 651-669 (2024). https://doi.org:10.1177/0734242×241237187 | |
| Sustainability KPIs | Compliance with environmental standards | Compliance with environmental standards to reduce food waste, measuring how often sustainability reports are published each year.12Rodrigues, V. S., Demir, E., Wang, X. & Sarkis, J. Measurement, mitigation and prevention of food waste in supply chains: An online shopping perspective. Industrial Marketing Management 93, 545-562 (2021). https://doi.org:https://doi.org/10.1016/j.indmarman.2020.09.020 |
| Extension of shelf life | Additional days that food remains usable through better packaging and labeling.39Economou, F. et al. The concept of food waste and food loss prevention and measuring tools. Waste Management & Research 42, 651-669 (2024). https://doi.org:10.1177/0734242×241237187 |
2.4 Best practice example
The Kroger Co. is one of the largest grocery retailers in the United States, operating a variety of supermarkets and multi-department stores. The company is known for its commitment to sustainability and social responsibility, particularly through its Zero Hunger | Zero Waste initiative. This initiative exemplifies Kroger’s successful implementation of KPIs related to hunger and food waste. In its 2023 Environmental, Social & Governance (ESG) Report, Kroger outlines several actions and achievements that position it as an industry leader. One notable achievement is Kroger’s success in donating a total of three billion meals to communities in need by 2025. This goal was achieved well ahead of schedule in the first quarter of 2023. Another KPI is the amount of food rescued. In fiscal 2022, Kroger rescued 106 million pounds of excess food for donation, an increase from previous years. Additionally, in addition, Kroger set a goal of 100% participation in food rescue programmes across all retail stores, which was fully achieved in 2022. In addition, Kroger has committed to reducing food waste from its stores by 50% by 2025. By 2022, a reduction of 26.2% had been achieved, indicating that this ambitious goal is on track. Kroger also aims to achieve a 95% waste recycling rate in its retail stores. In 2022, the recycling rate was 45.9%, which is both a challenge and evidence of continued progress in this important initiative. Kroger also integrates sustainability goals into its reporting and operations. The company helps reduce food waste by implementing measures to extend the shelf life of food, such as improvements in packaging and storage. These efforts ensure that food stays fresh longer, resulting in less waste and underscoring Kroger’s commitment to sustainability and responsible business practices.40The Kroger Co. 2023 Environmental, Social & Governance Report. (2023).
3 Measures and instruments
Companies have numerous opportunities to make their processes and business practices more sustainable to reduce FWL within them and counteract global hunger. To support a sustainable approach, guidelines, regulations, measures and reporting are available to facilitate implementation and deepen understanding of the issues.
3.1 Guidelines
The guiding principles include the United Nations Global Compact (UNGC) and the European Union’s Circular Economy Action Plan (CEAP). While some of the requirements are mandatory, they also provide companies with voluntary guidelines. Companies can be motivated to integrate these guidelines through external and internal pressure, for example from non-governmental organizations (NGOs), trade unions, the media, customers and investors.41Orzes, G. et al. United Nations Global Compact: Literature review and theory-based research agenda. Journal of Cleaner Production 177, 633-654 (2018). https://doi.org:https://doi.org/10.1016/j.jclepro.2017.12.230
The UNGC is a voluntary initiative of the United Nations, with almost 25,000 companies now aligning their strategies and operations with the ten universal principles of the UNGC. These principles include human rights, labor standards, environmental protection and anti-corruption. Signing the UNGC implies a commitment to integrate the principles into the business practices of companies and to report regularly on the progress made. The protection of international human rights is a principle of the UNGC, which also includes securing a food base. According to this principle, companies should adapt their practices to avoid food waste and contribute to the redistribution of surplus food. Furthermore, the ninth principle aims to promote the development and dissemination of environmentally friendly technologies. In relation to hunger and food waste, this can mean that environmentally friendly technologies can increase efficiency in food production and processing and thus reduce waste within these processes.42United Nations Global Compact. United Nations Global Compact, https://unglobalcompact.org (n.d.).
In addition to the UNGC, the CEAP can also be seen as a guideline for companies. The CEAP aims to accelerate the transition to a circular economy. In a circular economy, resources are used efficiently while waste is minimized.43Handayati, Y. & Widyanata, C. Effective food waste management model for the sustainable agricultural food supply chain. Scientific Reports 14, 10290 (2024). https://doi.org:10.1038/s41598-024-59482-w The CEAP includes both mandatory and voluntary measures to promote sustainable production and consumption patterns. One such measure is the implementation of a food recycling program. This involves collecting unsold or surplus food and processing it into new products such as animal feed or using it to generate energy. Companies are encouraged to regularly report on their progress and measures in the area of the circular economy and to make their sustainability practices transparent.44Europäische Kommission. Mitteilung der Kommission an das Europäische Parlament, den Rat, den Europäischen Wirtschafts- und Sozialausschuss und den Ausschuss der Regionen. Ein neuer Aktionsplan für die Kreislaufwirtschaft. Für ein sauberes und wettbewerbsfähigeres Europa, https://eur-lex.europa.eu/resource.html?uri=cellar:9903b325-6388-11ea-b735-01aa75ed71a1.0016.02/DOC_1&format=PDF (2020).
To compare the two guidelines, it should be noted that the UNGC takes a global approach and addresses a wide range of ethical and social issues, while the CEAP focuses specifically on the EU and the circular economy. While the UNGC is voluntary and therefore offers a certain degree of flexibility for companies, but suffers from a lack of binding force, the CEAP contains binding measures that go hand in hand with stricter compliance but are associated with regional limitations.41Orzes, G. et al. United Nations Global Compact: Literature review and theory-based research agenda. Journal of Cleaner Production 177, 633-654 (2018). https://doi.org:https://doi.org/10.1016/j.jclepro.2017.12.230,44Europäische Kommission. Mitteilung der Kommission an das Europäische Parlament, den Rat, den Europäischen Wirtschafts- und Sozialausschuss und den Ausschuss der Regionen. Ein neuer Aktionsplan für die Kreislaufwirtschaft. Für ein sauberes und wettbewerbsfähigeres Europa, https://eur-lex.europa.eu/resource.html?uri=cellar:9903b325-6388-11ea-b735-01aa75ed71a1.0016.02/DOC_1&format=PDF (2020). Furthermore, the CEAP contains specific guidelines for reducing waste and promoting sustainable practices, while the UNGC provides a more general ethical framework.44Europäische Kommission. Mitteilung der Kommission an das Europäische Parlament, den Rat, den Europäischen Wirtschafts- und Sozialausschuss und den Ausschuss der Regionen. Ein neuer Aktionsplan für die Kreislaufwirtschaft. Für ein sauberes und wettbewerbsfähigeres Europa, https://eur-lex.europa.eu/resource.html?uri=cellar:9903b325-6388-11ea-b735-01aa75ed71a1.0016.02/DOC_1&format=PDF (2020).,45Voegtlin, C. & Pless, N. Global Governance: CSR and the role of the UN Global Compact. Journal of Business Ethics 122, 179-191 (2014). https://doi.org:10.1007/s10551-014-2214-8
In summary, both the UNGC and the CEAP offer companies valuable guidelines for sustainable development. The UNGC is characterized by its global and flexible approach, which creates a comprehensive, ethical basis. Additionally, the CEAP, on the other hand, focuses on the transition to a circular economy in the EU with specific and binding measures.
3.2 Measures for food waste
Before companies take measures to reduce food waste, they should consider the following diagram and integrate the measures according to the priority shown. This hierarchy, from prevention to disposal, serves as a guide for sustainable waste management and helps to set priorities (Fig. 4).
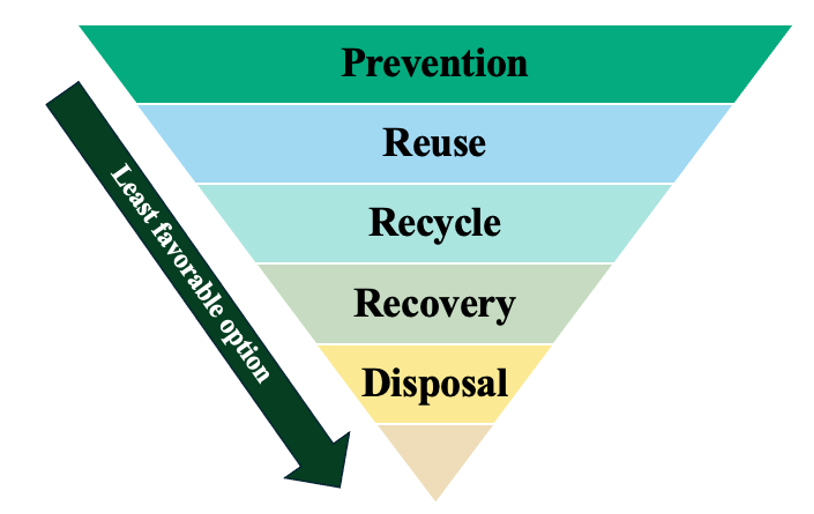
Preventing overproduction and surplus food is a top priority in the food waste hierarchy. This can be achieved through improved production planning, demand-driven farming practices and optimized inventory management using advanced technology.43Handayati, Y. & Widyanata, C. Effective food waste management model for the sustainable agricultural food supply chain. Scientific Reports 14, 10290 (2024). https://doi.org:10.1038/s41598-024-59482-w,46Papargyropoulou, E., Lozano, R., K. Steinberger, J., Wright, N. & Ujang, Z. b. The food waste hierarchy as a framework for the management of food surplus and food waste. Journal of Cleaner Production 76, 106-115 (2014). https://doi.org:https://doi.org/10.1016/j.jclepro.2014.04.020 One example is the use of the NetSuite ERP system by supermarkets for efficient stock maintenance and sales area organization. The implementation of a first-in-first-out system and real-time inventory monitoring enables the prompt sale of older stock.47NetSuite. Enterprise Resource Planning, https://www.netsuite.de/portal/de/products/erp.shtml (n.d.). A refrigeration management system can also monitor the cold chain and prevent waste of perishable goods.48Sensitech. The Ultimate Guide to Cold Chain Temperature Monitoring, https://www.sensitech.com/en/blog/blog-articles/blog-ultimate-guide-cold-chain-monitoring.html (n.d.). Close collaboration with farmers to avoid overproduction and optimize production plans is also essential.49Moraes, N. V., Lermen, F. H. & Echeveste, M. E. S. A systematic literature review on food waste/loss prevention and minimization methods. Journal of Environmental Management 286, 112268 (2021). https://doi.org:https://doi.org/10.1016/j.jenvman.2021.112268,50Kor, Y. Y., Prabhu, J. & Esposito, M. How Large Food Retailers Can Help Solve the Food Waste Crisis. Harvard Business Review (2017). This can be achieved through the exchange of forecasting data, techniques to increase productivity and support through agricultural technology, such as Cropin.51Cropin. Cropin, https://www.cropin.com (n.d.). Education and awareness campaigns are also important measures to bring about a change in thinking both within companies and at consumer level and to reduce food waste.52Al-Obadi, M., Ayad, H., Pokharel, S. & Ayari, M. A. Perspectives on food waste management: Prevention and social innovations. Sustainable Production and Consumption 31, 190-208 (2022). https://doi.org:https://doi.org/10.1016/j.spc.2022.02.012 Media campaigns, workshops and information materials on the correct storage and use of food can have a positive influence on consumer behavior and reduce the amount of waste in the household.50Kor, Y. Y., Prabhu, J. & Esposito, M. How Large Food Retailers Can Help Solve the Food Waste Crisis. Harvard Business Review (2017). Programs such as those of the World Wildlife Fund (WWF) and the Global Child Nutrition Foundation (GCNF) offer extensive educational materials and promote school nutrition programs to optimize global child nutrition.53Global Child Nutrition Foundation. GNCF, https://gcnf.org (n.d.).,54World Wildlife Fund. Food Waste Warriors. (2019).
The second priority level is reuse. One of the most important measures is the redistribution of surplus food to needy groups and charitable organizations. Through partnerships with food banks and the establishment of an infrastructure for the safe and efficient distribution of food, surplus but still edible food can be used to support people in need and reduce food waste.46Papargyropoulou, E., Lozano, R., K. Steinberger, J., Wright, N. & Ujang, Z. b. The food waste hierarchy as a framework for the management of food surplus and food waste. Journal of Cleaner Production 76, 106-115 (2014). https://doi.org:https://doi.org/10.1016/j.jclepro.2014.04.020,49Moraes, N. V., Lermen, F. H. & Echeveste, M. E. S. A systematic literature review on food waste/loss prevention and minimization methods. Journal of Environmental Management 286, 112268 (2021). https://doi.org:https://doi.org/10.1016/j.jenvman.2021.112268 Examples of such non-profit organizations are the World Food Programme (WFP) or the Global Food Banking Network (GFN).55World Food Programme. World Food Programme, https://de.wfp.org (n.d.).,56The Global Food Banking Network. The Global Food Banking Network, https://www.foodbanking.org (n.d.). Surplus food that is no longer suitable for consumption can also be used as animal feed.52Al-Obadi, M., Ayad, H., Pokharel, S. & Ayari, M. A. Perspectives on food waste management: Prevention and social innovations. Sustainable Production and Consumption 31, 190-208 (2022). https://doi.org:https://doi.org/10.1016/j.spc.2022.02.012 Distribution systems such as CSS are available for this purpose.57CSS. CSS Crop Nutrition Products & Pet Food Ingredients, https://www.calsafesoil.com (n.d.).
Recycling of overproduction and surplus food represents the third stage of the food waste hierarchy pyramid. At this stage, food waste is converted into compost, which can be used as fertilizer in agriculture.46Papargyropoulou, E., Lozano, R., K. Steinberger, J., Wright, N. & Ujang, Z. b. The food waste hierarchy as a framework for the management of food surplus and food waste. Journal of Cleaner Production 76, 106-115 (2014). https://doi.org:https://doi.org/10.1016/j.jclepro.2014.04.020 The Composting Network, for example, promotes precisely these projects.58The Composting Network. Composting Network, https://compostingnetwork.com (n.d.).
The fourth stage is recovery. The conversion of food waste into valuable resources can take place by means of anaerobic digestion plants.46Papargyropoulou, E., Lozano, R., K. Steinberger, J., Wright, N. & Ujang, Z. b. The food waste hierarchy as a framework for the management of food surplus and food waste. Journal of Cleaner Production 76, 106-115 (2014). https://doi.org:https://doi.org/10.1016/j.jclepro.2014.04.020,52Al-Obadi, M., Ayad, H., Pokharel, S. & Ayari, M. A. Perspectives on food waste management: Prevention and social innovations. Sustainable Production and Consumption 31, 190-208 (2022). https://doi.org:https://doi.org/10.1016/j.spc.2022.02.012 Anaerobic digestion contributes to the production of biogas. Divert Inc., for example, uses waste to generate electricity and heat through biogas.59Divert. divert, https://divertinc.com (n.d.).
Disposal is therefore the last measure that should be taken by companies. Landfills with gas collection systems can be used to minimize greenhouse gas emissions and ensure the environmentally sound disposal of waste if no other options are available.46Papargyropoulou, E., Lozano, R., K. Steinberger, J., Wright, N. & Ujang, Z. b. The food waste hierarchy as a framework for the management of food surplus and food waste. Journal of Cleaner Production 76, 106-115 (2014). https://doi.org:https://doi.org/10.1016/j.jclepro.2014.04.020
In summary, this waste hierarchy can be seen as a clear guide for policy makers and businesses. It emphasizes that the hierarchy helps to prioritize waste prevention and reuse before considering less sustainable options such as recycling.46Papargyropoulou, E., Lozano, R., K. Steinberger, J., Wright, N. & Ujang, Z. b. The food waste hierarchy as a framework for the management of food surplus and food waste. Journal of Cleaner Production 76, 106-115 (2014). https://doi.org:https://doi.org/10.1016/j.jclepro.2014.04.020 Nevertheless, the implementation of the waste hierarchy is accompanied by significant investments in education, infrastructure and technology. It also shows that some measures, such as waste prevention, are difficult to implement and can be met with resistance and depend heavily on local conditions and acceptance by consumers and businesses.60Van Ewijk, S. & Stegemann, J. A. Limitations of the waste hierarchy for achieving absolute reductions in material throughput. Journal of Cleaner Production 132, 122-128 (2016). https://doi.org:https://doi.org/10.1016/j.jclepro.2014.11.051
3.3 Measures for hunger
Companies can also take individual measures to combat global hunger. A key role here is played by financial support.61Dhahri, S. & Omri, A. Foreign capital towards SDGs 1 & 2—Ending Poverty and hunger: The role of agricultural production. Structural Change and Economic Dynamics 53, 208-221 (2020). https://doi.org:https://doi.org/10.1016/j.strueco.2020.02.004 Regular contributions to organizations such as the WFP or local aid organizations enable them to continuously finance projects to combat hunger and develop long-term strategies.62World Food Programme. Who are we?, https://www.wfp.org/who-we-are (n.d.). Investments in sustainable agricultural projects can also make a significant difference. These projects aim to increase agricultural productivity and promote sustainable practices, such as through the One Acre Fund organization (https://oneacrefund.org/our-impact). This also includes the development of infrastructure, such as irrigation systems and warehouses, which improve the efficiency and effectiveness of food supply chains.61Dhahri, S. & Omri, A. Foreign capital towards SDGs 1 & 2—Ending Poverty and hunger: The role of agricultural production. Structural Change and Economic Dynamics 53, 208-221 (2020). https://doi.org:https://doi.org/10.1016/j.strueco.2020.02.004,63Islam, M. R. Hunger Reduction in China: An Analysis of Contextual Factors. Asian Social Work and Policy Review 10, 295-310 (2016). https://doi.org:https://doi.org/10.1111/aswp.12098
Another important measure is time off for volunteering. Companies can grant their employees paid time off to volunteer at food banks, soup kitchens or in international aid projects. This not only promotes a sense of community and social commitment among employees, but also contributes directly to the fight against hunger.64de Gilder, D., Schuyt, T. N. M. & Breedijk, M. Effects of an Employee Volunteering Program on the Work Force: The ABN-AMRO Case. Journal of Business Ethics 61, 143-152 (2005).,65Stauffer, J. M., Vanajakumari, M., Kumar, S. & Mangapora, T. Achieving equitable food security: How can food bank mobile pantries fill this humanitarian need. Production and Operations Management 31, 1802-1821 (2022). https://doi.org:https://doi.org/10.1111/poms.13663
Supporting small farmers through technical advice and the establishment of cooperatives also makes a significant difference. Agricultural advisors can help farmers to implement efficient and sustainable farming methods. By promoting and supporting agricultural cooperatives, resources can be shared and better market opportunities created.66Bizikova, L. et al. A scoping review of the contributions of farmers’ organizations to smallholder agriculture. Nature Food 1, 620-630 (2020). https://doi.org:10.1038/s43016-020-00164-x
Training courses and workshops are also essential to introduce farmers to modern farming methods and technologies. Demonstration farms, where innovative agricultural technologies and practices are introduced, serve as hands-on learning sites, such as the International Maize and Wheat Improvement Center (CIMMYT) in Mexico.67Lin, S. & Cui, J. South-South cooperation and food security: Evidence from Chinese agricultural technology demonstration Center in Africa. China Economic Quarterly International 4, 1-12 (2024). https://doi.org:https://doi.org/10.1016/j.ceqi.2024.02.001,68Nakano, Y., Tsusaka, T. W., Aida, T. & Pede, V. O. Is farmer-to-farmer extension effective? The impact of training on technology adoption and rice farming productivity in Tanzania. World Development 105, 336-351 (2018). https://doi.org:https://doi.org/10.1016/j.worlddev.2017.12.013,69International Maize and Wheat Improvement Center. CIMMYT, https://www.cimmyt.org/about/ (n.d.). Equally important are vocational training centers that offer practical training in agricultural and food-related professions. Internships and apprenticeships in agriculture and the food industry offer young people prospects and promote the development of new skills.70Papakonstantinou, A., Koutsoukos, M., Zoukidis, K. & Vergos, E. Vocational Training of Young Farmers: The Case of Students of the American Farm School Vocational Training Institute. Journal of Agricultural Science 14, 36 (2022). https://doi.org:10.5539/jas.v14n7p36
Improving infrastructure, especially road construction, plays an essential role in optimizing FSC. Investment in the construction and maintenance of roads connecting rural areas to markets is crucial to improve accessibility.71Shamdasani, Y. Rural road infrastructure & agricultural production: Evidence from India. Journal of Development Economics 152, 102686 (2021). https://doi.org:https://doi.org/10.1016/j.jdeveco.2021.102686,72de Mattos, E. J. & Bagolin, I. P. Reducing Poverty and Food Insecurity in Rural Brazil: the Impact of the Zero Hunger Program. EuroChoices 16, 43-49 (2017). https://doi.org:https://doi.org/10.1111/1746-692X.12150 Modern logistics solutions and the optimization of supply chains help to make the transport of food more efficient and cost-effective. The development and implementation of cold chain solutions is essential to keep perishable food fresh. Modern warehouses and improved storage capacities in agricultural areas help to minimize crop losses.72de Mattos, E. J. & Bagolin, I. P. Reducing Poverty and Food Insecurity in Rural Brazil: the Impact of the Zero Hunger Program. EuroChoices 16, 43-49 (2017). https://doi.org:https://doi.org/10.1111/1746-692X.12150,73Han, J.-W. et al. A comprehensive review of cold chain logistics for fresh agricultural products: Current status, challenges, and future trends. Trends in Food Science & Technology 109, 536-551 (2021). https://doi.org:https://doi.org/10.1016/j.tifs.2021.01.066
The approaches used to combat hunger each have advantages and disadvantages. The continuous financing of projects can be ensured through financial support, but there is a risk of dependency.74Fokam, G., Tadadjeu, S., Kamguia, B. & Djeunankan, R. Does financial development contribute to the achievement of the “Zero Hunger” goal in Africa? African Development Review 35, 255-269 (2023). https://doi.org:https://doi.org/10.1111/1467-8268.12708,75Kirwan, B. E. & McMillan, M. Food Aid and Poverty. American Journal of Agricultural Economics 89, 1152-1160 (2007). https://doi.org:10.1111/j.1467-8276.2007.01076.x Investments in sustainable agriculture result in an increase in productivity and an improvement in infrastructure. However, the effects only become apparent after a longer period of time and are associated with high costs.76DeLonge, M. S., Miles, A. & Carlisle, L. Investing in the transition to sustainable agriculture. Environmental Science & Policy 55, 266-273 (2016). https://doi.org:https://doi.org/10.1016/j.envsci.2015.09.013 Taking time off to volunteer promotes social commitment, but can lead to a loss of productivity.64de Gilder, D., Schuyt, T. N. M. & Breedijk, M. Effects of an Employee Volunteering Program on the Work Force: The ABN-AMRO Case. Journal of Business Ethics 61, 143-152 (2005). Technical advice and training help to strengthen local agriculture, but require ongoing investment.70Papakonstantinou, A., Koutsoukos, M., Zoukidis, K. & Vergos, E. Vocational Training of Young Farmers: The Case of Students of the American Farm School Vocational Training Institute. Journal of Agricultural Science 14, 36 (2022). https://doi.org:10.5539/jas.v14n7p36 Optimizing supply chains through infrastructural improvements is associated with high costs and a considerable amount of time.77Moon, I., Jeong, Y. J. & Saha, S. Investment and coordination decisions in a supply chain of fresh agricultural products. Operational Research 20, 2307-2331 (2020). https://doi.org:10.1007/s12351-018-0411-4 The results suggest that a holistic, contextualized combination of these measures is the most effective way to develop sustainable solutions to combat hunger.
3.4 Management systems and methods
The voluntary use of certified environmental standards is a popular way for companies to improve and communicate their environmental performance, such as through ISO 14001 or the Eco-Management and Audit Scheme (EMAS).
ISO 14001 is an internationally recognized standard for environmental management systems that aims to identify and reduce the environmental impact of companies. As a private sector standard, it is not based on public law regulations.78Sorooshian, S., Qi, L. C. & Li Fei, L. Characterization of ISO 14001 implementation. Environmental Quality Management 27, 97-105 (2018). https://doi.org:https://doi.org/10.1002/tqem.21532 International recognition facilitates companies’ access to global markets and enables seamless integration with other management systems, allowing a comprehensive sustainable approach to be taken, including the reduction of food waste.79Umwelt Gutachter Ausschuss EMAS – Mehrwert schaffen, Risiken vermeiden. Die Stärken von EMAS gegenüber der ISO 14001. (2018).
EMAS is a voluntary environmental management and audit system of the EU. It aims to continuously improve the environmental performance of organizations and sets comprehensive requirements for environmental reporting and transparency. EMAS is based on ISO 14001 but exceeds its requirements. The basis for EMAS is the European Regulation No. 1221/2009. Companies participating in EMAS are obliged to publish a validated environmental statement containing detailed information on the organization’s environmental performance.80Umwelt Gutachter Ausschuss Was ist EMAS?, https://www.emas.de/fileadmin/user_upload/4-pub/Flyer_Was-ist-EMAS.pdf (2023).
The flexibility of ISO 14001 allows companies to develop customized food waste reduction strategies that meet their specific needs and contexts.78Sorooshian, S., Qi, L. C. & Li Fei, L. Characterization of ISO 14001 implementation. Environmental Quality Management 27, 97-105 (2018). https://doi.org:https://doi.org/10.1002/tqem.21532 Companies seeking international recognition and adaptability to different management systems can benefit significantly from ISO. 14001 EMAS offers a more advanced option for companies that prioritize transparency and stakeholder engagement. EMAS can contribute significantly to the reduction of food waste, for example, through employee involvement.79Umwelt Gutachter Ausschuss EMAS – Mehrwert schaffen, Risiken vermeiden. Die Stärken von EMAS gegenüber der ISO 14001. (2018).,80Umwelt Gutachter Ausschuss Was ist EMAS?, https://www.emas.de/fileadmin/user_upload/4-pub/Flyer_Was-ist-EMAS.pdf (2023). The combination of both systems can help companies to increase internal efficiencies and gain external credibility and trust.79Umwelt Gutachter Ausschuss EMAS – Mehrwert schaffen, Risiken vermeiden. Die Stärken von EMAS gegenüber der ISO 14001. (2018).
Another management system is lean management, which can lead to a reduction in food waste through the use of various methods and tools. Lean management is a comprehensive management approach that aims to minimize waste, optimize processes and increase efficiency.81Lean Management – Repräsentative Studie. Personal 45, 484-484 (1993). Within lean management there are methods such as the DMAIC cycle, Value Stream Mapping (VSM), or the 3R method, which help to identify and reduce waste within processes.
The DMAIC cycle is a structured approach to solving problems within various processes. As shown in the following diagram, the improvement process goes through five phases (Fig. 5).

The described cycle can also be applied to the reduction of food waste within a process. In the first phase, the goal of reducing food waste within production is defined. The second phase is completed by measuring the current amount of waste in kg per day as well as the unsold goods and subsequently analyzing this data. Subsequently, the cause of the waste is identified using the 5-Why-Analysis, for example, and inefficient processes are recognized. Based on these findings, specific measures can be taken in the fourth phase, such as optimizing storage conditions or introducing training. The final phase involves checking whether the optimized process is maintained in the long term.83Widiwati, I. T. B., Liman, S. D. & Nurprihatin, F. The implementation of Lean Six Sigma approach to minimize waste at a food manufacturing industry. Journal of Engineering Research (2024). https://doi.org:https://doi.org/10.1016/j.jer.2024.01.022,84Wang, C.-N., Nguyen, T.-D., Thi Nguyen, T.-T. & Do, N.-H. The performance analysis using Six Sigma DMAIC and integrated MCDM approach: A case study for microlens process in Vietnam. Journal of Engineering Research(2024). https://doi.org:https://doi.org/10.1016/j.jer.2024.04.013 In general, it can be said that the DMAIC cycle is a structured method for identifying and eliminating bottlenecks and inefficiencies in processes.85Nandakumar, N., Saleeshya, P. G. & Harikumar, P. Bottleneck Identification And Process Improvement By Lean Six Sigma DMAIC Methodology. Materials Today: Proceedings 24, 1217-1224 (2020). https://doi.org:https://doi.org/10.1016/j.matpr.2020.04.436 Applying this methodology promotes data collection and analysis so that informed decisions can be made and precise solutions can be implemented based on a solid database. However, implementation can be costly in terms of money and time and requires ongoing monitoring to ensure sustainable effectiveness of the measures implemented.84Wang, C.-N., Nguyen, T.-D., Thi Nguyen, T.-T. & Do, N.-H. The performance analysis using Six Sigma DMAIC and integrated MCDM approach: A case study for microlens process in Vietnam. Journal of Engineering Research(2024). https://doi.org:https://doi.org/10.1016/j.jer.2024.04.013,85Nandakumar, N., Saleeshya, P. G. & Harikumar, P. Bottleneck Identification And Process Improvement By Lean Six Sigma DMAIC Methodology. Materials Today: Proceedings 24, 1217-1224 (2020). https://doi.org:https://doi.org/10.1016/j.matpr.2020.04.436
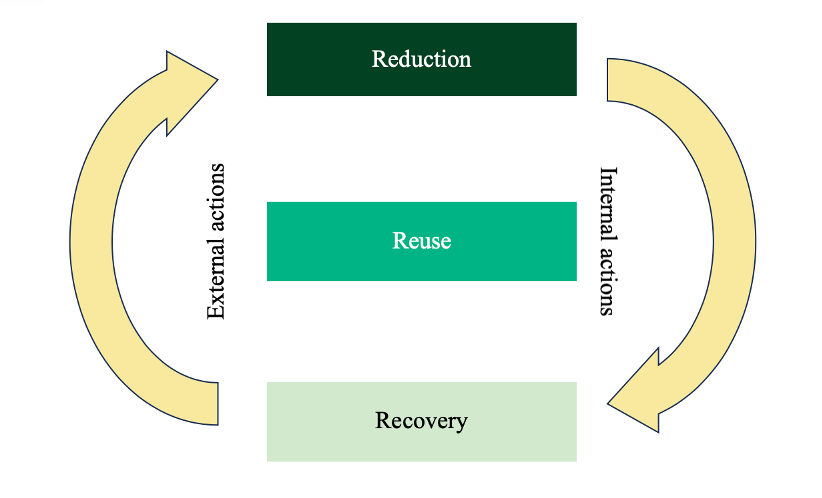
The 3R method (Reduction, Reuse, Recovery) is also an effective tool in lean management that helps to reduce waste. The method focuses on minimizing waste by reducing it at source, reusing materials and recycling resources. Chapter 3.2 has already explained the reduction, reuse and recovery steps in detail with measures that can be taken in this context. These can be applied equally within the 3R method. The 3R method promotes the efficient use of resources, which leads to lower operating costs and a more sustainable use of raw materials.86Fercoq, A., Lamouri, S., Carbone, V., Lelièvre, A. & Lemieux, A. A. Combining lean and green in manufacturing: a model of waste management. IFAC Proceedings Volumes 46, 117-122 (2013). https://doi.org:https://doi.org/10.3182/20130619-3-RU-3018.00164
Internally, companies should first take steps to reduce waste before looking for ways to reuse or recycle it. Externally, the first step is to look for recycling opportunities before considering reuse and reduction. (Fig. 6).
3.5 Reporting and transparency
Transparent reporting is also an essential element of sustainable corporate management. The Global Reporting Initiative (GRI) creates a recognized framework for the systematic recording, analysis and communication of the economic, ecological and social impact of organizations. Additionally, the application of the GRI standards enables companies to document their sustainability performance in a comprehensive manner. This promotes transparency, accountability and sustainability.87Global Reporting Initiative. Continuos improvement, https://www.globalreporting.org/standards/ (n.d.). The GRI 306: Waste 2020 Standard provides specific guidance for reporting on waste management and its impacts. The standard covers material disclosures, including waste generation and its impacts (Disclosure 306-1), measures to prevent waste and the management of significant waste-related impacts (Disclosure 306-2), the total amount of waste by composition (Disclosure 306-3), and the amount of waste diverted from disposal (Disclosure 306-4) or sent for disposal (Disclosure 306-5).88GRI Standards. GRI 306: Waste 2020. Report No. 978-90-8866-132-7, (2024).
The Corporate Knights Global 100 is an authoritative tool for evaluating the sustainability performance of companies, which is published annually by the Toronto-based media and research organization Corporate Knights. This ranking identifies and promotes examples of best practice in the areas of environmental, social and governance (ESG), based on an evaluation of a large number of sustainability indicators.89Corporate Knights. About Us, https://www.corporateknights.com/about-us/ (n.d.). The evaluation is based on publicly available data from company and sustainability reports as well as other relevant documents. The weighting of the indicators is adjusted depending on the relevance of the sector. Additionally, the publication of the Corporate Knights Global 100 contributes to transparency with regard to the sustainability performance of large companies and strengthens their accountability. The companies on the list act as role models and encourage other companies to also implement more sustainable business models. Furthermore, the list serves to support investors in identifying sustainable companies and integrating ESG factors into their investment decisions.90McCarthy, S. The Global 100 list: How the world’s most sustainable corporations are driving the green transition. (2024).
In summary, transparent reporting on sustainability performance through recognized standards such as the GRI and initiatives such as the Corporate Knights Global 100 are key to promoting sustainability and accountability in companies. These standards and initiatives provide companies with the necessary tools to optimize their sustainability practices and make them accessible to the general public, ultimately leading to a more sustainable and responsible business world. Nevertheless, a potential whitewashing of companies’ sustainability performance should not go unnoticed.91Hahn, R. & Lülfs, R. Legitimizing Negative Aspects in GRI-Oriented Sustainability Reporting: A Qualitative Analysis of Corporate Disclosure Strategies. Journal of Business Ethics 123, 401-420 (2014). https://doi.org:10.1007/s10551-013-1801-4
3.6 Best practice example
McCormick is one of the 50 most sustainable companies in the Corporate Knights Global 100 and is one of the world’s leading manufacturers of flavors.90McCarthy, S. The Global 100 list: How the world’s most sustainable corporations are driving the green transition. (2024). On its corporate website, McCormick actively promotes the goals of the SDGs. Not only does this strengthen the resilience of the smallholder farmers who produce for the company, but a large number of employees are also involved in a donation initiative to combat food insecurity to support the SDG goal of “Zero Hunger”. The company not only reports on its social commitment on its website, but also publishes a Purpose-Led Performance Report to provide information on its achievements and progress. Additionally, the goals are divided into the categories People Goals, Communities Goals and Planet Goals and are all in line with the SDG goals. The targeted progress is documented in concrete figures so that performance can be tracked over the years. In addition, a GRI index table is published with the annual Purpose-Led Report, which demonstrates transparency and presents specific data on various topics. For example, the exact quantities of waste are disclosed and the methodology for recording these quantities is explained. McCormick also follows the waste hierarchy approach and parts of the 3R method. to achieve SDG target 12, the company plans to recycle or reuse 85% of its waste by 2030. Plastic packaging is even to be completely reused, recycled or recovered by 2030.92McCormick & Co. Purpose-Led Performance. 2023 Progess Report. (2023).
4 Drivers and barriers
4.1 Internal drivers und barriers food waste
Economical: „Profit from your surplus food“ (Too Good To Go).38Too Good To Go. Marketplace Surprise Bags, https://www.toogoodtogo.com/surplus-food-marketplace (n.d.). This slogan aptly describes the business model of Too Good To Go, an initiative aimed at participating companies. Bakeries, restaurants and supermarkets have the opportunity to pack surplus food that would otherwise be thrown away at the end of the day into bags and offer them via the Too Good To Go app. Consumers can reserve these bags via the app and collect them from the respective shop in the evening.38Too Good To Go. Marketplace Surprise Bags, https://www.toogoodtogo.com/surplus-food-marketplace (n.d.).
This model allows companies to generate additional sales with food that would otherwise no longer be sold and would have ended up in the bin. The bags are also an effective marketing tool, as consumers get to know the businesses better and can return as potential regular customers. They can also discover other appealing products on site. Initiatives such as Too Good To Go therefore not only help to reduce food waste, but also act as an economic driver for the companies involved.38Too Good To Go. Marketplace Surprise Bags, https://www.toogoodtogo.com/surplus-food-marketplace (n.d.).
As already explained, companies tend to produce more than they actually need to be able to meet customer demand at all times so that profits remain secure. This overproduction inevitably leads to an increase in food waste. In addition, inefficient storage and inadequate stock management can contribute to food having to be disposed of after it has passed its expiry date before it reaches the end consumer. A typical example of this is food prepared in restaurants that has not been sold at the end of the day and is therefore disposed of.93Sakaguchi, L., Pak, N. & Potts, M. D. Tackling the issue of food waste in restaurants: Options for measurement method, reduction and behavioral change. Journal of Cleaner Production 180, 430-436 (2018). https://doi.org:https://doi.org/10.1016/j.jclepro.2017.12.136
These examples illustrate that inadequate planning and sub-optimal forecasting are major obstacles to reducing food waste.94Thyberg, K. L. & Tonjes, D. J. Drivers of food waste and their implications for sustainable policy development. Resources, Conservation and Recycling 106, 110-123 (2016). https://doi.org:https://doi.org/10.1016/j.resconrec.2015.11.016
Socio-cultural: The products offered by the company must fulfil certain aesthetic requirements and standards that the companies themselves have for their products. Products that do not meet these standards are rejected, even if they are perfectly suitable for consumption. This practice highlights the problem that a lack of education and awareness about the consequences of large amounts of waste is widespread.43Handayati, Y. & Widyanata, C. Effective food waste management model for the sustainable agricultural food supply chain. Scientific Reports 14, 10290 (2024). https://doi.org:10.1038/s41598-024-59482-w Retailers often do not recognize the problem of food waste as urgent, as recycling and disposal practices exist that conceal the extent of the problem.95Filimonau, V. & Gherbin, A. An exploratory study of food waste management practices in the UK grocery retail sector. Journal of Cleaner Production 167, 1184-1194 (2017). https://doi.org:https://doi.org/10.1016/j.jclepro.2017.07.229 This view makes it difficult to reduce food waste in some areas. Measures to combat this problem and reduce food waste include initiatives such as Lidl’s ‘saviour bag’. These bags contain fruit and vegetables that would not be offered in regular sales due to minor blemishes or deviations from aesthetic standards. Instead of disposing of this food, it is sold to consumers at a heavily discounted price of €3 per bag. Part of the proceeds are also donated to the food bank. In this way, Lidl generates small profits from food that would otherwise have been thrown away and at the same time contributes to a social project. This shows that such initiatives can be an incentive for companies not only economically, but also from a socio-cultural perspective.96Lidl. Lidl gibt Obst und Gemüse eine zweite Chance. Mit der deutschlandweiten Einführung der Rettertüte geht das Unternehmen im Rahmen der Lidl-Lebensmittelrettung einen weiteren wichtigen Schritt, https://unternehmen.lidl.de/pressreleases/2022/220801_rettertuete (2022). Another socio-cultural factor is consumers’ expectations of portion sizes, which often lead to excessive consumption. For example, people at buffets tend to choose larger portions that cannot be fully consumed later. The consumer advice centre therefore recommends that companies take measures to reduce food waste, for example by charging a fee for leftover food. Smaller containers at the buffet can also help to reduce waste.97Verbraucherzentrale. Essen außer Haus: Was in Töpfen und auf den Tellern bleibt, https://www.verbraucherzentrale.de/wissen/lebensmittel/auswaehlen-zubereiten-aufbewahren/essen-ausser-haus-was-in-toepfen-und-auf-den-tellern-bleibt-59537 (2024).
Political/Legal: The willingness of supermarkets to donate food to reduce food waste is often limited by legal concerns. In particular, there is concern that health incidents could occur if donated food spoils during the donation process. Additionally, in such cases, liability claims and potential reputational damage would be a concern. Such concerns are an obstacle for companies to take action against food waste, for example in the form of donations.98Alexander, C. & Smaje, C. Surplus retail food redistribution: An analysis of a third sector model. Resources, Conservation and Recycling 52, 1290-1298 (2008). https://doi.org:https://doi.org/10.1016/j.resconrec.2008.07.009
Technological: Modern technologies could, for example, help to reduce food waste by packaging products in such a way that they have a longer shelf life and no longer expire so quickly.99Canali, M. et al. Food Waste Drivers in Europe, from Identification to Possible Interventions. Sustainability 9, 37 (2017).,100Wahbeh, S., Anastasiadis, F., Sundarakani, B. & Manikas, I. Exploration of Food Security Challenges towards More Sustainable Food Production: A Systematic Literature Review of the Major Drivers and Policies. Foods 11, 3804 (2022). However, such modern technologies, which could increase operational efficiency and thus also reduce waste, are very cost-intensive and not realizable for all companies, which is an obstacle for many companies to implement them. The lack of technologies and the lack of traceability ultimately means that problems cannot be recognized at an early stage, making it more difficult to implement targeted measures.101Annosi, M. C., Brunetta, F., Bimbo, F. & Kostoula, M. Digitalization within food supply chains to prevent food waste. Drivers, barriers and collaboration practices. Industrial Marketing Management 93, 208-220 (2021). https://doi.org:https://doi.org/10.1016/j.indmarman.2021.01.005
4.2 External drivers and barriers food waste
Economical: From a business perspective, it makes sense to introduce special offers from time to time to entice customers. However, in supermarkets, for example, this leads to overconsumption by consumers, which ultimately means that more has to be disposed of.102Stancu, V., Haugaard, P. & Lähteenmäki, L. Determinants of consumer food waste behaviour: Two routes to food waste. Appetite 96, 7-17 (2016). https://doi.org:https://doi.org/10.1016/j.appet.2015.08.025 This economic view of companies hinders any measures to reduce food waste. Furthermore, in some countries there is no financial incentive to minimize waste or consider reuse or recycling options due to low disposal fees and a lack of tax breaks on food donations.99Canali, M. et al. Food Waste Drivers in Europe, from Identification to Possible Interventions. Sustainability 9, 37 (2017).
Socio-cultural: In the socio-cultural sector, customer expectations play a decisive role. In restaurants or other food outlets, customers have certain expectations of the portion size they are served. However, larger portions contribute significantly to waste. Even at buffets, the plates are often filled too full, which usually leads to the leftovers being thrown away afterwards.103Filimonau, V., Todorova, E., Mzembe, A., Sauer, L. & Yankholmes, A. A comparative study of food waste management in full service restaurants of the United Kingdom and the Netherlands. Journal of Cleaner Production 258, 120775 (2020). https://doi.org:https://doi.org/10.1016/j.jclepro.2020.120775
Measures that aim to reduce food waste, for example with regard to the demands or standards of companies and consumers, are initiatives such as etepetete. Etepetete offers various organic boxes containing fruit and vegetables that should have been disposed of due to defects and have been saved. This food would not be offered in normal sales or would be bought by consumers at normal prices and therefore also indirectly helps companies to reduce food waste.104Etepetete. etepetete, https://etepetete-bio.de (n.d.).
Political/Legal: Political regulations can standardize the appearance and texture of a product, preventing certain foods from reaching the supermarket shelf due to cosmetic requirements such as shape or size These regulations thus fuel a standardized image of food and also make it more difficult for companies such as supermarkets to reduce food waste.99Canali, M. et al. Food Waste Drivers in Europe, from Identification to Possible Interventions. Sustainability 9, 37 (2017).
In the EU in particular, strict hygiene and safety regulations, such as for opened packaging, temperature controls or pesticide residues, have a significant influence on FWL. These regulations lead to food being disposed of as a precautionary measure to protect the consumer, even though some of it would still be safe to consume.94Thyberg, K. L. & Tonjes, D. J. Drivers of food waste and their implications for sustainable policy development. Resources, Conservation and Recycling 106, 110-123 (2016). https://doi.org:https://doi.org/10.1016/j.resconrec.2015.11.016,99Canali, M. et al. Food Waste Drivers in Europe, from Identification to Possible Interventions. Sustainability 9, 37 (2017).
Technological: Advancing industrialization and globalization are also intensifying international trade and increasing demand for non-regional products. In terms of infrastructure, this results in longer supply chains and storage times, which harbours potential for waste.94Thyberg, K. L. & Tonjes, D. J. Drivers of food waste and their implications for sustainable policy development. Resources, Conservation and Recycling 106, 110-123 (2016). https://doi.org:https://doi.org/10.1016/j.resconrec.2015.11.016
However, a well-developed infrastructure can make a significant contribution to reducing food waste. If there is a lack of such a good infrastructure, such as functioning cold chains, losses can occur due to spoilage.43Handayati, Y. & Widyanata, C. Effective food waste management model for the sustainable agricultural food supply chain. Scientific Reports 14, 10290 (2024). https://doi.org:10.1038/s41598-024-59482-w
4.3 Internal drivers and barriers hunger
Economical: to lead initiatives and develop effective programmes against hunger, the company needs financial and human resources that not every company can provide. There is also often a lack of knowledge about how these programmes can be designed.105Fallah Shayan, N., Mohabbati-Kalejahi, N., Alavi, S. & Zahed, M. A. Sustainable Development Goals (SDGs) as a Framework for Corporate Social Responsibility (CSR). Sustainability 14, 1222 (2022). Efficiency-enhancing technologies can also be associated with high costs. In the long term, however, they can primarily save costs, which means that even initially high costs can be a long-term economic driver.11Grewal, D., Guha, A., Noble, S. M. & Bentley, K. The food production–consumption chain: Fighting food insecurity, loss, and waste with technology. Journal of the Academy of Marketing Science (2024). https://doi.org:10.1007/s11747-024-01040-x
Socio-cultural: The ethical orientation and values of a company can motivate and obligate the organization to take responsibility and contribute to the fight against hunger. Committed employees can also influence the company in this respect and act as a driving force. Companies that are actively involved in the fight against hunger, for example by donating food, can improve their corporate image and be perceived as a socially committed company.105Fallah Shayan, N., Mohabbati-Kalejahi, N., Alavi, S. & Zahed, M. A. Sustainable Development Goals (SDGs) as a Framework for Corporate Social Responsibility (CSR). Sustainability 14, 1222 (2022).
Technological: A modern IT infrastructure enables companies to implement technologies quickly. The introduction of new technologies can increase the company’s efficiency.11Grewal, D., Guha, A., Noble, S. M. & Bentley, K. The food production–consumption chain: Fighting food insecurity, loss, and waste with technology. Journal of the Academy of Marketing Science (2024). https://doi.org:10.1007/s11747-024-01040-x
4.4 External drivers and barriers hunger
Economical: In some countries, there is a lack of financial incentives for retailers to donate surplus food to combat local and international hunger, among other things. However, in France, for example, there are tax credits if the company donates surplus food, which incentivizes companies to donate food and thus contribute to the fight against hunger.106Thapa Karki, S., Bennett, A. C. T. & Mishra, J. L. Reducing food waste and food insecurity in the UK: The architecture of surplus food distribution supply chain in addressing the sustainable development goals (Goal 2 and Goal 12.3) at a city level. Industrial Marketing Management 93, 563-577 (2021). https://doi.org:https://doi.org/10.1016/j.indmarman.2020.09.019
Socio-cultural: Public pressure on companies to become socially involved is constantly increasing. This motivates companies to take concrete measures to combat hunger to fulfil the expectations and wishes of their customers.105Fallah Shayan, N., Mohabbati-Kalejahi, N., Alavi, S. & Zahed, M. A. Sustainable Development Goals (SDGs) as a Framework for Corporate Social Responsibility (CSR). Sustainability 14, 1222 (2022).
There are special initiatives that companies can join to actively combat hunger. One such initiative is ‘Restaurants against Hunger’, which was launched by the non-profit organization Action Against Hunger. Restaurants that join this initiative inform their guests about the global problem of hunger, often in the form of information material on their menus. Visitors have the option of adding a donation of €1 when paying. Some restaurants also offer special charity dishes. This international campaign leaves a positive impression on both staff and guests.107Aktion gegen den Hunger. Restaurants gegen den Hunger 2015, https://www.aktiongegendenhunger.de/aktuelles/restaurants-gegen-den-hunger-2015 (2015).
However, CSR measures can also lead to accusations of greenwashing. This is particularly the case when companies do not realize what they promise in their communications or when the actual systematic problems are not addressed. Particularly in the area of combating hunger by companies, it is often the case that the structural causes are not addressed, but rather short-term goals are pursued. The focus on food donations may help to alleviate hunger in the short term, but it does not change the underlying structural problems.108Caraher, M. & Furey, S. The corporate influence on food charity and aid: The “Hunger Industrial Complex” and the death of welfare. Frontiers in Public Health 10 (2022). https://doi.org:10.3389/fpubh.2022.950955
Political/Legal: International goals and standards, such as the SDG goals, can serve as guidance for companies and motivate them to actively participate in achieving these goals.105Fallah Shayan, N., Mohabbati-Kalejahi, N., Alavi, S. & Zahed, M. A. Sustainable Development Goals (SDGs) as a Framework for Corporate Social Responsibility (CSR). Sustainability 14, 1222 (2022). Political support also plays an important role in the promotion of partnerships and the networking of aid programmes. In addition, financial support from the public sector can strengthen activities to combat hunger.106Thapa Karki, S., Bennett, A. C. T. & Mishra, J. L. Reducing food waste and food insecurity in the UK: The architecture of surplus food distribution supply chain in addressing the sustainable development goals (Goal 2 and Goal 12.3) at a city level. Industrial Marketing Management 93, 563-577 (2021). https://doi.org:https://doi.org/10.1016/j.indmarman.2020.09.019
However, legal regulations also complicate the work of such programmes. Regulations on food safety and distribution make the process extremely complex. On the one hand, trade policy measures can hinder the import of food, which can exacerbate the availability of food, especially in times of crisis. Additionally, on the other hand, there is the inhibition that companies fear liability claims if health problems occur due to donated food.100Wahbeh, S., Anastasiadis, F., Sundarakani, B. & Manikas, I. Exploration of Food Security Challenges towards More Sustainable Food Production: A Systematic Literature Review of the Major Drivers and Policies. Foods 11, 3804 (2022).
Technological: There can be logistical challenges, especially in more rural and less developed regions. A lack of infrastructure can severely hamper the transport and storage of food.100Wahbeh, S., Anastasiadis, F., Sundarakani, B. & Manikas, I. Exploration of Food Security Challenges towards More Sustainable Food Production: A Systematic Literature Review of the Major Drivers and Policies. Foods 11, 3804 (2022). But even in urban areas, there is often a lack of a coordinated and legally structured supply chain, which leads to inefficiencies.106Thapa Karki, S., Bennett, A. C. T. & Mishra, J. L. Reducing food waste and food insecurity in the UK: The architecture of surplus food distribution supply chain in addressing the sustainable development goals (Goal 2 and Goal 12.3) at a city level. Industrial Marketing Management 93, 563-577 (2021). https://doi.org:https://doi.org/10.1016/j.indmarman.2020.09.019 These inefficiencies sometimes hinder the fight against hunger. In addition, the planning and continuous provision of food is difficult if it is dependent on donations.65Stauffer, J. M., Vanajakumari, M., Kumar, S. & Mangapora, T. Achieving equitable food security: How can food bank mobile pantries fill this humanitarian need. Production and Operations Management 31, 1802-1821 (2022). https://doi.org:https://doi.org/10.1111/poms.13663
References
- 1Statistisches Bundesamt. 735 Millionen Menschen weltweit haben nicht genug zu essen, https://www.destatis.de/DE/Themen/Laender-Regionen/Internationales/Thema/landwirtschaft-fischerei/Unterernaehrung.html#:~:text=735%20Millionen%20Menschen%20weltweit%20galten,unter%20dem%20Wert%20des%20Vorjahres. (2023).
- 2Food and Agriculture Organization of the United Nations. Hunger and food insecurity, https://www.fao.org/hunger/en/ (2023).
- 3Sanchez, P. A. & Swaminathan, M. S. Cutting World Hunger in Half. Science 307, 357-359 (2005). https://doi.org:doi:10.1126/science.1109057
- 4Östergren, K. et al. FUSIONS definitional framework for food waste. Full report. (2014).
- 5Lebersorger, S. & Schneider, F. Discussion on the methodology for determining food waste in household waste composition studies. Waste Management 31, 1924-1933 (2011).https://doi.org:https://doi.org/10.1016/j.wasman.2011.05.023
- 6Smil, V. Improving Efficiency and Reducing Waste in Our Food System. Environmental Sciences 1, 17-26 (2004). https://doi.org:10.1076/evms.1.1.17.23766
- 7Statistisches Bundesamt. Food Waste, https://www.destatis.de/EN/Themes/Society-Environment/Environment/_Graphic/_Interactive/food-waste.html (2024).
- 8Bundesministerium für wirtschaftliche Zusammenarbeit und Entwicklung.Agenda 2030: Die globalen Ziele für nachhaltige Entwicklung https://www.bmz.de/de/agenda-2030 (2023).
- 9The Global Goals. The 17 Goals, https://www.globalgoals.org/goals/ (n.d.).
- 10Food and Agriculture Organization of the United Nations, International Fund for Agricultural Development, unicef, World Food Programme & World Health Organization. The State of Food Security and Nutrition in the World. (2023).
- 11Grewal, D., Guha, A., Noble, S. M. & Bentley, K. The food production–consumption chain: Fighting food insecurity, loss, and waste with technology. Journal of the Academy of Marketing Science (2024). https://doi.org:10.1007/s11747-024-01040-x
- 12Rodrigues, V. S., Demir, E., Wang, X. & Sarkis, J. Measurement, mitigation and prevention of food waste in supply chains: An online shopping perspective. Industrial Marketing Management 93, 545-562 (2021). https://doi.org:https://doi.org/10.1016/j.indmarman.2020.09.020
- 13Food and Agriculture Organization of the United Nations. SDG Indicators Data Portal. Indicator 12.3.1 – Global Food Loss and Waste, https://www.fao.org/sustainable-development-goals-data-portal/data/indicators/1231-global-food-losses/en (n.d.).
- 14Food and Agriculture Organization of the United Nations. The State of Food and Agriculture. Moving forward on food loss and waste reduction. (2019).
- 15United Nations Environment Programme. Food Waste Index Report 2024. Think Eat Save: Tracking Progress to Halve Global Food Waste. (2024).
- 16United Nations Environment Programme. Food Waste Index 2021. (2021).
- 17Hoehn, D. et al. A critical review on food loss and waste quantification approaches: Is there a need to develop alternatives beyond the currently widespread pathways? Resources, Conservation and Recycling 188, 106671 (2023). https://doi.org:https://doi.org/10.1016/j.resconrec.2022.106671
- 18Food and Agriculture Organization of the United Nations. The State of Food and Agriculture. Innovation in family farming. (2014).
- 19van Herpen, E., van der Lans, I. A., Holthuysen, N., Nijenhuis-de Vries, M. & Quested, T. E. Comparing wasted apples and oranges: An assessment of methods to measure household food waste. Waste Management 88, 71-84 (2019). https://doi.org:https://doi.org/10.1016/j.wasman.2019.03.013
- 20Williams, H., Wikström, F., Otterbring, T., Löfgren, M. & Gustafsson, A. Reasons for household food waste with special attention to packaging. Journal of Cleaner Production 24, 141-148 (2012). https://doi.org:https://doi.org/10.1016/j.jclepro.2011.11.044
- 21Elimelech, E., Ayalon, O. & Ert, E. What gets measured gets managed: A new method of measuring household food waste. Waste Management 76, 68-81 (2018). https://doi.org:https://doi.org/10.1016/j.wasman.2018.03.031
- 22Langley, J. et al. Food for Thought? — A UK pilot study testing a methodology for compositional domestic food waste analysis. Waste Management & Research 28, 220-227 (2010). https://doi.org:10.1177/0734242×08095348
- 23Parizeau, K., von Massow, M. & Martin, R. Household-level dynamics of food waste production and related beliefs, attitudes, and behaviours in Guelph, Ontario. Waste Management 35, 207-217 (2015). https://doi.org:https://doi.org/10.1016/j.wasman.2014.09.019
- 24Ventour, L. & WRAP. The Food We Waste. (WRAP, 2008).
- 25Quested, T. E., Palmer, G., Moreno, L. C., McDermott, C. & Schumacher, K. Comparing diaries and waste compositional analysis for measuring food waste in the home. Journal of Cleaner Production 262, 121263 (2020). https://doi.org:https://doi.org/10.1016/j.jclepro.2020.121263
- 26Silvennoinen, K., Heikkilä, L., Katajajuuri, J.-M. & Reinikainen, A. Food waste volume and origin: Case studies in the Finnish food service sector. Waste Management 46, 140-145 (2015). https://doi.org:https://doi.org/10.1016/j.wasman.2015.09.010
- 27Global Hunger Index. Global Hunger Index Methodology, https://www.globalhungerindex.org/methodology.html(n.d.).
- 28von Grebmer, K. et al. 2023 – Global Hunger Index – The Power of Youth in Shaping Food Systems. (Welthungerhilfe, 2023).
- 29Food and Agriculture Organization of the United Nations. Voices of the Hungry. The Food Insecurity Experience Scale, https://www.fao.org/in-action/voices-of-the-hungry/fies/en/ (n.d.).
- 30Bernal, J., Fram, M. & Frongillo, E. The measurement of food insecurity among children: Review of literature and concept note. (2015).
- 31Food and Agriculture Organization of the United Nations. Food Insecurity Experience Scale (FIES),http://www.fao.org/in-action/voices-of-the-hungry/fies/en/ (2018).
- 32Integrated Food Security Phase Classification. IPC – Integrated Food Security Phase Classification, https://www.ipcinfo.org (n.d.).
- 33Food and Agriculture Organization of the United Nations. SDG Indicators Data Portal. Indicator 2.1.1 – Prevalence of undernourishment, https://www.fao.org/sustainable-development-goals-data-portal/data/indicators/2.1.1-prevalence-of-undernourishment/en (n.d.).
- 34Human Development Index. Human Development Index (HDI), https://hdr.undp.org/data-center/human-development-index#/indicies/HDI (n.d.).
- 35Pathinha Caldera C., De Laurentiis V., Sala S. Assessment of food waste prevention actions. (Publications Office of the European Union, 2019).
- 36Lehn, F., Goossens, Y. & Schmidt, T. Economic and environmental assessment of food waste reduction measures – Trialing a time-temperature indicator on salmon in HelloFresh meal boxes. Journal of Cleaner Production 392, 136183 (2023). https://doi.org:https://doi.org/10.1016/j.jclepro.2023.136183
- 37Gorgan, C., Chersan, I.-C., Dragomir, V. & Dumitru, M. Food Waste Prevention Solutions in the Annual Reports of European Companies. Amfiteatru Economic Journal 24 (2022). https://doi.org:10.24818/EA/2022/60/309
- 38Too Good To Go. Marketplace Surprise Bags, https://www.toogoodtogo.com/surplus-food-marketplace (n.d.).
- 39Economou, F. et al. The concept of food waste and food loss prevention and measuring tools. Waste Management & Research 42, 651-669 (2024). https://doi.org:10.1177/0734242×241237187
- 40The Kroger Co. 2023 Environmental, Social & Governance Report. (2023).
- 41Orzes, G. et al. United Nations Global Compact: Literature review and theory-based research agenda. Journal of Cleaner Production 177, 633-654 (2018). https://doi.org:https://doi.org/10.1016/j.jclepro.2017.12.230
- 42United Nations Global Compact. United Nations Global Compact, https://unglobalcompact.org (n.d.).
- 43Handayati, Y. & Widyanata, C. Effective food waste management model for the sustainable agricultural food supply chain. Scientific Reports 14, 10290 (2024). https://doi.org:10.1038/s41598-024-59482-w
- 44Europäische Kommission. Mitteilung der Kommission an das Europäische Parlament, den Rat, den Europäischen Wirtschafts- und Sozialausschuss und den Ausschuss der Regionen. Ein neuer Aktionsplan für die Kreislaufwirtschaft. Für ein sauberes und wettbewerbsfähigeres Europa, https://eur-lex.europa.eu/resource.html?uri=cellar:9903b325-6388-11ea-b735-01aa75ed71a1.0016.02/DOC_1&format=PDF (2020).
- 45Voegtlin, C. & Pless, N. Global Governance: CSR and the role of the UN Global Compact. Journal of Business Ethics 122, 179-191 (2014). https://doi.org:10.1007/s10551-014-2214-8
- 46Papargyropoulou, E., Lozano, R., K. Steinberger, J., Wright, N. & Ujang, Z. b. The food waste hierarchy as a framework for the management of food surplus and food waste. Journal of Cleaner Production 76, 106-115 (2014). https://doi.org:https://doi.org/10.1016/j.jclepro.2014.04.020
- 47NetSuite. Enterprise Resource Planning, https://www.netsuite.de/portal/de/products/erp.shtml (n.d.).
- 48Sensitech. The Ultimate Guide to Cold Chain Temperature Monitoring, https://www.sensitech.com/en/blog/blog-articles/blog-ultimate-guide-cold-chain-monitoring.html (n.d.).
- 49Moraes, N. V., Lermen, F. H. & Echeveste, M. E. S. A systematic literature review on food waste/loss prevention and minimization methods. Journal of Environmental Management 286, 112268 (2021). https://doi.org:https://doi.org/10.1016/j.jenvman.2021.112268
- 50Kor, Y. Y., Prabhu, J. & Esposito, M. How Large Food Retailers Can Help Solve the Food Waste Crisis. Harvard Business Review (2017).
- 51Cropin. Cropin, https://www.cropin.com (n.d.).
- 52Al-Obadi, M., Ayad, H., Pokharel, S. & Ayari, M. A. Perspectives on food waste management: Prevention and social innovations. Sustainable Production and Consumption 31, 190-208 (2022). https://doi.org:https://doi.org/10.1016/j.spc.2022.02.012
- 53Global Child Nutrition Foundation. GNCF, https://gcnf.org (n.d.).
- 54World Wildlife Fund. Food Waste Warriors. (2019).
- 55World Food Programme. World Food Programme, https://de.wfp.org (n.d.).
- 56The Global Food Banking Network. The Global Food Banking Network, https://www.foodbanking.org (n.d.).
- 57CSS. CSS Crop Nutrition Products & Pet Food Ingredients, https://www.calsafesoil.com (n.d.).
- 58The Composting Network. Composting Network, https://compostingnetwork.com (n.d.).
- 59Divert. divert, https://divertinc.com (n.d.).
- 60Van Ewijk, S. & Stegemann, J. A. Limitations of the waste hierarchy for achieving absolute reductions in material throughput. Journal of Cleaner Production 132, 122-128 (2016). https://doi.org:https://doi.org/10.1016/j.jclepro.2014.11.051
- 61Dhahri, S. & Omri, A. Foreign capital towards SDGs 1 & 2—Ending Poverty and hunger: The role of agricultural production. Structural Change and Economic Dynamics 53, 208-221 (2020). https://doi.org:https://doi.org/10.1016/j.strueco.2020.02.004
- 62World Food Programme. Who are we?, https://www.wfp.org/who-we-are (n.d.).
- 63Islam, M. R. Hunger Reduction in China: An Analysis of Contextual Factors. Asian Social Work and Policy Review 10, 295-310 (2016). https://doi.org:https://doi.org/10.1111/aswp.12098
- 64de Gilder, D., Schuyt, T. N. M. & Breedijk, M. Effects of an Employee Volunteering Program on the Work Force: The ABN-AMRO Case. Journal of Business Ethics 61, 143-152 (2005).
- 65Stauffer, J. M., Vanajakumari, M., Kumar, S. & Mangapora, T. Achieving equitable food security: How can food bank mobile pantries fill this humanitarian need. Production and Operations Management 31, 1802-1821 (2022). https://doi.org:https://doi.org/10.1111/poms.13663
- 66Bizikova, L. et al. A scoping review of the contributions of farmers’ organizations to smallholder agriculture. Nature Food 1, 620-630 (2020). https://doi.org:10.1038/s43016-020-00164-x
- 67Lin, S. & Cui, J. South-South cooperation and food security: Evidence from Chinese agricultural technology demonstration Center in Africa. China Economic Quarterly International 4, 1-12 (2024). https://doi.org:https://doi.org/10.1016/j.ceqi.2024.02.001
- 68Nakano, Y., Tsusaka, T. W., Aida, T. & Pede, V. O. Is farmer-to-farmer extension effective? The impact of training on technology adoption and rice farming productivity in Tanzania. World Development 105, 336-351 (2018). https://doi.org:https://doi.org/10.1016/j.worlddev.2017.12.013
- 69International Maize and Wheat Improvement Center. CIMMYT, https://www.cimmyt.org/about/ (n.d.).
- 70Papakonstantinou, A., Koutsoukos, M., Zoukidis, K. & Vergos, E. Vocational Training of Young Farmers: The Case of Students of the American Farm School Vocational Training Institute. Journal of Agricultural Science 14, 36 (2022). https://doi.org:10.5539/jas.v14n7p36
- 71Shamdasani, Y. Rural road infrastructure & agricultural production: Evidence from India. Journal of Development Economics 152, 102686 (2021). https://doi.org:https://doi.org/10.1016/j.jdeveco.2021.102686
- 72de Mattos, E. J. & Bagolin, I. P. Reducing Poverty and Food Insecurity in Rural Brazil: the Impact of the Zero Hunger Program. EuroChoices 16, 43-49 (2017). https://doi.org:https://doi.org/10.1111/1746-692X.12150
- 73Han, J.-W. et al. A comprehensive review of cold chain logistics for fresh agricultural products: Current status, challenges, and future trends. Trends in Food Science & Technology 109, 536-551 (2021). https://doi.org:https://doi.org/10.1016/j.tifs.2021.01.066
- 74Fokam, G., Tadadjeu, S., Kamguia, B. & Djeunankan, R. Does financial development contribute to the achievement of the “Zero Hunger” goal in Africa? African Development Review 35, 255-269 (2023). https://doi.org:https://doi.org/10.1111/1467-8268.12708
- 75Kirwan, B. E. & McMillan, M. Food Aid and Poverty. American Journal of Agricultural Economics 89, 1152-1160 (2007). https://doi.org:10.1111/j.1467-8276.2007.01076.x
- 76DeLonge, M. S., Miles, A. & Carlisle, L. Investing in the transition to sustainable agriculture. Environmental Science & Policy 55, 266-273 (2016). https://doi.org:https://doi.org/10.1016/j.envsci.2015.09.013
- 77Moon, I., Jeong, Y. J. & Saha, S. Investment and coordination decisions in a supply chain of fresh agricultural products. Operational Research 20, 2307-2331 (2020). https://doi.org:10.1007/s12351-018-0411-4
- 78Sorooshian, S., Qi, L. C. & Li Fei, L. Characterization of ISO 14001 implementation. Environmental Quality Management 27, 97-105 (2018). https://doi.org:https://doi.org/10.1002/tqem.21532
- 79Umwelt Gutachter Ausschuss EMAS – Mehrwert schaffen, Risiken vermeiden. Die Stärken von EMAS gegenüber der ISO 14001. (2018).
- 80Umwelt Gutachter Ausschuss Was ist EMAS?, https://www.emas.de/fileadmin/user_upload/4-pub/Flyer_Was-ist-EMAS.pdf (2023).
- 81Lean Management – Repräsentative Studie. Personal 45, 484-484 (1993).
- 82Utama, D. M. & Abirfatin, M. Sustainable Lean Six-sigma: A new framework for improve sustainable manufacturing performance. Cleaner Engineering and Technology 17, 100700 (2023). https://doi.org:https://doi.org/10.1016/j.clet.2023.100700
- 83Widiwati, I. T. B., Liman, S. D. & Nurprihatin, F. The implementation of Lean Six Sigma approach to minimize waste at a food manufacturing industry. Journal of Engineering Research (2024). https://doi.org:https://doi.org/10.1016/j.jer.2024.01.022
- 84Wang, C.-N., Nguyen, T.-D., Thi Nguyen, T.-T. & Do, N.-H. The performance analysis using Six Sigma DMAIC and integrated MCDM approach: A case study for microlens process in Vietnam. Journal of Engineering Research(2024). https://doi.org:https://doi.org/10.1016/j.jer.2024.04.013
- 85Nandakumar, N., Saleeshya, P. G. & Harikumar, P. Bottleneck Identification And Process Improvement By Lean Six Sigma DMAIC Methodology. Materials Today: Proceedings 24, 1217-1224 (2020). https://doi.org:https://doi.org/10.1016/j.matpr.2020.04.436
- 86Fercoq, A., Lamouri, S., Carbone, V., Lelièvre, A. & Lemieux, A. A. Combining lean and green in manufacturing: a model of waste management. IFAC Proceedings Volumes 46, 117-122 (2013). https://doi.org:https://doi.org/10.3182/20130619-3-RU-3018.00164
- 87Global Reporting Initiative. Continuos improvement, https://www.globalreporting.org/standards/ (n.d.).
- 88GRI Standards. GRI 306: Waste 2020. Report No. 978-90-8866-132-7, (2024).
- 89Corporate Knights. About Us, https://www.corporateknights.com/about-us/ (n.d.).
- 90McCarthy, S. The Global 100 list: How the world’s most sustainable corporations are driving the green transition. (2024).
- 91Hahn, R. & Lülfs, R. Legitimizing Negative Aspects in GRI-Oriented Sustainability Reporting: A Qualitative Analysis of Corporate Disclosure Strategies. Journal of Business Ethics 123, 401-420 (2014). https://doi.org:10.1007/s10551-013-1801-4
- 92McCormick & Co. Purpose-Led Performance. 2023 Progess Report. (2023).
- 93Sakaguchi, L., Pak, N. & Potts, M. D. Tackling the issue of food waste in restaurants: Options for measurement method, reduction and behavioral change. Journal of Cleaner Production 180, 430-436 (2018). https://doi.org:https://doi.org/10.1016/j.jclepro.2017.12.136
- 94Thyberg, K. L. & Tonjes, D. J. Drivers of food waste and their implications for sustainable policy development. Resources, Conservation and Recycling 106, 110-123 (2016). https://doi.org:https://doi.org/10.1016/j.resconrec.2015.11.016
- 95Filimonau, V. & Gherbin, A. An exploratory study of food waste management practices in the UK grocery retail sector. Journal of Cleaner Production 167, 1184-1194 (2017). https://doi.org:https://doi.org/10.1016/j.jclepro.2017.07.229
- 96Lidl. Lidl gibt Obst und Gemüse eine zweite Chance. Mit der deutschlandweiten Einführung der Rettertüte geht das Unternehmen im Rahmen der Lidl-Lebensmittelrettung einen weiteren wichtigen Schritt, https://unternehmen.lidl.de/pressreleases/2022/220801_rettertuete (2022).
- 97Verbraucherzentrale. Essen außer Haus: Was in Töpfen und auf den Tellern bleibt, https://www.verbraucherzentrale.de/wissen/lebensmittel/auswaehlen-zubereiten-aufbewahren/essen-ausser-haus-was-in-toepfen-und-auf-den-tellern-bleibt-59537 (2024).
- 98Alexander, C. & Smaje, C. Surplus retail food redistribution: An analysis of a third sector model. Resources, Conservation and Recycling 52, 1290-1298 (2008). https://doi.org:https://doi.org/10.1016/j.resconrec.2008.07.009
- 99Canali, M. et al. Food Waste Drivers in Europe, from Identification to Possible Interventions. Sustainability 9, 37 (2017).
- 100Wahbeh, S., Anastasiadis, F., Sundarakani, B. & Manikas, I. Exploration of Food Security Challenges towards More Sustainable Food Production: A Systematic Literature Review of the Major Drivers and Policies. Foods 11, 3804 (2022).
- 101Annosi, M. C., Brunetta, F., Bimbo, F. & Kostoula, M. Digitalization within food supply chains to prevent food waste. Drivers, barriers and collaboration practices. Industrial Marketing Management 93, 208-220 (2021). https://doi.org:https://doi.org/10.1016/j.indmarman.2021.01.005
- 102Stancu, V., Haugaard, P. & Lähteenmäki, L. Determinants of consumer food waste behaviour: Two routes to food waste. Appetite 96, 7-17 (2016). https://doi.org:https://doi.org/10.1016/j.appet.2015.08.025
- 103Filimonau, V., Todorova, E., Mzembe, A., Sauer, L. & Yankholmes, A. A comparative study of food waste management in full service restaurants of the United Kingdom and the Netherlands. Journal of Cleaner Production 258, 120775 (2020). https://doi.org:https://doi.org/10.1016/j.jclepro.2020.120775
- 104Etepetete. etepetete, https://etepetete-bio.de (n.d.).
- 105Fallah Shayan, N., Mohabbati-Kalejahi, N., Alavi, S. & Zahed, M. A. Sustainable Development Goals (SDGs) as a Framework for Corporate Social Responsibility (CSR). Sustainability 14, 1222 (2022).
- 106Thapa Karki, S., Bennett, A. C. T. & Mishra, J. L. Reducing food waste and food insecurity in the UK: The architecture of surplus food distribution supply chain in addressing the sustainable development goals (Goal 2 and Goal 12.3) at a city level. Industrial Marketing Management 93, 563-577 (2021). https://doi.org:https://doi.org/10.1016/j.indmarman.2020.09.019
- 107Aktion gegen den Hunger. Restaurants gegen den Hunger 2015, https://www.aktiongegendenhunger.de/aktuelles/restaurants-gegen-den-hunger-2015 (2015).
- 108Caraher, M. & Furey, S. The corporate influence on food charity and aid: The “Hunger Industrial Complex” and the death of welfare. Frontiers in Public Health 10 (2022). https://doi.org:10.3389/fpubh.2022.950955