Authors: Maria Camila Amador Sanabria, Benedict Maximilian Wongsargo
Edited by: –
Last updated: May 17, 2026
Executive summary
Electric passenger vehicles (EVs) have moved from early prototypes to a mainstream technology as battery performance, power electronics, and charging infrastructure have improved. Today’s EVs rely primarily on lithium-ion batteries, while sodium-ion batteries are emerging as a lower-cost option for specific use cases and vehicle segments.
For organizations, the key financial lens is total cost of ownership (TCO), which combines purchase price, energy, maintenance, depreciation, and utilization. Although batteries increase upfront costs, lower operating and maintenance expenses can offset the premium over the vehicle’s life, especially for high-mileage use. Because results vary by electricity and fuel prices, incentives, and duty cycles, organizations typically need scenario-based comparisons rather than a single estimate.
Ecological performance depends on life cycle impacts, not only tailpipe emissions. Battery and vehicle manufacturing create upstream impacts tied to mining, materials processing, and the electricity used in production. As grids decarbonize and recycling improves, life cycle greenhouse gas emissions and other pollutants per kilometer generally decline, strengthening EVs’ environmental advantage.
Social outcomes include improved local air quality and potential public health benefits, as well as employment growth in manufacturing, charging infrastructure, and battery recycling. At the same time, organizations should address material sourcing risks and safety issues such as reduced vehicle audibility at low speeds, which regulators mitigate through mandatory acoustic alert systems.
Policy and regulation strongly shape market adoption and operational feasibility. Incentives, emissions standards, charging requirements, and emerging battery rules (such as carbon footprint disclosure and battery passports) influence procurement and supply-chain decisions. Organizations can maximize benefits by aligning fleet electrification plans, charging strategy, responsible sourcing requirements, and sustainability reporting with local regulations and grid conditions.
1 Description and history
Electric vehicles and battery technology are inherently inseparable topics. In 1800, Alesandro Volta was able to store electrical energy chemically, and in 1831 Michael Faraday outlined the principles of electromagnetic induction, which led to electric motors and generators that could be used in electric cars. In 1861, Antonio Pacinotti invented the direct current (DC) motor and in 1881, Mr. Trouvé built a tricycle (the first electric vehicle) powered by a lead battery. Around the year 1893, six types of electric cars were on display at a world exhibition in Chicago. By 1897, there were 15 such taxis in London and 13 in New York. By 1912, there were around 30,000 electric vehicles in the USA. From then on, limitations in battery charging became apparent.1Høyer, K. G. The history of alternative fuels in transportation: The case of electric and hybrid cars. Utilities Policy 16, 63-71 (2008). https://doi.org/10.1016/j.jup.2007.11.001
Then came the war, and the Internal Combustion Engine (ICE) entered the war effort, increasing its production exponentially, as did the introduction of mass production of ICE cars. In 1929, with the stock market crash and the international economic depression, many electric vehicle companies went bankrupt. Because of the Second World War and a gasoline shortage some incentives were established to develop some electric vehicles such as tax exemption, with this for example, Germany during the war had 30,000 EVs for postal service, same number for Great Britain for electric van milk and bread deliveries.1Høyer, K. G. The history of alternative fuels in transportation: The case of electric and hybrid cars. Utilities Policy 16, 63-71 (2008). https://doi.org/10.1016/j.jup.2007.11.001
Rachel Carson’s Silent Spring (1963) sparked debate on air pollution, identifying carbon monoxide from ICE as a key concern. In 1972, the Club of Rome’s book The Limits to Growth warned about non-renewable resources depletion. The 1973 oil crisis (the oil embargo, the ban on cars and the debate on nuclear power) prompted interest in alternative energy sources, though insufficient to drive EV production.1Høyer, K. G. The history of alternative fuels in transportation: The case of electric and hybrid cars. Utilities Policy 16, 63-71 (2008). https://doi.org/10.1016/j.jup.2007.11.001 Meanwhile, Japanese government investment in EV research during this period positioned its manufacturers to dominate the market by the 1990s.2Iulia, V. & Loránd, S. A Brief History of Electric Vehicles. Journal of Computer Science & Control Systems 15(2022).
Today, the current global scenario poses challenges in terms of environmental pollution, limited resources and rising fuel prices, so there is renewed interest in electric vehicles (EVs) powered by renewable energy, with the proliferation of charging points around the world and improvements in batteries being the main factors driving electric vehicles.2Iulia, V. & Loránd, S. A Brief History of Electric Vehicles. Journal of Computer Science & Control Systems 15(2022). EVs are highly efficient and primarily consist of an AC motor driven by a storage system.3Kumar, M. S. & Revankar, S. T. Development scheme and key technology of an electric vehicle: An overview. Renewable and Sustainable Energy Reviews. 70, 1266–1285 (2017) https://doi.org/10.1016/j.rser.2016.12.027 The main reason for the high efficiency of EVs is the use of AC permanent magnet synchronous or induction motors controlled by power inverters, which provide better torque-speed characteristics, higher output power to size ratio, faster dynamic response, and quieter operation.4Kumar, M. S. & Revankar, S. T. Development scheme and key technology of an electric vehicle: An overview. Renewable and Sustainable Energy Reviews 70, 1266-1285 (2017). https://doi.org/10.1016/j.rser.2016.12.027
In terms of energy storage, there are various energy systems that can store energy, such as batteries, supercapacitors, fuel cells (FC), hydraulic accumulators (HACCs) and hydrogen storage. When it comes to fuel cells, proton exchange membrane cells (PEMFCs), are the most promising for use in EVs due to their fast response, low temperature operation and long life. Focusing on batteries, there are currently three types available in the transport market: lead acid, nickel, and lithium based. The most cost effective option is the lithium-ion battery as it has a high specific energy (up to 250 Wh/kg), high power density (between 0.5 and 2 kW/kg), high energy efficiency (90-95% for the battery cell and 60-77% for the pack-to-wheel distention)5Ngoy, K. R. et al. Lithium-ion batteries and the future of sustainable energy: A comprehensive review. Renewable and Sustainable Energy Reviews 223, 115971 (2025). https://doi.org/10.1016/j.rser.2025.115971, low self-discharge, long life and moderate cost.5Li, Z., Khajepour, A. & Song, J. A comprehensive review of the key technologies for pure electric vehicles. Energy 182, 824-839 (2019). https://doi.org/10.1016/j.energy.2019.06.077
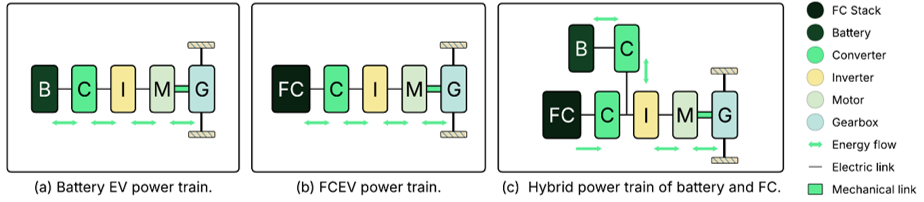
Figure 1: Power train configuration of single source (a) Powertrain of BEV (b) Powertrain of FCEV. Power train multi-source configuration (c) Hybrid power train of battery and FC.5Li, Z., Khajepour, A. & Song, J. A comprehensive review of the key technologies for pure electric vehicles. Energy 182, 824-839 (2019). https://doi.org/10.1016/j.energy.2019.06.077
Today, electric vehicle batteries mainly use lithium-ion cathode chemistries7Cheng, A. L., Fuchs, E. R. H., Karplus, V. J. & Michalek, J. J. Electric vehicle battery chemistry affects supply chain disruption vulnerabilities. Nat. Commun. 15, 2143 (2024). https://doi.org/10.1038/s41467-024-46418-1, with NMC (lithium nickel manganese cobalt oxide) holding a 60% market share, followed by LFP (lithium iron phosphate) at nearly 30% and NCA (lithium nickel cobalt aluminum oxide) at approximately 8%.6International Energy Agency. Trends in batteries. in Global EV Outlook 2023 (IEA, 2023). https://www.iea.org/reports/global-ev-outlook-2023/trends-in-batteries
Beyond lithium-ion, sodium-ion (Na-ion) batteries represent the most promising emerging chemistry, offering lower production costs and complete independence from critical minerals, though at the expense of reduced energy density (75–160 Wh/kg versus 120–260 Wh/kg for Li-ion). Led primarily by Chinese manufacturers such as CATL and BYD, Na-ion technology has rapidly advanced and is beginning to reach commercial deployment, positioning itself as a viable option for urban EVs and lower-cost market segments.6International Energy Agency. Trends in batteries. in Global EV Outlook 2023 (IEA, 2023). https://www.iea.org/reports/global-ev-outlook-2023/trends-in-batteries
The primary lithium-ion cathode chemistries depend on varying amounts of four primary critical minerals: lithium, nickel, cobalt, and manganese, as identified in studies of mineral criticality for battery cathode materials. Discussion of other minerals that may be deemed as critical or could become critical, including phosphorus, aluminum, and iron, as well as the criticality of other battery chemistries under development, is provided in Supplementary Text S.7Cheng, A. L., Fuchs, E. R. H., Karplus, V. J. & Michalek, J. J. Electric vehicle battery chemistry affects supply chain disruption vulnerabilities. Nat. Commun. 15, 2143 (2024). https://doi.org/10.1038/s41467-024-46418-1
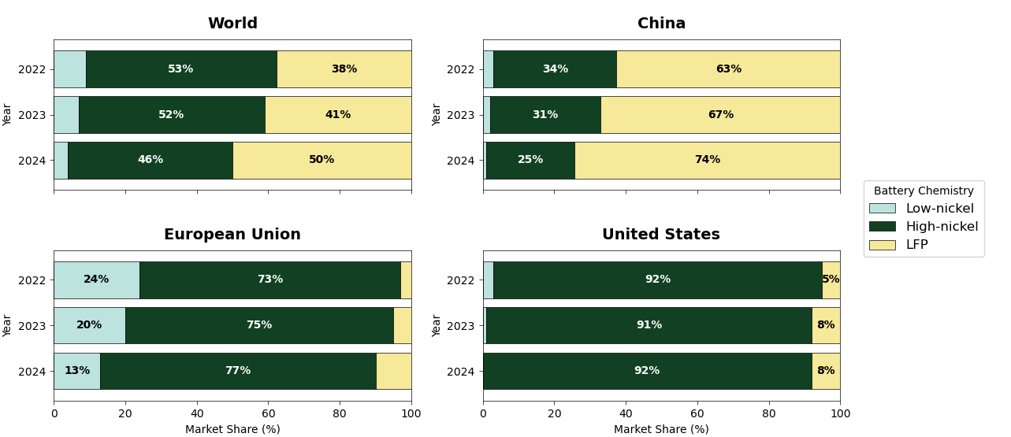
Figure 2: Market share of EV battery chemistries by region (2022-2024)6International Energy Agency. Trends in batteries. in Global EV Outlook 2023 (IEA, 2023). https://www.iea.org/reports/global-ev-outlook-2023/trends-in-batteries
2 Economic performance
This section compares ICE and EVs in terms of Total Cost Ownership (TCO), which can be related to environmental factors, societal factors, and additional interests such as purchase price, running costs, performance, etc. This article discusses the first two factors later.8Liu, Z. et al. Comparing total cost of ownership of battery electric vehicles and internal combustion engine vehicles. Energy Policy 158, 112564 (2021). https://doi.org/10.1016/j.enpol.2021.112564
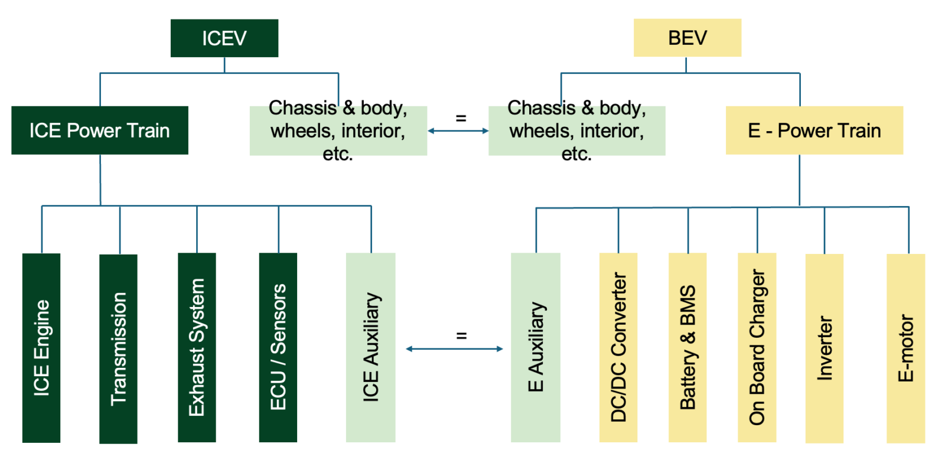
Figure 3: Schematic of components of ICE and BEVs.8Liu, Z. et al. Comparing total cost of ownership of battery electric vehicles and internal combustion engine vehicles. Energy Policy 158, 112564 (2021). https://doi.org/10.1016/j.enpol.2021.112564
TCO includes the purchase cost of the vehicle, and all the operating costs associated with its ownership. The correlation between engine cost and engine power for an ICEV is on average $21.3/kW, while the inverter cost is around $3.4/kW, but the battery increases the final price of the EVs, figure 4 shows the cost breakdown by component for ICE and BEV of 1750 Kg.
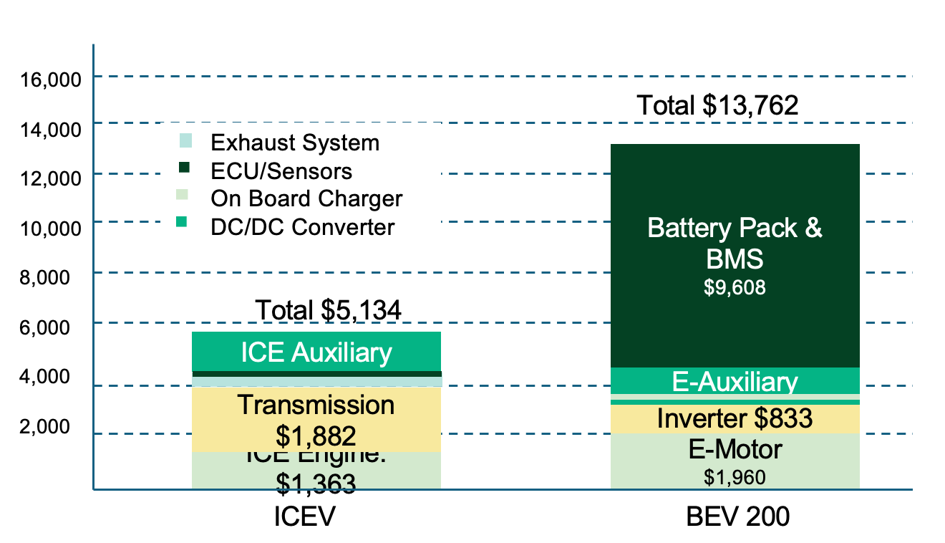
Figure 4: Powertrain cost breakdown by components of 1750 kg vs BEV200.8Liu, Z. et al. Comparing total cost of ownership of battery electric vehicles and internal combustion engine vehicles. Energy Policy 158, 112564 (2021). https://doi.org/10.1016/j.enpol.2021.112564
Despite the higher price of BEVs, they have some attractive features such as faster and smoother acceleration, zero emissions, quieter vehicles, and higher pack-to-wheel efficiency. In addition, the higher purchase price of a BEV can be mitigated and offset over the lifetime of the vehicle through savings in lower energy and maintenance costs. According to 8Liu, Z. et al. Comparing total cost of ownership of battery electric vehicles and internal combustion engine vehicles. Energy Policy 158, 112564 (2021). https://doi.org/10.1016/j.enpol.2021.112564, the cost parity of owning a BEV200 is reached in 6.8-7.7 years, but this is highly sensitive to the fluctuating market of gasoline/electricity price. Table 1 shows the potential of electric vehicles once the infrastructure is in place.8Liu, Z. et al. Comparing total cost of ownership of battery electric vehicles and internal combustion engine vehicles. Energy Policy 158, 112564 (2021). https://doi.org/10.1016/j.enpol.2021.112564
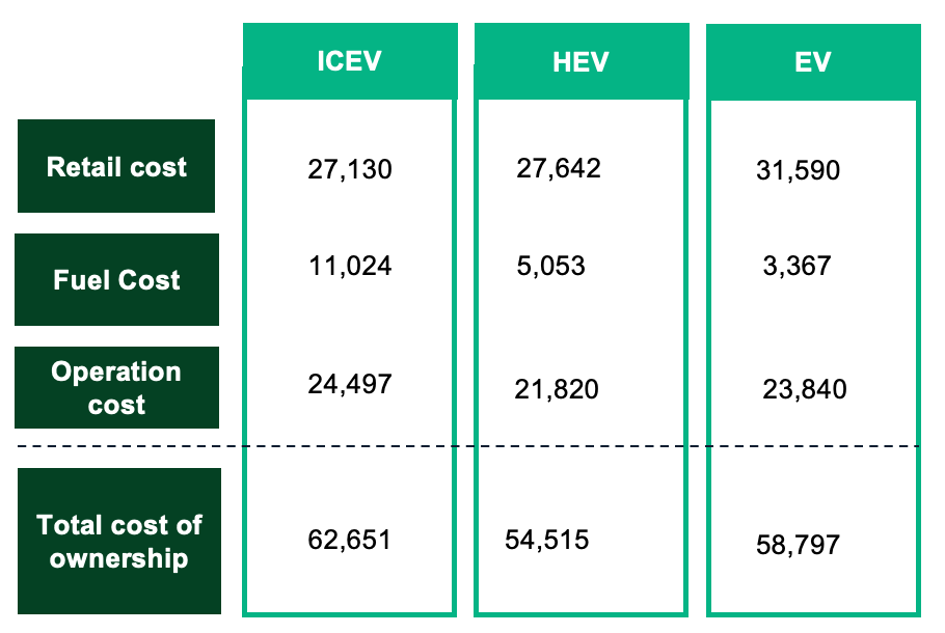
Table 1: Total cost ownership in 2015($), based on vehicle lifetime 10.6 years and annual mileage of 11,300.16Mitropoulos, L. K., Prevedouros, P. D. & Kopelias, P. Total cost of ownership and externalities of conventional, hybrid and electric vehicle. Transportation Research Procedia 24, 267-274 (2017). https://doi.org/10.1016/j.trpro.2017.05.117
In addition to the costs above, depreciation plays a factor in the TCO of electric vehicles against ICE vehicles. Based on the data from webuyanycar, a UK-based used car buying service, EV’s tend to lose approximately 40% just after 1 year and 50% after 2 years. While a comparable ICE vehicle loses about 35% after 1 year and 40% after 2 years.9We Buy Any Car. Electric car depreciation — An in-depth guide. webuyanycar.com https://www.webuyanycar.com/electric-cars/ev-depreciation/ (n.d.). The depreciation differences gets smaller the longer the car is owned, however it is an important factor to consider especially on vehicle leasing. This of course will vary from markets-to-markets and markets with lower fuel prices and higher electricity cost will shift the TCO and depreciation in favor of ICE vehicles.10Nickel Institute. Total cost of ownership (TCO) for electric vehicles (EV) vs internal combustion engine vehicles (ICE). Nickel Institute https://nickelinstitute.org/en/nickel-applications/nickel-in-batteries/total-cost-of-ownership-tco-for-electric-vehicles-ev-vs-internal-combustion-engine-vehicles-ice/ (2021).
Many factors influence an EV’s cost. The Tornado diagram below shows the sensitivity each factors and its effect on the levelized cost of driving (LCOD) based on an Electric SUV and 15 years of usage.11Burnham, A. et al. Comprehensive total cost of ownership quantification for vehicles with different size classes and powertrains. Argonne National Laboratory Technical Report ANL/ESD-21/4. https://publications.anl.gov/anlpubs/2021/05/167399.pdf (2021).
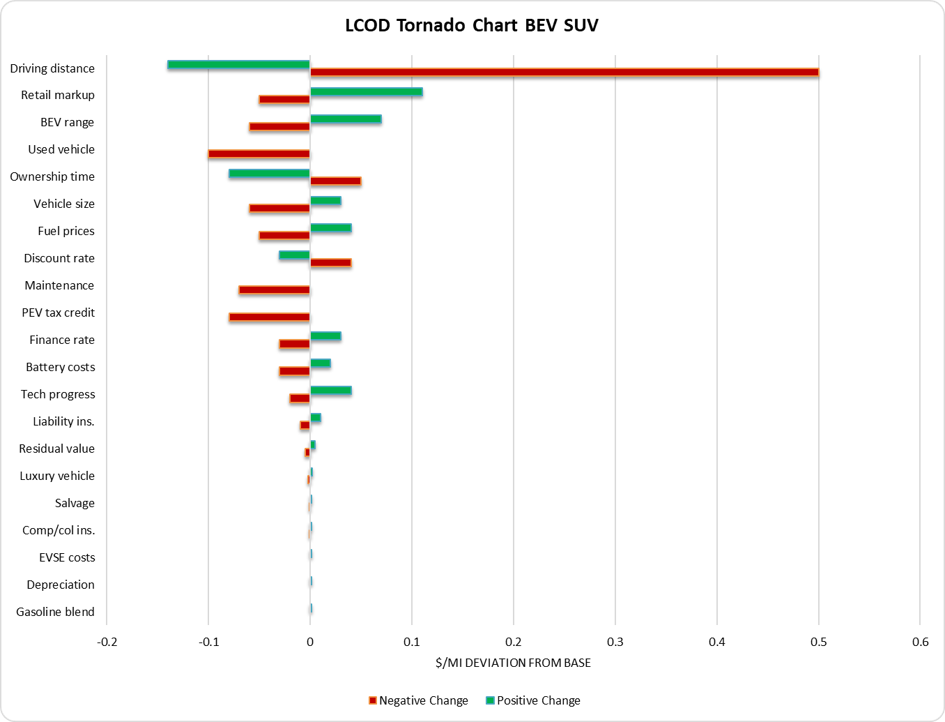
Figure 5: Tornado diagram of price sensitivity of factors affecting TCO of an EV.11Burnham, A. et al. Comprehensive total cost of ownership quantification for vehicles with different size classes and powertrains. Argonne National Laboratory Technical Report ANL/ESD-21/4. https://publications.anl.gov/anlpubs/2021/05/167399.pdf (2021).
We can see from the diagram above, that the colors of driving distance, ownership time, and discount rates are reversed as costs are greatly reduced over great distances. We can see that driving distance heavily sways the TCO of an EV as the initial cost of an EV is much higher than that of an ICEV and ownership time is closely related as depreciation cost are much greater in the first few years compared to ICE vehicles.11Burnham, A. et al. Comprehensive total cost of ownership quantification for vehicles with different size classes and powertrains. Argonne National Laboratory Technical Report ANL/ESD-21/4. https://publications.anl.gov/anlpubs/2021/05/167399.pdf (2021).
Notably, batteries are the most expensive component of EVs, but in the last 10 years the price of lithium-ion batteries has fallen by more than 80% (from $1000/kWh to $156/kWh at the end of 2019). Recent trends indicate that the components of an EV powertrain will increase their power density, reduce losses, and lower costs. The global adoption rate of EVs has increased rapidly: at the end of 2019, EV sales totaled more than 2.2 million vehicles. By the end of 2019, there were about 700,000 medium – heavy duty electric commercial vehicles (such as transit buses, school buses) in use in the whole world.12Muratori, M. et al. The rise of electric vehicles—2020 status and future expectations. Progress in Energy 3, 022002 (2021). https://doi.org/10.1088/2516-1083/abe0ad
An example of energy efficiency range for medium and heavy-duty EVs is between 0.5–2.5 kWh/km, assuming a daily operating range of 80–322 km, this requires a battery size between 40 kWh and 640 kWh. This presents a significant challenge to the design, development, and manufacture of systems capable of meeting these operational requirements.12Muratori, M. et al. The rise of electric vehicles—2020 status and future expectations. Progress in Energy 3, 022002 (2021). https://doi.org/10.1088/2516-1083/abe0ad
The electric vehicles sector is largely dependent on the political strategy to promote their use and have available more investment in renewable energy and electrified transport. In 2021, there was a 77% increase in investment in the sector, with $250 billion spent on EVs and infrastructure, but most of this global investment in the electrified transport sector was concentrated in a few countries: China, the United States, Germany, the United Kingdom, and France. Government incentives are quite important to stimulate the purchase of EVs, as are falling battery prices and further research into improving the electric vehicle supply chain.13Ajanovic, A. The impact of COVID‐19 on the market prospects of electric passenger cars. Wiley interdisciplinary reviews. Energy and environment 11, e451-n/a (2022). https://doi.org/10.1002/wene.451
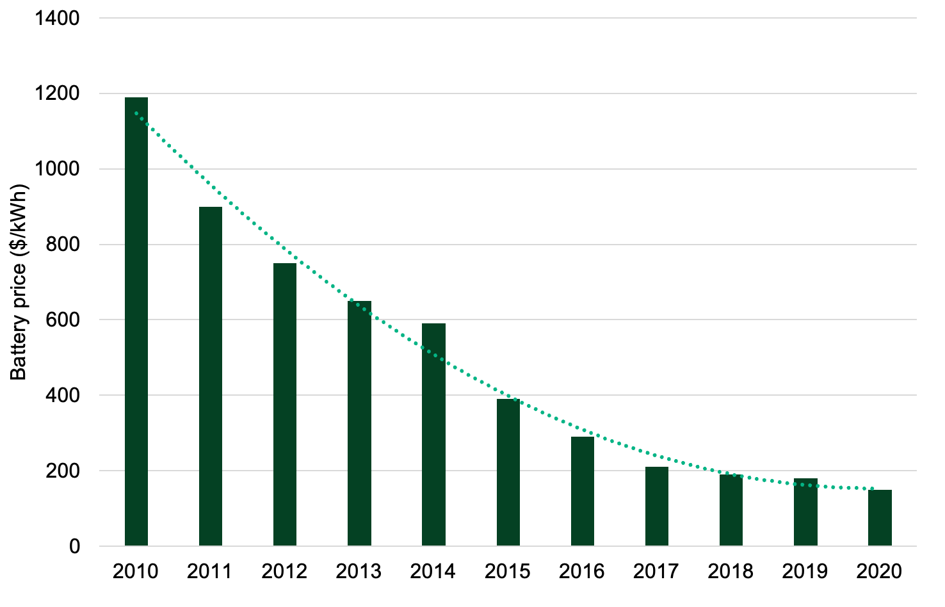
Figure 6: Battery pack price evolution 2010-2020.13Ajanovic, A. The impact of COVID‐19 on the market prospects of electric passenger cars. Wiley interdisciplinary reviews. Energy and environment 11, e451-n/a (2022). https://doi.org/10.1002/wene.451
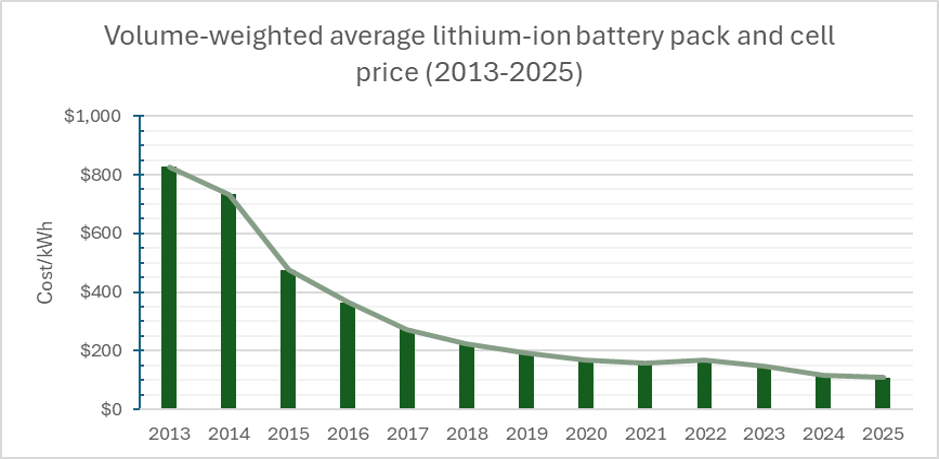
Figure 7: An updated line chart for battery prices from 2013–2025.17BloombergNEF. Lithium-ion battery pack prices fall to $108 per kilowatt-hour, despite rising metal prices. BloombergNEF https://about.bnef.com/insights/clean-transport/lithium-ion-battery-pack-prices-fall-to-108-per-kilowatt-hour-despite-rising-metal-prices-bloombergnef/ (9 December 2025).
The graph above takes the data from a report by BloombergNEF and shows the current trend in battery prices from 2013-2025. The prices have been price adjusted to remove the effect of inflation into the comparison which is why the values are slightly different from figure 6 which was updated as of 2020. As shown, the price drop starts to plateau as we are approaching our current limit of development.
The number of EVs models has increased by 40% compared to 2019, and the average battery cost has decreased by 13% compared to previous years, as shown in figure 4, resulting in a more competitive TCO. Figure 6 states that demand for EVs has increased over the years.13Ajanovic, A. The impact of COVID‐19 on the market prospects of electric passenger cars. Wiley interdisciplinary reviews. Energy and environment 11, e451-n/a (2022). https://doi.org/10.1002/wene.451
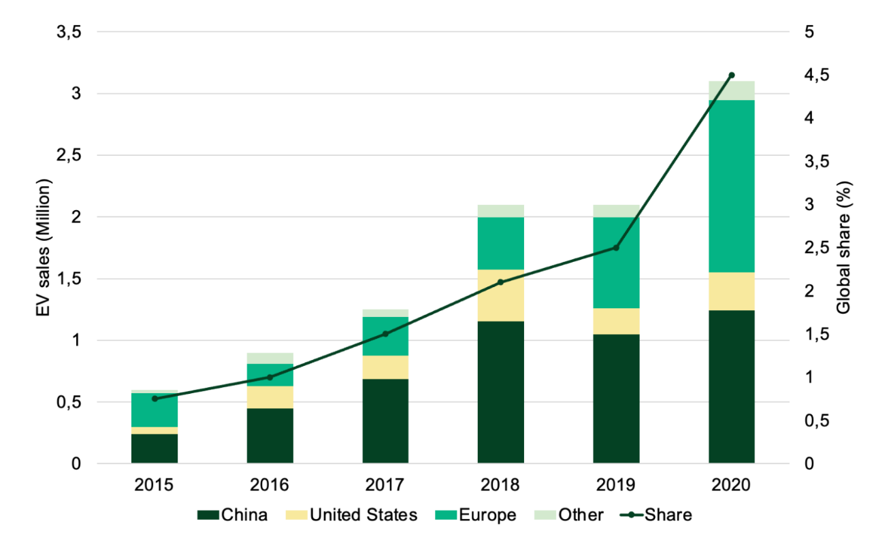
Figure 8: Global electrical vehicles sales 2015-2020.13Ajanovic, A. The impact of COVID‐19 on the market prospects of electric passenger cars. Wiley interdisciplinary reviews. Energy and environment 11, e451-n/a (2022). https://doi.org/10.1002/wene.451
3 Ecological performance
Table 2 compares ICE, HEV and EVs in terms of pollutant components, the ICE emits the most air pollutants, but Sulphur oxides and particle matter are higher for the EV than for any other vehicles due to the use of raw materials to produce electricity, these could lead to an increase in human toxicity level from the use of metals, chemicals and energy in the production of powertrains and high-voltage batteries.14Verma, S., Dwivedi, G. & Verma, P. Life cycle assessment of electric vehicles in comparison to combustion engine vehicles: A review. Materials Today: Proceedings 49, 217-222 (2022). https://doi.org/10.1016/j.matpr.2021.01.666 However, outcomes depend heavily on the energy mix of the country. Using the EU grid mix in 2021 as an example, the total GHG emissions reduction from an EV is between 63–76%; however this would be reduced even further to around 84-92% if the grid mix is 100% renewable. This kind of reduction in GHG emissions can be observed with countries such as the UK who has recently become 100% renewable.15O’Connell, A., Pavlenko, N., Bieker, G. & Searle, S. A comparison of the life-cycle greenhouse gas emissions of European heavy-duty vehicles and fuels. International Council on Clean Transportation (ICCT) White Paper https://theicct.org/wp-content/uploads/2023/02/Lifecycle-assessment-trucks-and-buses-emissions-Europe.pdf (February 2023).
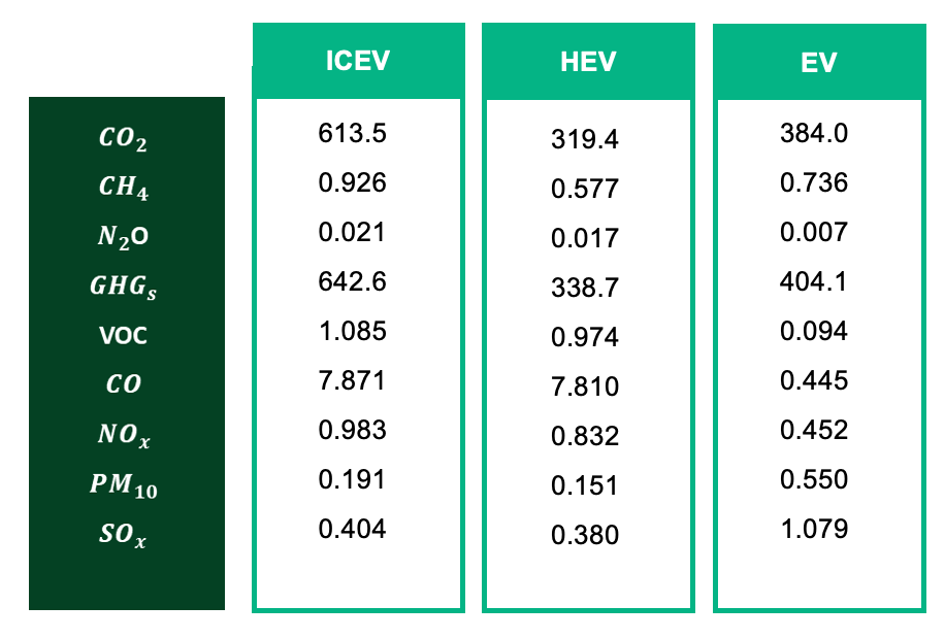
Table 2: Total emission per vehicle type in grams per mile: Carbon dioxide (CO₂), methane (CH4), nitrous oxide(N2O), greenhouse gas (GHG), volatile organic compound (VOC), carbon monoxide (CO), nitrogen oxides (NOx), particle matter with diameter less than 10 µm (PM10), sulphur oxides (SOx).16Mitropoulos, L. K., Prevedouros, P. D. & Kopelias, P. Total cost of ownership and externalities of conventional, hybrid and electric vehicle. Transportation Research Procedia 24, 267-274 (2017). https://doi.org/10.1016/j.trpro.2017.05.117
One important factor is the reduced cost of the alternative fuel vehicles and hydrogen which have been implemented for EVs to significantly reduce the external cost. However, this lower external cost is offset by the high purchase price of EVs, but it is still a promising technology and it is expected to increase market penetration.16Mitropoulos, L. K., Prevedouros, P. D. & Kopelias, P. Total cost of ownership and externalities of conventional, hybrid and electric vehicle. Transportation Research Procedia 24, 267-274 (2017). https://doi.org/10.1016/j.trpro.2017.05.117
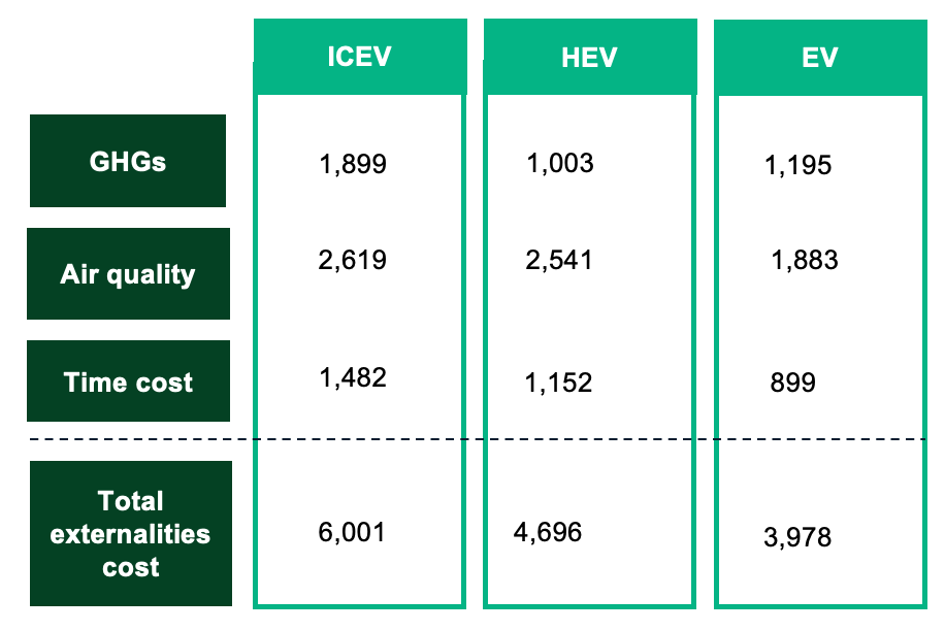
Table 3: Externalities cost in 2015($), based on vehicle lifetime 10.6 years and annual mileage of 11,300.16Mitropoulos, L. K., Prevedouros, P. D. & Kopelias, P. Total cost of ownership and externalities of conventional, hybrid and electric vehicle. Transportation Research Procedia 24, 267-274 (2017). https://doi.org/10.1016/j.trpro.2017.05.117
To analyze the automotive supply chain, it can be divided into three main parts: Reverse Supply Chain, Forward Supply Chain, and Energy Supply Chain. First-tier suppliers produce the parts and components that are assembled into final vehicles at OEM production sites. The final product is then delivered to the customer or export markets by dealers. Electricity for production and use of electrified vehicles is supplied according to the local energy mix. Fuel supply consists of the well-to-tank stage which covers the supply from crude oil exploration to fuel distribution, and the tank-to-wheel stage, which refers to the internal use of fuel by the powertrain. Finally, the end-of-life vehicles are delivered to the scrapyards where they are dismantled, and their parts are either recycled or disposed of. Figure 9 shows the process involved in the manufacture of both conventional cars and electric vehicles.17Günther, H. O., Kannegiesser, M. & Autenrieb, N. The role of electric vehicles for supply chain sustainability in the automotive industry. Journal of Cleaner Production 90, 220-233 (2015). https://doi.org/10.1016/j.jclepro.2014.11.058
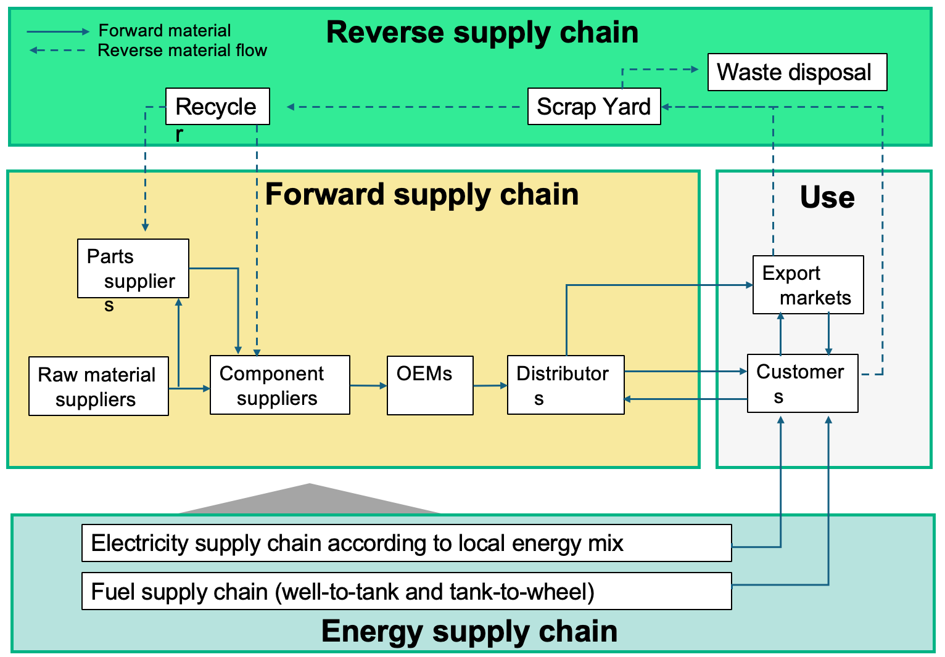
Figure 9: Structure of the automotive industry supply chain.17Günther, H. O., Kannegiesser, M. & Autenrieb, N. The role of electric vehicles for supply chain sustainability in the automotive industry. Journal of Cleaner Production 90, 220-233 (2015). https://doi.org/10.1016/j.jclepro.2014.11.058
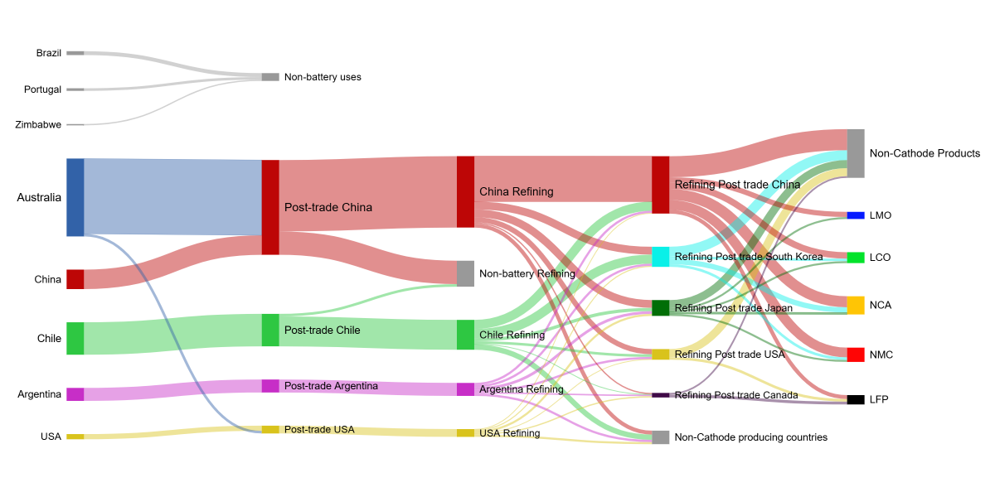
Figure 10: Sankey diagram showing the flow of global lithium supply chain from its country source to the different battery types.7Cheng, A. L., Fuchs, E. R. H., Karplus, V. J. & Michalek, J. J. Electric vehicle battery chemistry affects supply chain disruption vulnerabilities. Nat. Commun. 15, 2143 (2024). https://doi.org/10.1038/s41467-024-46418-1
*Values from the graph above are estimates based on the original graph made by Cheng et al.7Cheng, A. L., Fuchs, E. R. H., Karplus, V. J. & Michalek, J. J. Electric vehicle battery chemistry affects supply chain disruption vulnerabilities. Nat. Commun. 15, 2143 (2024). https://doi.org/10.1038/s41467-024-46418-1 hence the graph should be taken qualitatively rather than quantitatively.
New battery technologies also affect the supply chain of an EV. LFP batteries rely on more readily available materials and rely heavily on Lithium sourced from 3 countries. Unlike its predecessor, NMC, it does not require Nickel, Manganese, and Cobalt to produce which helps with both keeping the supply chain simple and lowers the need for rare-earth materials which are bad for the environment and more expensive to source and produce.
For the same battery capacity, LFP batteries use more materials than NMC battery, typically anywhere between 100–200 kg per vehicle. However, this is offset by the reduction in total energy used during the raw material extracting and processing stage. Furthermore, LFP batteries produce significantly less PM10 pollutants compared to low-Ni NMC batteries due to the higher Cobalt concentration in the NMC battery and the production of Cobalt sulfate has 15 times higher PM10 emission compared to Nickel sulfate. Higher Nickel concentration NMC batteries fare significantly better but still beaten by the LFP batteries. NOx impacts are also reduced with LFP batteries from 7kg per battery in high-NI NMC to 5kg per battery. SOx saw an even more significant reduction with LFP batteries only impacting less than a third of the best performing NMC battery.18Woody, M., Adderly, S. A., Bohra, R. & Keoleian, G. A. Electric and gasoline vehicle total cost of ownership across U.S. cities. University of Michigan Deep Blue Documents Repository https://backend.production.deepblue-documents.lib.umich.edu/server/api/core/bitstreams/729ce25d-c501-4fa9-8ec1-cdda38fdbba2/content (2022).
Over the past decade, several factors have contributed to improvements in the environmental impact of electric vehicles (EVs), including increased energy efficiency, reductions in life cycle emissions, technological advancements, cost reductions, and lower emissions.
Initially, EVs were primarily assessed based on their lack of tailpipe emissions. However, a full life cycle assessment indicates that their overall environmental performance depends on both the production process and the electricity mix used for charging. Over time, battery production has become more energy efficient, and electricity grids have integrated more renewable energy sources, leading to a significant reduction in the life cycle emissions of EVs, including greenhouse gases and particulate matter.14Verma, S., Dwivedi, G. & Verma, P. Life cycle assessment of electric vehicles in comparison to combustion engine vehicles: A review. Materials Today: Proceedings 49, 217-222 (2022). https://doi.org/10.1016/j.matpr.2021.01.666 Additionally, advancements in recycling technologies have made it possible to recover critical materials, reducing the environmental impact associated with raw material extraction. Studies suggest that for every 10% increase in the share of renewable energy in the grid, EV-related CO₂-equivalent emissions per kilometer can decrease by 5–10%.19IEA. (2021). Global EV Outlook 2021. International Energy Agency.
Lithium-ion battery costs have declined by over 80% in the last decade due to improvements in battery design, energy density, and production processes. These cost reductions, along with advancements in battery recycling and second-life applications, have further lowered the environmental impact of EVs. New recycling methods help recover valuable metals, reducing the demand for raw material extraction, which can have negative ecological effects.14Verma, S., Dwivedi, G. & Verma, P. Life cycle assessment of electric vehicles in comparison to combustion engine vehicles: A review. Materials Today: Proceedings 49, 217-222 (2022). https://doi.org/10.1016/j.matpr.2021.01.666 As illustrated in Figure 6, the cost per kilowatt-hour (kWh) of batteries has dropped from over $1000/kWh in the early 2010s to approximately $150/kWh by 2020, driven by advancements in cell chemistry, manufacturing scale, and supply chain efficiency.5Li, Z., Khajepour, A. & Song, J. A comprehensive review of the key technologies for pure electric vehicles. Energy 182, 824-839 (2019). https://doi.org/10.1016/j.energy.2019.06.077
Studies comparing different propulsion systems highlight the potential of alternative energy sources to reduce emissions. Liu et al. (2020) analyzed the well-to-wheels energy use and greenhouse gas emissions of hydrogen fuel cell electric vehicles compared to conventional gasoline vehicles, showing that alternative propulsion systems perform better when paired with cleaner energy sources.20Liu, X., Reddi, K., Elgowainy, A., Lohse-Busch, H., & Wang, M. (2020). Comparison of well-to-wheels energy use and emissions of a hydrogen fuel cell electric vehicle relative to a conventional gasoline-powered internal combustion engine vehicle. International Journal of Hydrogen Energy. Similarly, Buberger et al. (2022) assessed the total CO₂-equivalent life cycle emissions of passenger vehicles, demonstrating that the environmental benefits of EVs increase as manufacturing and recycling processes improve.21Buberger, J., Kersten, A., Kuder, M., Eckerle, R., & Weyh, T. (2022). Total CO₂-equivalent life-cycle emissions from commercially available passenger cars. Renewable and Sustainable Energy Reviews.
The overall ecological advantage of EVs largely depends on the energy mix used for charging. In regions with higher shares of renewable energy, the emissions per kilometer of EV use have decreased significantly compared to areas that still rely heavily on fossil fuels. This shift in the electricity generation mix continues to be a major factor in improving the environmental performance of EVs over time.4Kumar, M. S. & Revankar, S. T. Development scheme and key technology of an electric vehicle: An overview. Renewable and Sustainable Energy Reviews 70, 1266-1285 (2017). https://doi.org/10.1016/j.rser.2016.12.027
4 Social impact
Electric vehicles, once considered experimental, have become increasingly accepted by the public. Greater environmental awareness, concerns about urban air quality, and rising fuel costs have contributed to a growing interest in cleaner transportation options. Studies indicate that as consumers learn more about the benefits of EVs, such as lower noise levels, smoother acceleration, and reduced local air pollution, social acceptance has improved.13Ajanovic, A. The impact of COVID‐19 on the market prospects of electric passenger cars. Wiley interdisciplinary reviews. Energy and environment 11, e451-n/a (2022). https://doi.org/10.1002/wene.451 Government-led information campaigns and positive media coverage have also played a role in this shift. Research suggests that as people recognize the long-term health benefits of lower air pollution, acceptance of EVs continues to increase. “Research carried out by Venson Automotive Solutions has revealed 45% of drivers are reconsidering their plans for electric vehicles due to the radical improvement on air pollution across the globe from reduced traffic. A further 17% said it reaffirmed the decision they had already made to make the switch to an EV. Of the 45% of motorists who are now reassessing their EV options, 19% said their next company car or private purchase would be an EV, with the remaining 26% confirming they intend to become an EV driver in the next five years” (Middleton, 2020)22Middleton N. (2020). Drivers more likely to switch to EVs in wake of Covid-19 lockdown. https://fleetworld.co.uk/drivers-more-likely-to-switch-to-evs-in-wake-of-covid-19-lockdown/.
By the end of 2019 (see Figure 11), an estimated 7.3 million EV chargers were in place worldwide, with nearly 0.9 million being public chargers, with China maintaining a dominant position by hosting 81% of the world’s fast chargers and 52% of its slow chargers.22IEA. (2020). Global EV outlook 2020. International Energy Agency. Government support and private investments continue to drive the expansion of public charging infrastructure globally. From 2021 to 2024, the growth of charging points in the world increased at a 200% rate; while China remains the global leader in infrastructure volume, with 3.5 million operational chargers by 2024, countries such as Denmark, Indonesia, India and Brazil exhibited the highest growth rate of charging infrastructure during this period of time (see Figure 12).23International Energy Agency. Global EV Data Explorer. IEA https://www.iea.org/data-and-statistics/data-tools/global-ev-data-explorer (2024). From 2021 to 2024, the growth of charging points in the world increased at a 200% rate; while China remains the global leader in infrastructure volume, with 3.5 million operational chargers by 2024, countries such as Denmark, Indonesia, India and Brazil exhibited the highest growth rate of charging infrastructure during this period of time (see Figure 12)23International Energy Agency. Global EV Data Explorer. IEA https://www.iea.org/data-and-statistics/data-tools/global-ev-data-explorer (2024).. Furthermore, private light-duty vehicle charging points still increasing at a higher rate than public charging points (see Figure 13).24Editorial Board EVBoosters. Advancements in the global electric vehicle charging infrastructure. EVBoosters https://evboosters.com/ev-charging-news/advancements-in-the-global-electric-vehicle-charging-infrastructure/ (6 May 2024).
The adoption of EVs has led to several positive social impacts. Reduced tailpipe emissions improve urban air quality, lowering exposure to pollutants such as NOₓ, PM₁₀, and SOₓ, which are linked to respiratory diseases and other health risks. Research indicates that better air quality can reduce premature mortality and healthcare costs, providing wider societal benefits.25McKinsey & Company. (2020). Electrifying the future: The role of policy in accelerating EV adoption. McKinsey Insights. 26Garcia, E., Johnston, J., McConnell, R., Palinkas, L., & Eckel, S. P. (2023). California’s early transition to electric vehicles: Observed health and air quality co-benefits. Science of the Total Environment. Additionally, the growth of the EV industry has contributed to job creation, not only in vehicle manufacturing but also in infrastructure development, battery production, and recycling. This expansion supports local economies, reduces reliance on imported fossil fuels, and strengthens regional supply chains, helping to address social and economic inequalities.12Muratori, M. et al. The rise of electric vehicles—2020 status and future expectations. Progress in Energy 3, 022002 (2021). https://doi.org/10.1088/2516-1083/abe0ad 27Tessum, C. W., Hill, J., & Marshall, J. (2014). Life cycle air quality impacts of conventional and alternative light-duty transportation in the United States. Proceedings of the National Academy of Sciences.

Figure 11: Projected trends in electric vehicle (EV) adoption, nitrogen oxide (NOx) emission reductions, and associated health savings from 2020 to 2030.28Associated Press. (2024, March 9). Global clean energy transition faces new challenges. AP News. https://apnews.com/article/global-clean-energy-transition-df50c39865f3d24cf78ac9d58f0ad07c29Carrington, D. (2025, March 7). London air pollution down since ULEZ expansion, study finds. The Guardian. https://www.theguardian.com/environment/2025/mar/07/london-air-pollution-down-since-ulez-expansion-study30Ellingsen, L. A.-W., Singh, B., & Strømman, A. H. (2016). The size and range effect: Lifecycle greenhouse gas emissions of electric vehicles. Environmental Research Letters, 11(5), 054010. https://doi.org/10.1088/1748-9326/11/5/05401022IEA. (2020). Global EV outlook 2020. International Energy Agency.
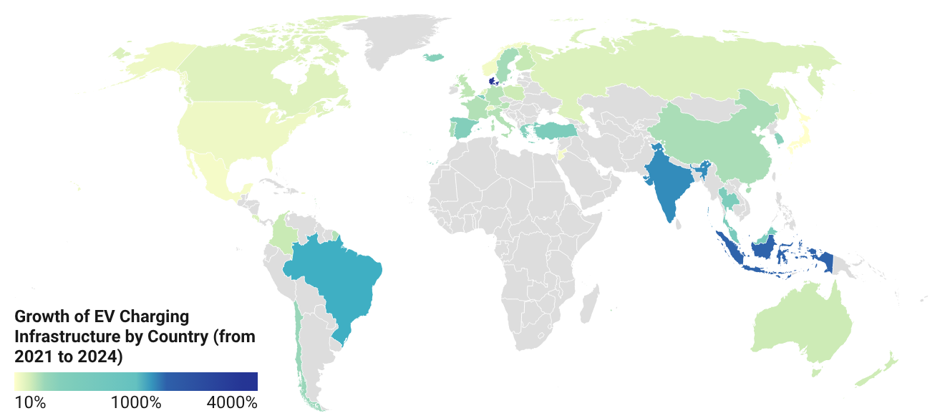
Figure 12: Growth rate of EV charging infrastructures by country from 2021 to 202423International Energy Agency. Global EV Data Explorer. IEA https://www.iea.org/data-and-statistics/data-tools/global-ev-data-explorer (2024).
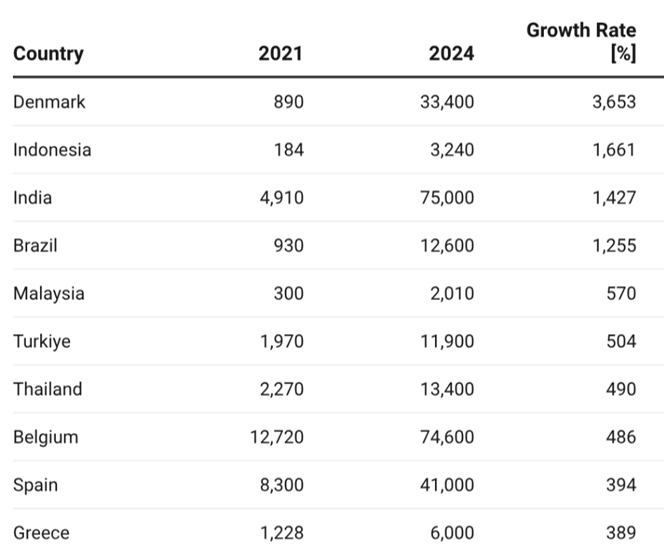
Table 4: Physical points and growth rate of EV charging infrastructures by country from 2021 to 202423International Energy Agency. Global EV Data Explorer. IEA https://www.iea.org/data-and-statistics/data-tools/global-ev-data-explorer (2024).
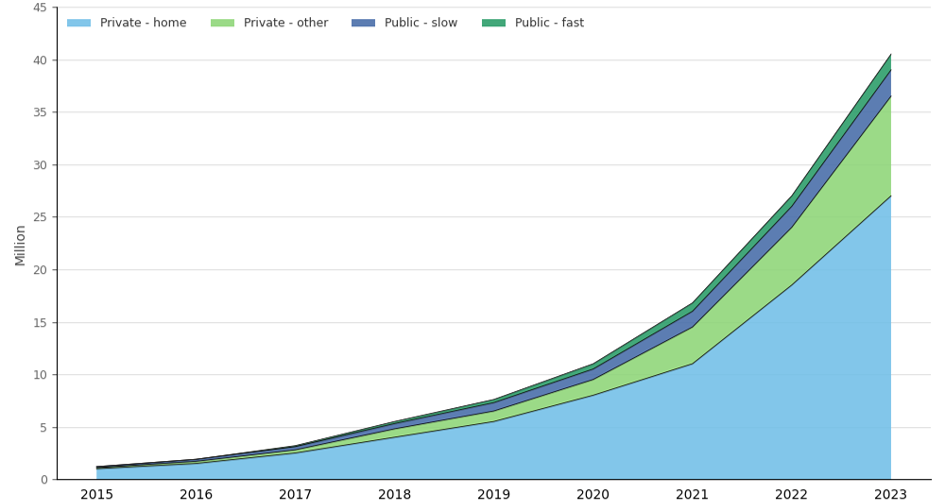
Figure 13: Installed public and private light-duty vehicle charging points by power rating (public) and by type (private), 2015-2023.24Editorial Board EVBoosters. Advancements in the global electric vehicle charging infrastructure. EVBoosters https://evboosters.com/ev-charging-news/advancements-in-the-global-electric-vehicle-charging-infrastructure/ (6 May 2024).
Despite these benefits, some social challenges persist. The production of EVs, particularly battery manufacturing, requires the extraction of materials such as lithium and cobalt, which can cause environmental damage and pose health risks to mining communities. Another concern is the low noise levels of EVs—while they contribute to quieter urban environments, they may also create safety risks for pedestrians who rely on sound cues. These challenges highlight the need for policies that promote sustainable supply chains and address urban safety as EV technology continues to develop.14Verma, S., Dwivedi, G. & Verma, P. Life cycle assessment of electric vehicles in comparison to combustion engine vehicles: A review. Materials Today: Proceedings 49, 217-222 (2022). https://doi.org/10.1016/j.matpr.2021.01.666 In response to these challenges, the EV industry has developed a series of technical and regulatory solutions:
4.1 Safety standards
As electric vehicles incorporate large lithium-ion battery packs, managing fire risk and thermal safety has become a critical engineering and regulatory priority. One of the most concerning challenges is the thermal runaway, a self-reinforcing reaction triggered by excessive heat, overcharging, over-discharging, or mechanical damage that can rapidly escalate into fire or explosion. To mitigate the risks associated with thermal runaway, Battery Thermal Management Systems (BTMS) are employed. There are various technologies used within BTMS to control the temperature of the battery pack such as: active and passive cooling, phase-change materials (PCMs), immersion cooling and limitation of charging rate.28Haghbin, S., Rezaei Larijani, M., Zolghadri, M. R. & Hedayati Kia, S. Automotive battery pack standards and design characteristics: A review. arXiv 2503.12566 (2025). https://arxiv.org/abs/2503.12566
To ensure that EV battery systems meet rigorous safety requirements, the automotive industry operates under a set of complementary international standards: UN ECE Regulation No. 100, ISO 6469 and ISO 26262 (see Table 5).28Haghbin, S., Rezaei Larijani, M., Zolghadri, M. R. & Hedayati Kia, S. Automotive battery pack standards and design characteristics: A review. arXiv 2503.12566 (2025). https://arxiv.org/abs/2503.12566
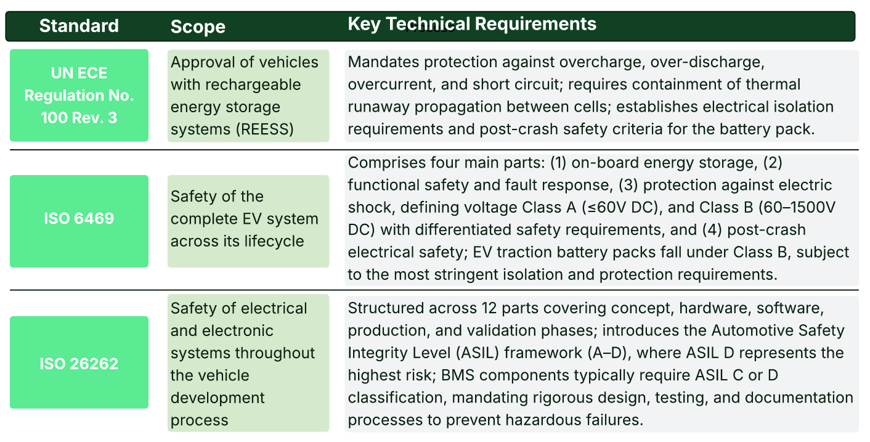
Table 5: Key international safety standards for EV battery packs28Haghbin, S., Rezaei Larijani, M., Zolghadri, M. R. & Hedayati Kia, S. Automotive battery pack standards and design characteristics: A review. arXiv 2503.12566 (2025). https://arxiv.org/abs/2503.12566
Beyond thermal control, continuous cell monitoring is essential to prevent dangerous conditions from developing undetected. Battery Management Systems (BMS) address this by continuously tracking critical parameters such as State of Charge (SoC) and State of Health (SoH) at the module level, leading to early fault detection across the battery pack. Through Module Monitoring and Control Units and Electronic Control Units (ECUs), the BMS acts as the intelligence layer of the battery pack, ensuring cells operate within safe limits.28Haghbin, S., Rezaei Larijani, M., Zolghadri, M. R. & Hedayati Kia, S. Automotive battery pack standards and design characteristics: A review. arXiv 2503.12566 (2025). https://arxiv.org/abs/2503.12566
4.2 Noise levels of EVs
The significant reduction in engine noise at low speeds in electric vehicles poses a serious safety risk, especially for visually impaired people and other vulnerable road users who rely on sound to assess traffic before crossing.29United Nations Economic Commission for Europe (UNECE). New UN regulation keeps silent cars from becoming dangerous cars. UNECE Press https://unece.org/press/new-un-regulation-keeps-silent-cars-becoming-dangerous-cars (2016)
To address this challenge, regulators worldwide have made Acoustic Vehicle Alerting Systems (AVAS) mandatory. In Europe, all new hybrid and electric vehicles must be equipped with AVAS since July 2019, under UN ECE Regulation 138, while in the United States, 100% compliance with FMVSS 141 was required by September.2020 Other countries, including China (with GB/T 37153-2018 standard), have adopted standards closely aligned with the UN ECE framework. These systems require vehicles to emit a minimum level of artificial sound at low speeds, including frequency shifts that allow pedestrians to detect the presence of a vehicle and the acceleration or deceleration of a vehicle.29United Nations Economic Commission for Europe (UNECE). New UN regulation keeps silent cars from becoming dangerous cars. UNECE Press https://unece.org/press/new-un-regulation-keeps-silent-cars-becoming-dangerous-cars (2016)30Lanslots, J. AVAS: electric vehicle warning sounds. Siemens Simcenter Blog https://blogs.sw.siemens.com/simcenter/avas-electric-vehicle-warning-sounds/ (5 March 2020).
4.3 Embodied emissions and low-carbon manufacturing
Battery production represents 40 to 60 percent of total embedded production emissions in an EV, making sourcing and manufacturing decisions critical for its environmental footprint. Emissions in the battery value chain are primarily driven by production location and sources of raw materials and energy. The energy source used in production is among the most influential factors (see Figure 14): manufacturers relying on renewable electricity sources already achieve significantly lower carbon footprints and recycled battery materials carry a carbon footprint four times smaller than virgin raw materials.31Linder, M., Nauclér, T., Nekovar, S., Pfeiffer, A. & Vekić, N. The race to decarbonize electric-vehicle batteries. McKinsey & Company https://www.mckinsey.com/industries/automotive-and-assembly/our-insights/the-race-to-decarbonize-electric-vehicle-batteries (23 February 2023).
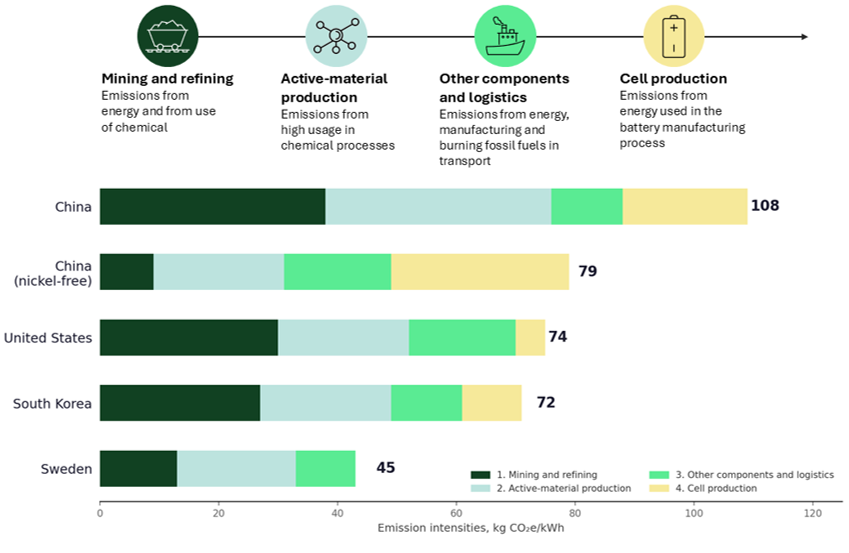
Figure 14: Comparative analysis of battery-related emissions, highlighting the impact of value chain configurations and regional electricity mixes on the total carbon footprint.31Linder, M., Nauclér, T., Nekovar, S., Pfeiffer, A. & Vekić, N. The race to decarbonize electric-vehicle batteries. McKinsey & Company https://www.mckinsey.com/industries/automotive-and-assembly/our-insights/the-race-to-decarbonize-electric-vehicle-batteries (23 February 2023).
EV battery packs also meet stringent environmental standards that regulate their behavior under real-world operational conditions. At the vehicle level, UN ECE Regulation 100 establishes the overarching compliance framework, while at the component level, the ISO 16750 series govern the environmental testing of electrical and electronic equipment, covering mechanical shock and vibration, thermal cycling (from -45°C to 80°C depending on installation location), humidity, chemical contamination, and insulation resistance.28Haghbin, S., Rezaei Larijani, M., Zolghadri, M. R. & Hedayati Kia, S. Automotive battery pack standards and design characteristics: A review. arXiv 2503.12566 (2025). https://arxiv.org/abs/2503.12566
Under EU Regulation 2023/1542, manufacturers have been required since February 2025 to calculate, declare, and verify through third parties the full lifecycle carbon footprint of each battery model (covering raw material extraction, cell manufacturing, assembly, distribution, and end-of-life processing). From 2026, every battery sold in the European market must display a carbon footprint class label, and from 2027, the European Commission will establish maximum lifecycle thresholds above which batteries may no longer be sold in the EU. Complementing this, a mandatory digital battery passport will be required from February 2027 for all EV and industrial rechargeable batteries above 2 kWh, enabling full supply chain traceability. Finally, the same regulation includes that, from August 2028, batteries must contain minimum percentages of recycled cobalt, lithium, nickel, and lead, with certified documentation of actual recycled content.32European Parliament & Council of the European Union. Regulation (EU) 2023/1542 of the European Parliament and of the Council of 12 July 2023 concerning batteries and waste batteries. Official Journal of the European Union L 191, 1–117 (2023). https://eur-lex.europa.eu/eli/reg/2023/1542/oj33Net Zero Compare. EU Battery Regulation. Net Zero Compare https://netzerocompare.com/policies/eu-battery-regulation (2023).
5 Political and legal aspects
Government policies and legal frameworks have played a key role in the adoption of EV technology. A combination of incentives, regulations, and strategic policies has influenced the market across different regions.
EV development has been shaped by various policies, from early government-funded research in Japan to more recent fiscal incentives, tax exemptions, and emissions regulations in Europe, China, and North America. These measures have helped lower the initial cost of EVs, encouraged investment in charging infrastructure, and increased market adoption. In particular, strong incentives in China and the United States have contributed significantly to global EV growth.2Iulia, V. & Loránd, S. A Brief History of Electric Vehicles. Journal of Computer Science & Control Systems 15(2022). Stricter emissions regulations have also pushed manufacturers to develop cleaner technologies. For example, the European Union’s CO₂ targets for new vehicles have accelerated the transition from internal combustion engine (ICE) vehicles to EVs. Both public and private investments in charging infrastructure remain essential, with legislative measures and long-term planning focused on expanding the charging network to support a growing number of EVs.17Günther, H. O., Kannegiesser, M. & Autenrieb, N. The role of electric vehicles for supply chain sustainability in the automotive industry. Journal of Cleaner Production 90, 220-233 (2015). https://doi.org/10.1016/j.jclepro.2014.11.058
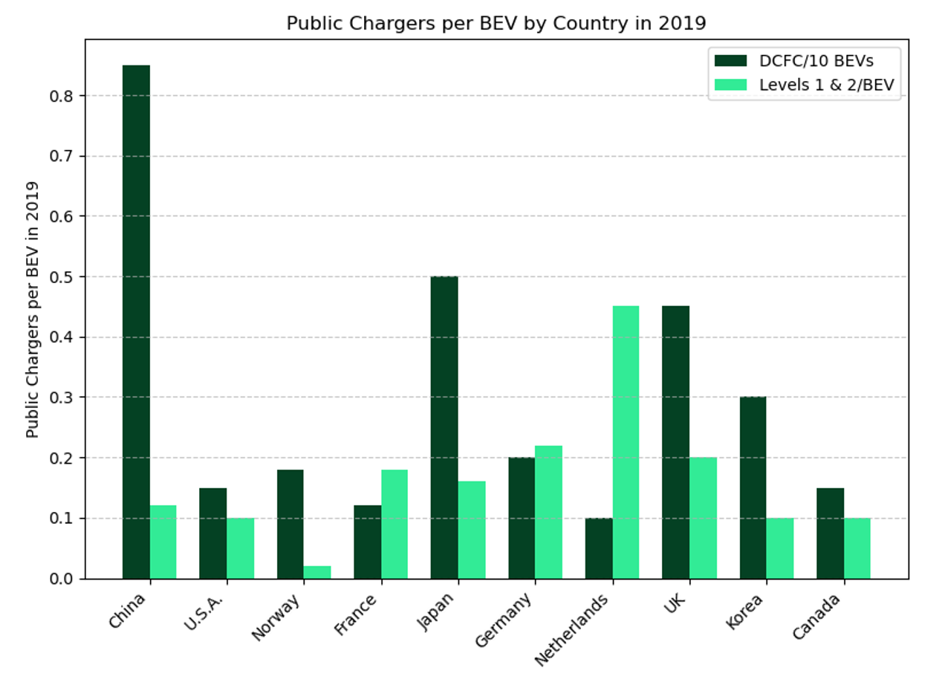
Figure 15: Public charging availability by country in 2019, measured as level 1 and level 2 chargers per BEV and DCFC (fast charging, level 3) per 10 BEVs.22IEA. (2020). Global EV outlook 2020. International Energy Agency.
In addition to direct subsidies, other policy measures such as carbon pricing, low-emission zones, and mandatory fleet electrification have been introduced. Each approach has trade-offs. While subsidies and tax breaks can encourage EV adoption quickly, they may strain public finances and distort the market if not carefully managed. Carbon pricing, on the other hand, creates market-based incentives to lower emissions but requires broad political agreement and can be difficult to implement fairly.17Günther, H. O., Kannegiesser, M. & Autenrieb, N. The role of electric vehicles for supply chain sustainability in the automotive industry. Journal of Cleaner Production 90, 220-233 (2015). https://doi.org/10.1016/j.jclepro.2014.11.058 Recent efforts toward international standards (International Harmonization) for vehicle safety, battery recycling, and emissions control are designed to smooth these differences, enhancing the global competitiveness of EVs.
Policy differences across regions also pose challenges for global manufacturers. Efforts to establish international standards for vehicle safety, battery recycling, and emissions control aim to reduce these discrepancies and improve the global competitiveness of EVs. However, variations in safety and environmental regulations between countries can complicate supply chains and create imbalances in the industry. Policymakers continue to work toward balancing economic growth with environmental objectives, ensuring that the transition to electric transportation supports both technological progress and sustainability.2Iulia, V. & Loránd, S. A Brief History of Electric Vehicles. Journal of Computer Science & Control Systems 15(2022). 17Günther, H. O., Kannegiesser, M. & Autenrieb, N. The role of electric vehicles for supply chain sustainability in the automotive industry. Journal of Cleaner Production 90, 220-233 (2015). https://doi.org/10.1016/j.jclepro.2014.11.058
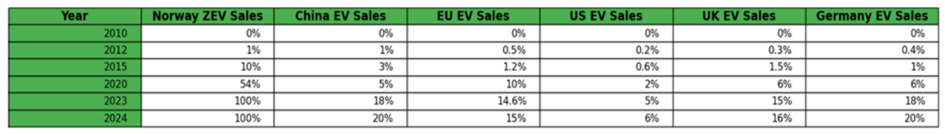
Table 6: Key policy interventions and EV adoption rates (2010-2024).33Cleveland, C., & Dube, S. (2021). Policy and consumer behavior in the Norwegian electric vehicle market. Environmental Science & Technology, 55(16), 11234-11242. 34He, H., & Qiao, W. (2020). Impact of subsidies on electric vehicle adoption in China. Energy Policy, 144, 111654. 35European Commission (2020). The impact of CO₂ emissions standards on the electric vehicle market in the EU. European Transport Policy Journal. 36Sierzchula, W., Bakker, S., Maat, K., & Van Wee, B. (2014). The influence of financial incentives and other socio-economic factors on electric vehicle adoption. Energy Economics, 44, 23-35. 37Hawkins, T. R., Singh, B., Majeau-Bettez, G., & Hammer, S. (2022). The role of policy in the adoption of electric vehicles in the UK. Environmental Research Letters, 17(3), 034021. 38Gössling, S., Hall, C. M., & Zografos, A. (2021). The role of government subsidies in driving electric vehicle adoption in Germany. Transport Policy, 101, 132-142.
Based on Table 6, the data shown by country describes the trends of different parts of the world impacted by policy interventions. Norway’s strategic tax incentives have effectively transformed its automotive market, where 95.9% of all new car registrations in 2025 were electric vehicles, peaking at nearly 98% in December (up from 88.9% in 2024) and a 40% year-on-year increase in new EV registrations.39Reuters. Norway’s new car sales were 96% electric in 2025. Reuters https://www.reuters.com/sustainability/climate-energy/norways-new-car-sales-were-96-electric-2025-2026-01-02/ (2 January 2026).33Cleveland, C., & Dube, S. (2021). Policy and consumer behavior in the Norwegian electric vehicle market. Environmental Science & Technology, 55(16), 11234-11242. China introduced aggressive subsidies for EVs and set ambitious goals for EV adoption, aiming for 20% of new car sales to be electric by 2025 China became the largest EV market globally, with EV sales growing exponentially. By 2020, about 5-6% of total vehicle sales in China were electric.34He, H., & Qiao, W. (2020). Impact of subsidies on electric vehicle adoption in China. Energy Policy, 144, 111654. The EU introduced stringent CO₂ emissions standards to reduce the carbon footprint of new vehicles. Automakers who exceeded these limits faced penalties. This spurred automakers to accelerate the production of EVs, with EV market share reaching around 10% by 2020 and around 14.6% by 2023.35European Commission (2020). The impact of CO₂ emissions standards on the electric vehicle market in the EU. European Transport Policy Journal. The U.S. offered tax credits up to $7,500 for qualifying EVs, which helped lower the initial purchase cost for consumers. The U.S. saw steady growth in EV adoption, with EVs making up around 2% of all new car sales by 2020 By 2023, adoption rose to approximately 5%.36Sierzchula, W., Bakker, S., Maat, K., & Van Wee, B. (2014). The influence of financial incentives and other socio-economic factors on electric vehicle adoption. Energy Economics, 44, 23-35. The UK announced that sales of new gasoline and diesel cars would be banned by 2035, further accelerating the transition to electric vehicles.39Alexander, H. Phasing out the sale of new petrol and diesel cars from 2030 and support for zero emission vehicle (ZEV) transition. Written Statement to Parliament. UK Department for Transport / GOV.UK https://www.gov.uk/government/speeches/phasing-out-the-sale-of-new-petrol-and-diesel-cars-from-2030-and-support-for-zero-emission-vehicle-zev-transition (6 January 2025). This policy has led to a steady increase in EV sales in the UK, with 15% of all new car registrations in 2023 being electric vehicles.37Hawkins, T. R., Singh, B., Majeau-Bettez, G., & Hammer, S. (2022). The role of policy in the adoption of electric vehicles in the UK. Environmental Research Letters, 17(3), 034021. Germany implemented a “scrappage bonus” that provided financial incentives to consumers purchasing new electric vehicles. The program helped Germany become one of the largest markets for EVs in Europe, with nearly 400,000 new EV registrations in 2024.38Gössling, S., Hall, C. M., & Zografos, A. (2021). The role of government subsidies in driving electric vehicle adoption in Germany. Transport Policy, 101, 132-142.
Moreover, the rapid expansion of EV infrastructure imposes significant, often unpredictable peak demands that needs grid reinforcements to prevent instability. In response to these challenge, there are a number of policies solutions in different countries, which provide better outcomes for grid operators, CPOs and consumers:40Mason, G., Matthew, G. & Gallichan, J. The impact of EV charging infrastructure on the global energy grid. Bird & Bird Insights https://www.twobirds.com/en/insights/2025/the-impact-of-ev-charging-infrastructure-on-the-global-energy-grid (2025).
In late 2023, the European Union’s Alternative Fuels Infrastructure Regulation (AFIR) mandates public fast chargers every 60 km along main TEN-T transport corridors, ensuring 1.3 kW of publicly accessible charging capacity per registered BEV and 0.8 kW per PHEV. Under this regulation, all new public charging stations in Europe must be digitally connected and capable of smart charging, with ISO 15118-20 standards mandatory by summer 2025 https://evbox.com/en/smart-ev-charging-regulations-in-2025/. In the EU, AFIR and the Energy Performance of Buildings Directive (EPBD) work to provide technical requirements for EV chargers in public spaces and necessitate smart capabilities. Finally, the EU is exploring measures under AFIR to anticipate how vehicle-to-grid (V2G) could integrate with member states’ networks.40Mason, G., Matthew, G. & Gallichan, J. The impact of EV charging infrastructure on the global energy grid. Bird & Bird Insights https://www.twobirds.com/en/insights/2025/the-impact-of-ev-charging-infrastructure-on-the-global-energy-grid (2025).
The United Kingdom remains at the forefront of smart charging Regulation 2021. Regulations mandated Smart Charging by the Electric Vehicles (Smart Charge Points), in order to be able to schedule charging during off-peak times. Smart charging is also incentivized on the consumer side as off-peak charging will typically be cheaper for consumers on flexible electricity tariffs. Although no standalone legislation exclusively governs V2G, smart charging legislation has laid the groundwork for bi-directional charging capabilities.40Mason, G., Matthew, G. & Gallichan, J. The impact of EV charging infrastructure on the global energy grid. Bird & Bird Insights https://www.twobirds.com/en/insights/2025/the-impact-of-ev-charging-infrastructure-on-the-global-energy-grid (2025).
France has taken a legislative lead through the APER Law, where all outdoor car parks larger than 1,500 m² must cover 50% of their surface area with solar panels; this will apply to all qualifying car parks by Q3 2028 The same law requires non-residential buildings with more than twenty parking spaces to install EV charging stations, creating a direct regulatory driver for private wire PPAs that connect on-site solar generation to EV charging infrastructure without grid intervention.40Mason, G., Matthew, G. & Gallichan, J. The impact of EV charging infrastructure on the global energy grid. Bird & Bird Insights https://www.twobirds.com/en/insights/2025/the-impact-of-ev-charging-infrastructure-on-the-global-energy-grid (2025).
China has implemented one of the most comprehensive national frameworks to manage peak energy demand from EV charging. In the document No. 1721 issued by the National Development and Reform Commission (NDRC) in January 2024, it is established that 60% of total EV charging and 80% of private home charging should occur during off-peak hours by 2025, supported by time-of-use tariffs that apply lower electricity prices at night and higher prices during peak periods. Additionally, all newly installed chargers are mandated to be smart chargers with intelligent load management by default, while existing chargers are being progressively retrofitted. By 2030, EVs are expected to function as mobile storage units providing bidirectional grid flexibility, with pilot programs already running across in five cities across the Yangtze River Delta, Pearl River Delta, Beijing-Tianjin-Hebei, and Sichuan-Chongqing regions.41National Development and Reform Commission (NDRC), National Energy Administration (NEA), Ministry of Industry and Information Technology (MIIT) & State Administration for Market Regulation (SAMR). 关于加强新能源汽车与电网融合互动的实施意见 Implementation Opinions on Strengthening the Integration and Interaction between New Energy Vehicles and the Power Grid, Document No. NDRC Energy 2023 1721. NDRC https://www.ndrc.gov.cn/xxgk/zcfb/tz/202401/t20240104_1363096.html (4 January 2024).
In the United States, the National Electric Vehicle Infrastructure (NEVI) Formula Program, updated in August 2025, aims to establish standards to ensure an efficient and consistent EV charging network. While not exclusively focused on smart charging, the NEVI program will likely contribute to the increased use of smart charging in the U.S., with accelerated deployments in 2025.42Editorial Board EVBox. Smart EV charging regulations in 2025. EVBox Blog https://evbox.com/en/smart-ev-charging-regulations-in-2025/ (last updated 22 September 2025). Other jurisdictions, such as California, have introduced incentive schemes and pilot programs that reward EV owners for participating in grid-support initiatives. These schemes often operate under time-of-use tariffs and can evolve into more comprehensive V2G regulations as the market matures.40Mason, G., Matthew, G. & Gallichan, J. The impact of EV charging infrastructure on the global energy grid. Bird & Bird Insights https://www.twobirds.com/en/insights/2025/the-impact-of-ev-charging-infrastructure-on-the-global-energy-grid (2025).
References
- 1Høyer, K. G. The history of alternative fuels in transportation: The case of electric and hybrid cars. Utilities Policy 16, 63-71 (2008). https://doi.org/10.1016/j.jup.2007.11.001
- 2Iulia, V. & Loránd, S. A Brief History of Electric Vehicles. Journal of Computer Science & Control Systems 15(2022).
- 3Kumar, M. S. & Revankar, S. T. Development scheme and key technology of an electric vehicle: An overview. Renewable and Sustainable Energy Reviews. 70, 1266–1285 (2017) https://doi.org/10.1016/j.rser.2016.12.027
- 4Kumar, M. S. & Revankar, S. T. Development scheme and key technology of an electric vehicle: An overview. Renewable and Sustainable Energy Reviews 70, 1266-1285 (2017). https://doi.org/10.1016/j.rser.2016.12.027
- 5Li, Z., Khajepour, A. & Song, J. A comprehensive review of the key technologies for pure electric vehicles. Energy 182, 824-839 (2019). https://doi.org/10.1016/j.energy.2019.06.077
- 7Cheng, A. L., Fuchs, E. R. H., Karplus, V. J. & Michalek, J. J. Electric vehicle battery chemistry affects supply chain disruption vulnerabilities. Nat. Commun. 15, 2143 (2024). https://doi.org/10.1038/s41467-024-46418-1
- 6International Energy Agency. Trends in batteries. in Global EV Outlook 2023 (IEA, 2023). https://www.iea.org/reports/global-ev-outlook-2023/trends-in-batteries
- 8Liu, Z. et al. Comparing total cost of ownership of battery electric vehicles and internal combustion engine vehicles. Energy Policy 158, 112564 (2021). https://doi.org/10.1016/j.enpol.2021.112564
- 16Mitropoulos, L. K., Prevedouros, P. D. & Kopelias, P. Total cost of ownership and externalities of conventional, hybrid and electric vehicle. Transportation Research Procedia 24, 267-274 (2017). https://doi.org/10.1016/j.trpro.2017.05.117
- 9We Buy Any Car. Electric car depreciation — An in-depth guide. webuyanycar.com https://www.webuyanycar.com/electric-cars/ev-depreciation/ (n.d.).
- 10Nickel Institute. Total cost of ownership (TCO) for electric vehicles (EV) vs internal combustion engine vehicles (ICE). Nickel Institute https://nickelinstitute.org/en/nickel-applications/nickel-in-batteries/total-cost-of-ownership-tco-for-electric-vehicles-ev-vs-internal-combustion-engine-vehicles-ice/ (2021).
- 11Burnham, A. et al. Comprehensive total cost of ownership quantification for vehicles with different size classes and powertrains. Argonne National Laboratory Technical Report ANL/ESD-21/4. https://publications.anl.gov/anlpubs/2021/05/167399.pdf (2021).
- 12Muratori, M. et al. The rise of electric vehicles—2020 status and future expectations. Progress in Energy 3, 022002 (2021). https://doi.org/10.1088/2516-1083/abe0ad
- 13Ajanovic, A. The impact of COVID‐19 on the market prospects of electric passenger cars. Wiley interdisciplinary reviews. Energy and environment 11, e451-n/a (2022). https://doi.org/10.1002/wene.451
- 17Günther, H. O., Kannegiesser, M. & Autenrieb, N. The role of electric vehicles for supply chain sustainability in the automotive industry. Journal of Cleaner Production 90, 220-233 (2015). https://doi.org/10.1016/j.jclepro.2014.11.058
- 14Verma, S., Dwivedi, G. & Verma, P. Life cycle assessment of electric vehicles in comparison to combustion engine vehicles: A review. Materials Today: Proceedings 49, 217-222 (2022). https://doi.org/10.1016/j.matpr.2021.01.666
- 15O’Connell, A., Pavlenko, N., Bieker, G. & Searle, S. A comparison of the life-cycle greenhouse gas emissions of European heavy-duty vehicles and fuels. International Council on Clean Transportation (ICCT) White Paper https://theicct.org/wp-content/uploads/2023/02/Lifecycle-assessment-trucks-and-buses-emissions-Europe.pdf (February 2023).
- 18Woody, M., Adderly, S. A., Bohra, R. & Keoleian, G. A. Electric and gasoline vehicle total cost of ownership across U.S. cities. University of Michigan Deep Blue Documents Repository https://backend.production.deepblue-documents.lib.umich.edu/server/api/core/bitstreams/729ce25d-c501-4fa9-8ec1-cdda38fdbba2/content (2022).
- 19IEA. (2021). Global EV Outlook 2021. International Energy Agency.
- 20Liu, X., Reddi, K., Elgowainy, A., Lohse-Busch, H., & Wang, M. (2020). Comparison of well-to-wheels energy use and emissions of a hydrogen fuel cell electric vehicle relative to a conventional gasoline-powered internal combustion engine vehicle. International Journal of Hydrogen Energy.
- 21Buberger, J., Kersten, A., Kuder, M., Eckerle, R., & Weyh, T. (2022). Total CO₂-equivalent life-cycle emissions from commercially available passenger cars. Renewable and Sustainable Energy Reviews.
- 22IEA. (2020). Global EV outlook 2020. International Energy Agency.
- 23International Energy Agency. Global EV Data Explorer. IEA https://www.iea.org/data-and-statistics/data-tools/global-ev-data-explorer (2024).
- 24Editorial Board EVBoosters. Advancements in the global electric vehicle charging infrastructure. EVBoosters https://evboosters.com/ev-charging-news/advancements-in-the-global-electric-vehicle-charging-infrastructure/ (6 May 2024).
- 25McKinsey & Company. (2020). Electrifying the future: The role of policy in accelerating EV adoption. McKinsey Insights.
- 26Garcia, E., Johnston, J., McConnell, R., Palinkas, L., & Eckel, S. P. (2023). California’s early transition to electric vehicles: Observed health and air quality co-benefits. Science of the Total Environment.
- 27Tessum, C. W., Hill, J., & Marshall, J. (2014). Life cycle air quality impacts of conventional and alternative light-duty transportation in the United States. Proceedings of the National Academy of Sciences.
- 28Haghbin, S., Rezaei Larijani, M., Zolghadri, M. R. & Hedayati Kia, S. Automotive battery pack standards and design characteristics: A review. arXiv 2503.12566 (2025). https://arxiv.org/abs/2503.12566
- 29United Nations Economic Commission for Europe (UNECE). New UN regulation keeps silent cars from becoming dangerous cars. UNECE Press https://unece.org/press/new-un-regulation-keeps-silent-cars-becoming-dangerous-cars (2016)
- 30Lanslots, J. AVAS: electric vehicle warning sounds. Siemens Simcenter Blog https://blogs.sw.siemens.com/simcenter/avas-electric-vehicle-warning-sounds/ (5 March 2020).
- 31Linder, M., Nauclér, T., Nekovar, S., Pfeiffer, A. & Vekić, N. The race to decarbonize electric-vehicle batteries. McKinsey & Company https://www.mckinsey.com/industries/automotive-and-assembly/our-insights/the-race-to-decarbonize-electric-vehicle-batteries (23 February 2023).
- 32European Parliament & Council of the European Union. Regulation (EU) 2023/1542 of the European Parliament and of the Council of 12 July 2023 concerning batteries and waste batteries. Official Journal of the European Union L 191, 1–117 (2023). https://eur-lex.europa.eu/eli/reg/2023/1542/oj
- 33Cleveland, C., & Dube, S. (2021). Policy and consumer behavior in the Norwegian electric vehicle market. Environmental Science & Technology, 55(16), 11234-11242.
- 34He, H., & Qiao, W. (2020). Impact of subsidies on electric vehicle adoption in China. Energy Policy, 144, 111654.
- 35European Commission (2020). The impact of CO₂ emissions standards on the electric vehicle market in the EU. European Transport Policy Journal.
- 36Sierzchula, W., Bakker, S., Maat, K., & Van Wee, B. (2014). The influence of financial incentives and other socio-economic factors on electric vehicle adoption. Energy Economics, 44, 23-35.
- 37Hawkins, T. R., Singh, B., Majeau-Bettez, G., & Hammer, S. (2022). The role of policy in the adoption of electric vehicles in the UK. Environmental Research Letters, 17(3), 034021.
- 38Gössling, S., Hall, C. M., & Zografos, A. (2021). The role of government subsidies in driving electric vehicle adoption in Germany. Transport Policy, 101, 132-142.
- 39Alexander, H. Phasing out the sale of new petrol and diesel cars from 2030 and support for zero emission vehicle (ZEV) transition. Written Statement to Parliament. UK Department for Transport / GOV.UK https://www.gov.uk/government/speeches/phasing-out-the-sale-of-new-petrol-and-diesel-cars-from-2030-and-support-for-zero-emission-vehicle-zev-transition (6 January 2025).
- 40Mason, G., Matthew, G. & Gallichan, J. The impact of EV charging infrastructure on the global energy grid. Bird & Bird Insights https://www.twobirds.com/en/insights/2025/the-impact-of-ev-charging-infrastructure-on-the-global-energy-grid (2025).
- 41National Development and Reform Commission (NDRC), National Energy Administration (NEA), Ministry of Industry and Information Technology (MIIT) & State Administration for Market Regulation (SAMR). 关于加强新能源汽车与电网融合互动的实施意见 Implementation Opinions on Strengthening the Integration and Interaction between New Energy Vehicles and the Power Grid, Document No. NDRC Energy 2023 1721. NDRC https://www.ndrc.gov.cn/xxgk/zcfb/tz/202401/t20240104_1363096.html (4 January 2024).
- 42Editorial Board EVBox. Smart EV charging regulations in 2025. EVBox Blog https://evbox.com/en/smart-ev-charging-regulations-in-2025/ (last updated 22 September 2025).