
Authors: Antonia Lottes
Edited by:
Last updated: June 24, 2026
Executive summary
Sustainable mobility tools help organizations understand and reduce the climate impacts of employee commuting, business travel, and freight transport. Because commuting and logistics can contribute materially to Scope 3 greenhouse gas emissions, organizations need practical ways to identify emissions sources, compare alternatives, and encourage lower-emission travel choices.
Existing calculators provide useful starting points, such as estimating emissions from selected travel modes, comparing commuting with remote work, or calculating transport-related greenhouse gases. However, they often have limitations: they may not support multimodal trips, may assume fixed work schedules, may be difficult for non-experts to use, or may not clearly compare alternatives and savings potential.
The proposed Sustainable Mobility Tool combines several functions in one Excel-based tool. It calculates and compares business travel options, collects employee commuting data, estimates individual and organizational commuting emissions, analyzes work-from-home and alternative-transport scenarios, ranks emissions savings, and estimates freight-transport emissions. It is designed to reduce administrative effort while making emissions data transparent and actionable.
For organizations, the tool can support carbon accounting, employee engagement, fleet and travel planning, remote-work policies, and collaboration with logistics partners. Its scenario and ranking functions can also help organizations design incentives, such as public-transit support, bicycle infrastructure, e-bike leasing, or recognition for employees who reduce commuting emissions.
Key limitations remain. The tool focuses mainly on Scope 3 emissions, uses UK-based 2024 conversion factors, relies on average emissions data, and does not yet fully account for carpooling, energy use from e-bikes or remote work, or Scope 1 and 2 vehicle emissions. Future development should add more regional data, unit flexibility, Scope 1 calculators, carpooling options, and stronger supply-chain scenario analysis.
1 Motivation and background
Daily commuting is an important contributor to climate change and causes a quarter of carbon emissions in Europe1José Ignacio Giménez-Nadal, J.A.M., Jorge Velilla, Trends in commuting time of European workers: A cross-country analysis. Transport Policy, 2022. 116: p. 327-342.. At the same time, remote work provides new opportunities to reduce environmental impact. A US study revealed that one work-from-home day per person could mitigate GHG emissions by 29.11% compared with the daily commute to work2Hongyue, Y.C., Yunfeng Chen, Greenhouse gas emissions under work from home vs. office: An actitvity-based individual-level accounting model. Applied Energy, 2024. 353..
Sustainable mobility is a concept that aims to provide efficient, safe, and accessible transportation while reducing environmental and social damage. A short-term strategy is to focus on behavioral change and travel habits3Carlotta Buck, A.L., Mareike Martens. Road transport and motor vehicles. 2023; Available from: https://www.sustainability-management.wiki/docs/industries/road-transport-and-motor-vehicles/..
The 2011 European Commission’s white paper Roadmap to a Single European Transport Area – Towards a competitive and resource-efficient transport system aims to reduce CO₂ emissions from transport by 60 % by 2050 compared to 19904Eurostat. Transport statistics introduced. August 2020; Available from: https://ec.europa.eu/eurostat/statistics-explained/index.php?title=Transport_statistics_introduced.. The first step for accomplishing this goal is to identify and account for all emissions caused by a company or organization.
A sustainable mobility tool can be used for carbon accounting. One important framework is the Greenhouse Gas (GHG) Protocol. To determine direct and indirect emissions three scopes can be differentiated. Scope 1 means direct greenhouse gas emissions that are traceable to and created by the company or individual. Scope 2 includes indirect greenhouse gas emissions from purchased electricity. Scope 3 means all other indirect emissions resulting from company activities that occur outside the company’s direct control5Sarah Mora Esquivel, S.K., Marcel Schröder, Abdel-Malik Maghraoui. Carbon Accouting. 2023; Available from: https://www.sustainability-management.wiki/docs/functions/sustainability-reporting-accounting/carbon-accounting-ghg-protocol/..
Several aspects of Scope 3 emissions can be addressed with a sustainable mobility tool. A commuting emissions calculator helps companies and organizations to assess the impact of employee travel on their overall carbon footprint. A freight emissions calculator enables them to evaluate the environmental impact of transporting goods and identify emissions throughout the value chain.
2 Existing tools/templates
One example of an existing tool is a CO₂ travel and remote work calculator from the Energieagentur Rheinland-Pfalz. The tool has two functions: the first is an emissions calculator for selected transportation modes and the comparison of alternatives. The second function calculates commuting emissions or, rather, the savings potential of a specific amount of work-from-home days, for which only a transportation mode must be selected and the distance entered6Rheinland-Pfalz, E. CO₂-Fahrten- und Homeoffice-Rechner. Available from: https://www.energieagentur.rlp.de/info/rechner/CO₂-fahrten-homeoffice-rechner/..
A major strength of this tool is that it offers dual functionality for estimating greenhouse gas emissions for individuals’ trips including comparison between different modes of transport and calculating emissions saved through remote work compared with emissions generated by commuting.
Limitations of this tool are that it does not allow users to choose multiple transportation modes per trip. In practice it is unrealistic that every employee who uses a train from home to work does not additionally take other kinds of public transportation. Also, the number of workdays and workweeks is fixed. While a five-day week and 44 work weeks per year may not be unusual in Germany, concepts like the four-day week are becoming more popular and must be considered in an emissions calculator. Another limitation is that only CO₂e is used as a unit, and the comparison of alternative transportation modes is not presented in an easily understandable way.
The Greenhouse Gas Protocol (GHG) provides a calculator for GHG emissions from transport or mobile sources. The tool calculates the CO₂, CH4, and N2O emissions from public or outsourced transportation, vehicles that are owned or controlled by the organization and mobile machinery. In the first step the user selects an emission factor dataset, mode of transport, scope and type of activity data. In the second step the user enters vehicle and/or fuel data. At the end the tool presents a review and documentation of total GHG emissions by sources and total GHG emissions across all sources7Protocol, G.G. Calculation Tools and Guidance. Available from: https://ghgprotocol.org/calculation-tools-and-guidance?ap3c=IGXmCH6WDeDPomoEAGXmCH6mIt-Db9NCNH00dmje0ZqebCmgPw..
The strengths of this tool include the personalized settings. The company can select an older IPCC Global Warming Potential set and the option to enter fuel-specific emission factors that cannot be found in this calculator. Additionally, the calculation of emissions is possible not only for commuting/business trips but also for freight transport.
This tool is rather complex as well as detailed and not every employee has the necessary knowledge to use this tool correctly. For example, it is required to differentiate between Scope 1 and Scope 3 emissions. Therefore, this tool may not be suitable for easily documenting employees’ commuting behavior. Furthermore, the tool offers no option to compare different transportation modes in terms of their emissions or the emissions-savings potential of work-from-home days.
3 New tool
This sustainable mobility tool aims to calculate Scope 3 emissions from commuting and freight transport, help encourage employees to make more sustainable mobility choices and compare different transportation modes in terms of emissions. The intention is to have one tool to combine calculating commuting emissions, comparison of transportation modes, and freight transport rather than having several calculators. This saves companies considerable effort and time.
All emission calculations in this tool are based on officially recognized conversion factors from the year 2024, provided by the UK Department for Energy Security and Net Zero. These are applicable to both UK-based and international organizations of all sizes reporting on UK operations. To ensure transparency in this tool, all data for emissions per unit are directly shown in the tables accordingly. In addition to calculating CO₂e (in kg), this tool uses the provided data to differentiate emissions into CO₂e from CO₂, CO₂e from CH4, and CO₂e from N2O.
The tool consists of several sheets which will be explained in detail below: Introduction, Business Travel Options, Commuting, Individual Commuting Emissions, Commuting – Scenario Analysis, Commuting – Ranking, Freighting Goods Calculation, Emission Data and Freighting Goods – Data.
Business travel options
The first sheet is used to calculate and compare emissions for different transportation options. After entering a distance (in km) and the number of passengers Excel automatically displays the emissions per unit and the total emissions. Based on this table two different ranking overviews are provided. First, it shows the top three overall transportation modes with the lowest emissions. Second, it shows a ranking of the top three cars with the lowest emissions. The second ranking, only containing car options, was added because of real-world implementation constraints. Transportation modes with low emissions like international rail or ferries are not always an available option, especially in rural areas. This can additionally be used for planning or making changes to a company’s fleet. As the calculation is used for determining Scope 3 emissions, which typically result from logistics providers, carriers and subcontractors, this analysis can be used for collaborations with third parties to jointly reduce overall emissions in the supply chain.
Commuting
The Commuting sheet is the most important sheet of the tool. It collects information from all employees about their commuting behavior and calculates the emissions based on their entries. To keep employees’ involvement minimal and avoid overburdening them, only a one-time entry is required. The table is currently limited to 30 employees but can be adjusted to the real number of employees. In column A employees can replace the placeholder with their own name or ID. First, employees can select in a drop-down list their preferred transportation mode, meaning the mode of transportation they usually use for commuting to and from work, and enter the number of times used per week and the total distance in km (distance there and back). To promote more sustainable mobility, employees can select an alternative transportation mode from a drop-down list and enter the number of times used per week and the distance. Additionally, the number of work-from-home days can be entered. This way, employees can make more sustainable choices easier. In real-life scenarios employees may depend on their cars due to a lack of reliable public transportation in rural areas, safety concerns, tight schedules and childcare. The tool allows more flexibility, for example, by substituting public transit for the car one day per week or by adding one work-from-home day. The option of selecting work-from-home days benefits the above-mentioned employees who are dependent on using their cars. At this point, it should be noted that not every company or industry allows employees to take work-from-home days. In this case employees enter 0 work-from-home days and are still encouraged to use a more sustainable alternative transportation mode as much as possible. If more than one transportation mode is used for commuting the additional sheet ‘Individual Commuting Emissions’ helps calculate the total emissions, which will be explained below. Based on the employees’ entries this sheet automatically provides the following information: 1. the preferred mode’s emissions per unit and total emissions per week, 2. the alternative mode’s emissions per unit and total emissions per week, and 3. the total commuting emissions per week3Carlotta Buck, A.L., Mareike Martens. Road transport and motor vehicles. 2023; Available from: https://www.sustainability-management.wiki/docs/industries/road-transport-and-motor-vehicles/. for each employee, including the selected preferred transportation mode as well as the alternative transportation mode and remote work adjustments. At the bottom of this sheet, the number of work weeks per year can be entered and the annual emissions of all employees will be presented. A specific number of workweeks per year was not set automatically because it can vary depending on the company and country.
Individual commuting emissions
In case more than one transportation mode is used for a daily commute the calculator in the sheet ‘Individual Commuting Emissions’ can be used to determine the individual commuting emissions. This is especially useful if an employee has no reliable public transportation option in their location but drives, for example, by car to the next train station, takes the train and the following bus to the workplace. The resulting emissions can be manually copied into the ‘Commuting’ sheet. To make switching between sheets easier the ‘Commuting’ sheet is linked in the instructions and the cells to be copied are shown in green font.
Commuting – Scenario analysis
Different commuting scenarios are presented in the sheet ‘Commuting – Scenario Analysis’. It is based on the entries made by the employees in the sheet ‘Commuting’. The first scenario analysis examines the reduction potential of the alternative transportation mode per day of an individual employee. An employee can be selected from the drop-down list. The selected employee’s emissions of their preferred transportation mode per day as well as the emissions of their alternative transportation mode will be shown, and the emissions saved will be calculated. Second, in a target check, it will be determined whether the selected employee from the first scenario meets the emissions target set at the beginning of the sheet. The third analysis is a work-from-home scenario analysis. After selecting an employee from the drop-down list and entering the usual workdays per week as well as the number of work-from-home days, the amount of emissions saved with x work-from-home days compared to the preferred transportation mode (used for the entire week) will be shown. This scenario analysis is especially interesting for the employees themselves because they can see the direct impact of their daily choices on both their own carbon footprint and the company’s carbon footprint. Additionally, the company can use this information to introduce or encourage remote work and determine office capacity.
Commuting – Ranking
Based on the entries made in the sheet ‘Commuting’ this sheet compares the emissions from using only the preferred transportation mode as selected by the employee with the actual emissions. To calculate the weekly emissions of the preferred transportation mode employees must enter their usual workdays per week. While one might expect the number to be set automatically to 5, there are several examples worldwide in which employees work more than five days per week or the four-day week has already been implemented. At the end of this sheet, a ranking shows the top ten employees who saved the most emissions per week. The ranking is set to 10 entries to account for ties, so if multiple employees saved the same amount of emissions, they will all appear in the list. The need to show more than the top three savings became apparent in a test run in which five employees achieved savings of 60 percent. An example of this case is shown in Figure 1.
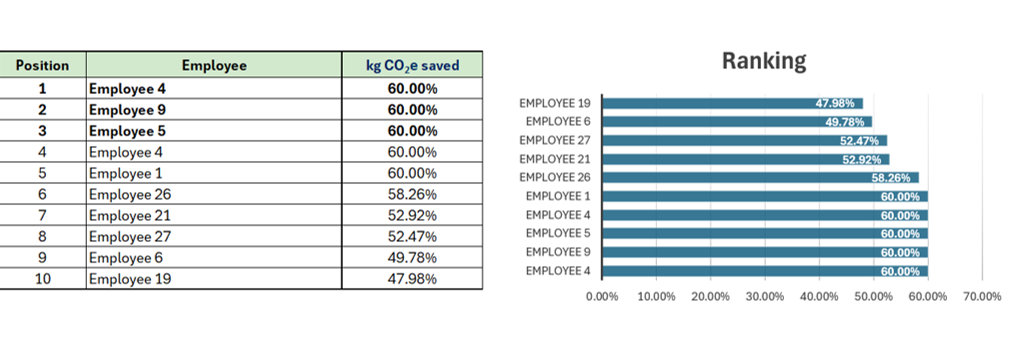
Figure 1: Commuting Ranking with shared positions for equal savings
A bar chart visualizes the savings of the top ten employees. This ranking helps companies to encourage their employees to make more sustainable mobility choices. For example, the company can provide incentives for the top three or 5 employees with the highest savings like paid time off or a monetary bonus.
Freighting goods calculation
While the focus of this tool is on calculating emissions from commuting, the sheet ‘Freighting Goods Calculation’ is designed to calculate greenhouse gas emissions generated by transporting goods. The provided freighting goods factors should be applied specifically to transport goods through a third-party company. This sheet provides a calculation framework for estimating freight emissions and is the only one to rely on already existing data from the company that must be imported into it. During this process it is important to make sure to use the same units or convert them if necessary. Companies’ freight activities and documentation can vary widely; therefore, companies can use their preferred form of documentation and only enter the total distances according to their transportation modes. For several transportation modes two different units are possible: km and tonne.km. The use of tonne.km is preferred for calculating freight emissions, but km can be used if detailed load data is missing. In case the company does not document their freight activities in tonne.km the built-in calculator in this sheet can be used to determine tonne.km by multiplying the weight in tons with distance in kilometers. Because for some transportation modes data is missing in the original sources, there may be some data may not be available in the table. This sheet automatically calculates total emissions by transportation mode and type of transportation (e.g. vans) and at the end the total freight transportation emissions across all modes. Additionally, this sheet helps with corporate planning to see which transportation modes are used and which emit the most.
Data
The sheets ‘Emission Data’ and ‘Freighting Goods – Data’ contain the data used for the calculation extracted from the aforementioned source.
Shortcomings and avenues for future work
A shortcoming of this tool is that it focuses on Scope 3 emissions and neglects Scope 1 and 2 emissions. If this tool is used for the calculation of Scope 1 emissions, the results can be incorrect. To avoid inaccurate use of the calculators, spreadsheets for the calculation of Scope 1 emissions for passenger and delivery vehicles should be added. Further, the emissions source is based on the UK and therefore the data may not be the most representative for every company’s region. The data provided by the UK Government is from 2024 and is expected to be updated annually, meaning this tool must be updated accordingly.
The sustainable mobility tool only allows the selection of set transportation modes. This restriction and the use of average data leads to a risk of inaccurate data. While the option to enter the specific consumption of a transportation mode would make the final results more accurate, it also requires more data sources and especially in the case of public transportation the specific consumption information is usually unknown to users. An additional function for the ‘Commuting’ sheet is the option of carpooling. This was not considered in this tool because employees often have different routes and work hours. Further, the possibility of selecting different units would avoid the need for unit conversions.
Another shortcoming of this tool is that it does not consider the energy consumption of transportation modes like e-bikes and remote-work equipment. The scenario analysis misleadingly depicts that one day of remote work generates zero emissions. But additional emissions from heating at home must be considered and the emissions from remote-work equipment can vary widely.
As this tool’s focus is on commuting emissions the ‘Freighting Goods Calculation’ sheet only determines emissions for each transportation mode and total emissions. Future work should focus more on sustainable supply chain management for example, by integrating the savings potential of alternative transportation modes.
Looking forward, the option to include the effects of incentives should be considered. A company can offer incentives to their employees to encourage more sustainable commuting, for example by building a new bicycle shed, offering e-bike leasing or job tickets for public transport. This addition would rely on data that must be collected over time and may burden employees.
References
- 1José Ignacio Giménez-Nadal, J.A.M., Jorge Velilla, Trends in commuting time of European workers: A cross-country analysis. Transport Policy, 2022. 116: p. 327-342. ↩︎
- 2Hongyue, Y.C., Yunfeng Chen, Greenhouse gas emissions under work from home vs. office: An actitvity-based individual-level accounting model. Applied Energy, 2024. 353. ↩︎
- 3Carlotta Buck, A.L., Mareike Martens. Road transport and motor vehicles. 2023; Available from: https://www.sustainability-management.wiki/docs/industries/road-transport-and-motor-vehicles/. ↩︎
- 4Eurostat. Transport statistics introduced. August 2020; Available from: https://ec.europa.eu/eurostat/statistics-explained/index.php?title=Transport_statistics_introduced. ↩︎
- 5Sarah Mora Esquivel, S.K., Marcel Schröder, Abdel-Malik Maghraoui. Carbon Accouting. 2023; Available from: https://www.sustainability-management.wiki/docs/functions/sustainability-reporting-accounting/carbon-accounting-ghg-protocol/. ↩︎
- 6Rheinland-Pfalz, E. CO₂-Fahrten- und Homeoffice-Rechner. Available from: https://www.energieagentur.rlp.de/info/rechner/CO₂-fahrten-homeoffice-rechner/. ↩︎
- 7Protocol, G.G. Calculation Tools and Guidance. Available from: https://ghgprotocol.org/calculation-tools-and-guidance?ap3c=IGXmCH6WDeDPomoEAGXmCH6mIt-Db9NCNH00dmje0ZqebCmgPw. ↩︎
- 3Carlotta Buck, A.L., Mareike Martens. Road transport and motor vehicles. 2023; Available from: https://www.sustainability-management.wiki/docs/industries/road-transport-and-motor-vehicles/. ↩︎
- 1José Ignacio Giménez-Nadal, J.A.M., Jorge Velilla, Trends in commuting time of European workers: A cross-country analysis. Transport Policy, 2022. 116: p. 327-342. ↩︎
- 2Hongyue, Y.C., Yunfeng Chen, Greenhouse gas emissions under work from home vs. office: An actitvity-based individual-level accounting model. Applied Energy, 2024. 353. ↩︎
- 3Carlotta Buck, A.L., Mareike Martens. Road transport and motor vehicles. 2023; Available from: https://www.sustainability-management.wiki/docs/industries/road-transport-and-motor-vehicles/. ↩︎
- 4Eurostat. Transport statistics introduced. August 2020; Available from: https://ec.europa.eu/eurostat/statistics-explained/index.php?title=Transport_statistics_introduced. ↩︎
- 5Sarah Mora Esquivel, S.K., Marcel Schröder, Abdel-Malik Maghraoui. Carbon Accouting. 2023; Available from: https://www.sustainability-management.wiki/docs/functions/sustainability-reporting-accounting/carbon-accounting-ghg-protocol/. ↩︎
- 6Rheinland-Pfalz, E. CO₂-Fahrten- und Homeoffice-Rechner. Available from: https://www.energieagentur.rlp.de/info/rechner/CO₂-fahrten-homeoffice-rechner/. ↩︎
- 7Protocol, G.G. Calculation Tools and Guidance. Available from: https://ghgprotocol.org/calculation-tools-and-guidance?ap3c=IGXmCH6WDeDPomoEAGXmCH6mIt-Db9NCNH00dmje0ZqebCmgPw. ↩︎
- 3Carlotta Buck, A.L., Mareike Martens. Road transport and motor vehicles. 2023; Available from: https://www.sustainability-management.wiki/docs/industries/road-transport-and-motor-vehicles/. ↩︎